
Reading an Electrocardiogram
Stages of Heart Block

Heart block is a type of arrhythmia that arises from defects in the cardiac conduction system and varies in severity according to the extent of conduction loss. It can occur from a variety causes including a congenital defect, heart attack, or myocarditis (inflammation of the heart muscle). Other types of heart diseases including cardio-myopathy and coronary artery disease may cause heart block. Overdosing on certain drugs or heart surgery has been linked to the defect as well.
Heart block can be classified into three particular categories depending on the extent of damage to the conduction system.
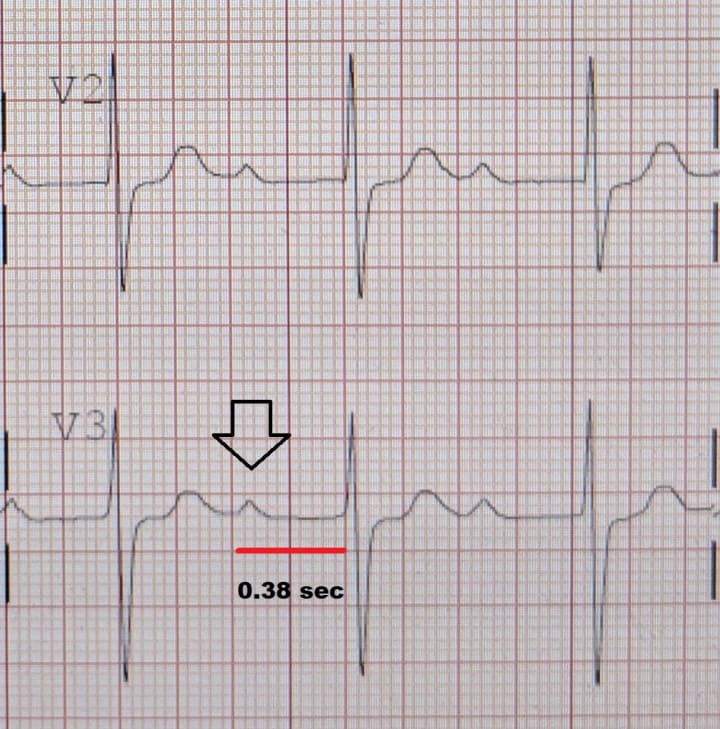
First-degree heart block is associated with an extended AV nodal delay. Instead of the typical 120ms to 200ms displayed by the PR segment, the diseased AV node extends the interval upwards of 200ms on the surface ECG.
In second-degree heart block some electrical signals from the atria don’t reach the ventricles and this results in “dropped beats”. This block may affect every other beat, or every second or third beat. On the ECG, this results in P wave separation from the QRS complex because the ventricles are not always activated.

Third-degree heart block or “complete” heart block occurs when the impulse traveling from the SA node can no longer propagate through to the ventricles in order to initiate contraction. Instead the much slower ventricular autorhythmic cells (Purkinje fibers) take over the pace of contraction. As a result, two independent rhythms can be noted on the electrocardiogram. The hallmark of third degree heart block is the complete lack of relationship between the P waves and the QRS complexes.

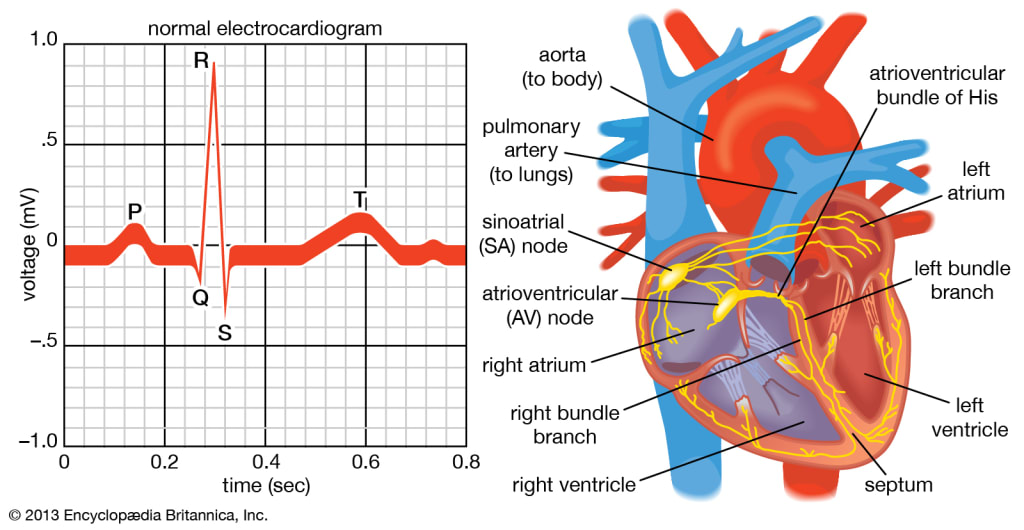
The particular attachment of the electrode leads on the body will determine the manner of deflection for each of the ECG waves.
As an example: the ECG recorded was arranged such that the negative electrode was positioned near the shoulder and the positive electrode was positioned near the left ankle. By convention, an upward deflection represents a movement of current towards the positive electrode. Thus, any charge that is moving in a superior to inferior direction would display an upward deflection. The P wave in particular, is produced as a result of a charge propagating from the SA node to the AV node in a superior to inferior direction. This can also be seen in the first half of the QRS complex as well, where the charge travels down both branches of the Bundle of His, only to revert direction at the apex of the heart. This directional shift is responsible for the subsequent negative RS segment. The T wave would also be expected to have a negative deflection since the charge is traveling in the inferior to superior direction. However, the polarity of the wave is actually reversed because the T wave represents repolarization. Each of the three baseline segments, PR, ST and TP are evident in a normal ECG recording. The first interval between the P wave and QRS complex is designated PR rather than PQ, because the Q deflection is trivial and at times absent from a normal ECG
As previously mentioned above, the PR interval is the parameter to determine the presence of heart block and represents the velocity of current flowing through the AV node. Therefore, a heart block is a condition that would prolong the time of the PR interval from normal values. The ST segment immediately follows the large QRS complex and precedes the T wave. This period between ventricular depolarization and repolarization can be attributed to the plateau phase of the action potential within cardiac contractile cells. During this time Ca2+ permeability increases and the resulting influx helps sustain muscle contraction. The ECG only measures the electrical activity that triggers the subsequent mechanical events and for this reason the ST segment is a flat baseline. The final interval, that also appears to be the longest, is designated TP. This baseline segment lies between ventricular repolarization and atrial depolarization and is dominated by ventricular filling. It is the period of time when the heart prepares for another action potential (AP), from the SA node, to repeat the cycle.
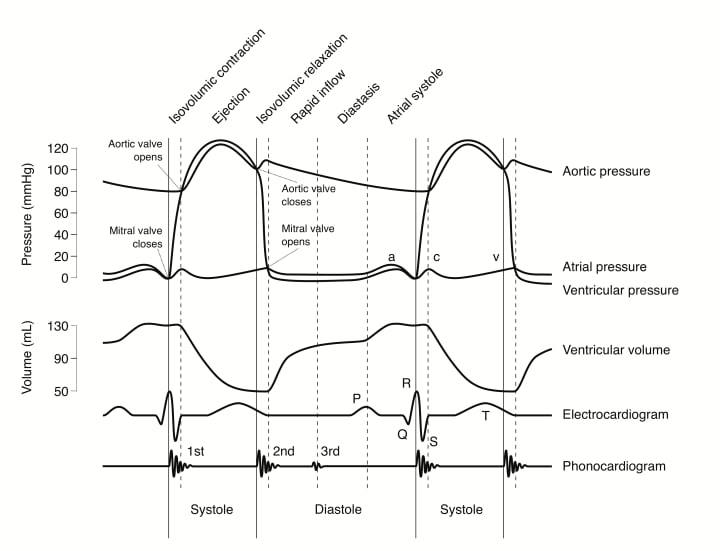
At a point during ventricular systole, ventricular pressure exceeds aortic pressure and the aortic valve is forced open. Once the aortic valve opens blood is ejected into the aorta at high pressure and the aortic pressure curve continues to rise as blood accumulates in the aorta faster than it can drain into the smaller vessels. About halfway through the ejection phase, the contraction of the ventricle ceases and ventricular muscle begins to relax. At first, ventricular pressure does not fall quite as fast as aortic pressure does by draining, so ejection continues. However, ventricular relaxation increases in rate while blood runoff from the aorta decreases, and eventually the pressure in the ventricle falls below aortic pressure. This causes the aortic valve to close and the end of the ejection phase, which typically lasts about 200 msec.
The dicrotic notch on the aortic pressure curve signifies that the aortic valve has slammed shut and subsequent isovolumetric-ventricular relaxation has begun. It appears as a small spike in aortic pressure curve and is a direct result of the backflow of blood necessary to close the valve.
About the Creator
Delusions of Grandeur
Influencing a small group of bright minds with my kind of propaganda.
Keep reading
More stories from Delusions of Grandeur and writers in Longevity and other communities.
Goal Setting for the Runner
Goal setting for performance enhancement is extremely powerful, provided that it’s correctly implemented. As Abraham Lincoln once put it, “A goal properly set is halfway reached.” In other words, identifying goals or convincing people that goals are important is usually not the problem; rather it’s getting people to set the right kind of goals. Goal-setting research, including key theories and psychological effects, as well as specific recommendations for marathon runners and sprinters will be addressed here to assist these athletes in goal implementation.
By Delusions of Grandeur about a year ago in Longevity
Peppermint:
Did you know that peppermint Mentha + Piperita) is a mixture of watermint and spearmint, which is a hybrid of the mint family. Or that there are more than 25 species of Menth but that the peppermint is the most commonly used. I did not know this until I researched this for my peppermint article. It is native to Asia and Europe and is known for its minty flavor.
By Lisa Briskey2 days ago in Longevity
The Business of Nature
Dew drops reflected the light of the sun. The inhabitants of Whispering Woods woke up to the golden droplets of water on the leaves of the flora. The oaks particularly enjoyed the light and the maples did, too. Happiness enveloped all who lived there, even the rocks that cried out in the night delighted in the morning.
By Skyler Saundersa day ago in Fiction


Comments
There are no comments for this story
Be the first to respond and start the conversation.