
Understanding the Rising Three Methods Pattern
Analyzing the Rising Three Methods Pattern on a Chart

Understanding the Rising Three Methods Pattern
In the realm of technical analysis, candlestick patterns play a crucial role in deciphering market trends and predicting future price movements. Among the various candlestick patterns, the Rising Three Methods stands out as a significant continuation pattern that traders and investors keenly observe. By understanding the intricacies of this pattern, one can gain valuable insights into market dynamics and potentially make more informed trading decisions.
Definition and Characteristics
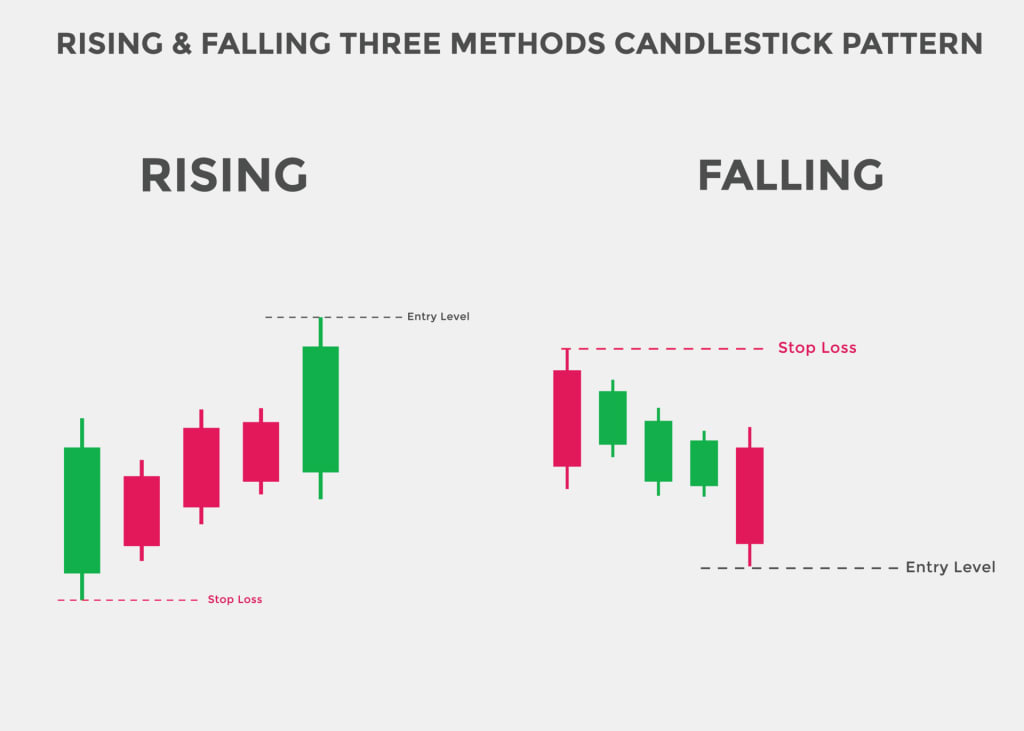
The Rising Three Methods pattern is a bullish continuation pattern that typically occurs during an uptrend. It consists of a long bullish candle, followed by three or more small-bodied bearish candles, and finally, another long bullish candle that closes above the high of the small-bodied candles. This pattern signifies a temporary pause or consolidation within the broader uptrend, suggesting that buyers are regrouping before pushing the price higher.
Continuation Pattern Explanation
Continuation patterns, such as the Rising Three Methods, indicate a temporary consolidation phase within an established trend, implying that the prevailing trend is likely to continue after the pattern completes. In the case of the Rising Three Methods, it suggests that the upward momentum is still intact, and the pause in price action presents an opportunity for traders to enter or add to their long positions.
Requirements for the Pattern
To identify the Rising Three Methods pattern, certain criteria must be met:
1. The market should be in an uptrend.
2. The first candle in the pattern should be a long bullish candle.
3. The following three or more candles should be small-bodied and bearish, with their highs and lows contained within the range of the first candle.
4. The final candle should be a long bullish candle that closes above the high of the small-bodied candles.
Adjusting Pattern Requirements
While the standard requirements for the Rising Three Methods pattern remain consistent, traders can adjust the specific parameters based on their preferred timeframes and trading strategies. For instance, longer timeframes may require a greater number of small-bodied candles for the pattern to be valid, whereas shorter timeframes might accept fewer candles.
Analyzing the Rising Three Methods Pattern on a Chart
To illustrate the practical application of the Rising Three Methods pattern, let's consider a step-by-step analysis using a chart example.
Step-by-Step Analysis:
Identify an existing uptrend in the market.
1. Locate a long bullish candle, which will serve as the starting point of the pattern.
2. Observe the following three or more small-bodied bearish candles that consolidate within the range of the first candle.
3. Look for the final long bullish candle that closes above the high of the small-bodied candles.
4. Confirm that the pattern criteria are met before considering a potential trade setup.
Example with Indicator Settings
To enhance the analysis of the Rising Three Methods pattern, traders often employ technical indicators. One popular indicator that complements candlestick patterns is the Internal Swing Trend Indicator (ISTI). By combining the ISTI with the Rising Three Methods pattern, traders can gain further confirmation of the prevailing trend and potentially increase the accuracy of their trading decisions.
Applying the Rising Three Methods Pattern in Different Market Conditions
While the Rising Three Methods pattern is commonly associated with uptrends, it is worth noting that it can also occur in different market conditions. However, traders should exercise caution and adjust their strategies accordingly when encountering this pattern in downtrends or consolidation phases.
Downtrends and Reversal Patterns
In downtrends, the Rising Three Methods pattern may act as a potential reversal signal rather than a continuation pattern. Traders should pay close attention to other confirming factors, such as trendline breaks, support and resistance levels, or the presence of other reversal candlestick patterns, to validate the potential reversal scenario.
Using Internal Swing Trend Indicator
The Internal Swing Trend Indicator (ISTI) mentioned earlier can be a valuable tool in identifying the prevailing trend and distinguishing between potential continuation and reversal patterns. By incorporating the ISTI into your analysis, you can gain a more comprehensive understanding of market dynamics and make more informed trading decisions.
Understanding Candlestick Patterns
Candlestick patterns have long been an essential component of technical analysis. They provide valuable insights into market sentiment, supply and demand dynamics, and potential trend reversals. Traders and investors who can interpret these patterns effectively have a distinct advantage in navigating the complexities of the financial markets.
The Falling Three Methods Candlestick Pattern
What is the Falling Three Methods Pattern?
The Falling Three Methods pattern is the bearish counterpart of the Rising Three Methods. It occurs during a downtrend and signifies a temporary pause or consolidation before the downtrend resumes. This pattern consists of a long bearish candle, followed by three or more small-bodied bullish candles, and finally, another long bearish candle that closes below the low of the small-bodied candles.
Identifying the Pattern
To identify the Falling Three Methods pattern, look for the following characteristics:
1. A prevailing downtrend in the market.
2. A long bearish candle as the starting point of the pattern.
3. Three or more small-bodied bullish candles consolidating within the range of the first candle.
4. A final long bearish candle that closes below the low of the small-bodied candles.
Interpretation and Significance
Similar to the Rising Three Methods, the Falling Three Methods pattern provides insights into market dynamics and can guide trading decisions. In this case, it suggests that the selling pressure remains strong despite the temporary consolidation, indicating a potential continuation of the downtrend.
Trading Strategy with the Falling Three Methods Pattern
Trading the Breakout and Pullback
A common approach to trading the Falling Three Methods pattern is to wait for a breakout below the low of the pattern and enter a short position. Traders can then look for a pullback towards the breakout level to further validate the downtrend continuation before targeting potential profit levels.
Setting Stop Loss and Take Profit Levels
Risk management is crucial in any trading strategy. When trading the Falling Three Methods pattern, setting appropriate stop loss and take profit levels is essential. Stop loss orders can be placed above the pattern's high, while take profit levels can be determined based on support levels, Fibonacci extensions, or other technical analysis tools.
Alternative Trading Approaches
While the breakout and pullback strategy is commonly used, traders may explore alternative approaches based on their risk appetite and trading style. These could include scaling into positions, using trailing stop orders, or combining the Falling Three Methods pattern with other technical indicators or chart patterns for additional confirmation.
Risk Management and Position Sizing
Proper risk management and position sizing are critical aspects of successful trading. Traders should always consider their risk tolerance, account size, and the potential risk-reward ratio before entering any trade. Implementing appropriate position sizing techniques, such as the percentage risk method or the fixed-dollar risk method, can help mitigate losses and optimize returns.
Examples and Case Studies
Example 1: Bearish Trade Setup
Let's consider an example to illustrate the application of the Falling Three Methods pattern in a real-world scenario. Suppose a stock is in a well-established downtrend, and we identify the Falling Three Methods pattern within the price action. After a breakout below the pattern's low, we enter a short position, setting a stop loss above the pattern's high and targeting a predefined take profit level based on technical analysis.
Example 2: Conservative Swing Trade
In another scenario, a conservative swing trader might wait for additional confirmation before entering a trade based on the Falling Three Methods pattern. This could involve waiting for the price to break below a significant support level or combining the pattern with other technical indicators, such as moving averages or oscillators, to validate the trade setup.
Conclusion
The Rising Three Methods and Falling Three Methods candlestick patterns provide valuable insights into market dynamics and can guide traders in making more informed trading decisions. By understanding the characteristics, identification process, and potential trading strategies associated with these patterns, traders can gain a competitive edge and improve their overall performance in the financial markets.
Case Study: Applying the Rising Three Methods Pattern
Let's delve into a case study to further understand the practical application of the Rising Three Methods pattern. Imagine you are a trader analyzing the price action of a particular stock in an uptrend. Here's a step-by-step analysis using a chart example:
Identify an existing uptrend in the market: Begin by identifying a clear and established uptrend in the stock's price action. Look for higher highs and higher lows, indicating upward momentum.
Locate a long bullish candle: Look for a long bullish candle that serves as the starting point of the Rising Three Methods pattern. This candle should be significantly larger than the subsequent small-bodied bearish candles.
Observe the small-bodied bearish candles: Next, observe the following three or more small-bodied bearish candles that consolidate within the range of the first bullish candle. These candles should have their highs and lows contained within the range of the first candle.
Look for the final long bullish candle: Finally, look for the final long bullish candle that closes above the high of the small-bodied bearish candles. This candle confirms the continuation of the uptrend and serves as a potential entry signal.
Confirm pattern criteria: Before considering a potential trade setup based on the Rising Three Methods pattern, it's essential to confirm that all the pattern criteria are met. Ensure that the market is in an uptrend, the candle sizes and formations align with the pattern, and the final bullish candle closes above the highs of the small-bodied bearish candles.
By conducting this step-by-step analysis, traders can identify potential trade setups and make more informed decisions based on the Rising Three Methods pattern.
Trading Strategies with the Rising Three Methods Pattern
Once the Rising Three Methods pattern is identified and confirmed, traders can employ various strategies to capitalize on its potential bullish continuation. Here are a few common strategies:
Trading the breakout: One approach is to wait for a breakout above the high of the final bullish candle. This breakout confirms the resumption of the uptrend, and traders can enter long positions to ride the upward momentum.
Scaling into positions: Another strategy is to scale into positions by entering partial positions after confirming the Rising Three Methods pattern. Traders can then add to their positions on subsequent pullbacks or breakouts, gradually increasing exposure to the uptrend.
Using additional technical indicators: Traders may incorporate other technical indicators, such as moving averages or oscillators, to confirm the strength of the uptrend and identify optimal entry and exit points.
Remember, it's crucial to implement proper risk management techniques, such as setting stop-loss orders to limit potential losses, and consider other factors like overall market conditions and fundamental analysis when making trading decisions.
FAQs
Q1. What is a continuation pattern?
A continuation pattern is a technical analysis pattern that suggests a temporary pause or consolidation within an established trend. It indicates that the prevailing trend is likely to continue after the pattern completes.
Q2. Can the Rising Three Methods pattern occur in downtrends?
While the Rising Three Methods pattern is commonly associated with up trends, it can occur in different market conditions. However, traders should exercise caution and adjust their strategies accordingly when encountering this pattern in downtrends or consolidation phases.
Q3. What is the Internal Swing Trend Indicator (ISTI)?
The Internal Swing Trend Indicator (ISTI) is a technical indicator that complements candlestick patterns. It helps traders identify the prevailing trend and distinguish between potential continuation and reversal patterns, providing further confirmation of market dynamics.
Q4. How can I manage risk when trading the Falling Three Methods pattern?
Risk management is crucial in trading. When trading the Falling Three Methods pattern, it's important to set appropriate stop loss and take profit levels. Additionally, implementing proper position sizing techniques can help mitigate losses and optimize returns.
Q5. Are there alternative trading approaches for the Falling Three Methods pattern?
Yes, traders can explore alternative trading approaches based on their risk appetite and trading style. These may include scaling into positions, using trailing stop orders, or combining the Falling Three Methods pattern with other technical indicators or chart patterns for additional confirmation.
About the Creator
Jeewan Goswami
Hi Iam Jeewan Goswami
Keep reading
More stories from Jeewan Goswami and writers in Trader and other communities.
The Long-Legged Doji: A Sign of Market Indecision
The Long-Legged Doji: A Sign of Market Indecision In the world of technical analysis, candlestick patterns hold a special place. These patterns, formed by the open, close, high, and low prices of a trading session, provide valuable insights into market sentiment and potential future price movements. One such pattern that often captures the attention of traders is the Long-Legged Doji. With its unique characteristics, the Long-Legged Doji serves as a powerful signal of market indecision. Let's delve into this intriguing candlestick pattern and explore its implications for traders.
By Jeewan Goswami12 months ago in Trader
The Importance of Handbags for Women
SHOES MAKE THE MAN, HANDBAGS MAKE THE WOMAN". IN THE PRESENT ERA, BEAUTIFUL HANDBAGS ARE NOT JUST JEWELRY THAT REPRESENTS THE PERSONALITY AND STYLE OF THE PERSON THAT IS THE CARER, BUT IT IS ALSO A PAIR OF JEWELERY. AN INdispensable FASHION ACCESSORY FOR WOMEN. WE OFTEN ENCOUNTER THE IMAGE OF WOMEN ALWAYS CARRYING A FASHIONABLE BAG WITH THEM WHETHER GOING OUT, GOING TO WORK OR GOING TO THE BEACH FIND OUT WHAT CAUSES HANDBAGS TO BECOME SO MUCH FOR WOMEN!
By THAI PHUNG4 days ago in Trader
- Supported by: Ollie
Why Indie and Otis Came to Love OllieSupported by: Ollie
Like most dog moms, the best part of my day is the time spent with my dogs. I have an 8 year old Pittie mix named Indie and a two year old Frenchie mix named Otis. Indie is my soul dog and the love of my life. She has inspired me to become a photographer, a business owner, and a creator, among other things. She is the smartest and most loyal creature who selflessly makes sure that I’m happy above all else. Most of the time, she knows how I’m feeling before I do. When we’re together, she’s my shadow–never more than a few inches from me at all times.
By Brittney Avery6 days ago in Petlife


Comments
There are no comments for this story
Be the first to respond and start the conversation.