
The Long-Legged Doji: A Sign of Market Indecision
Understanding the Long-Legged Doji

The Long-Legged Doji: A Sign of Market Indecision
In the world of technical analysis, candlestick patterns hold a special place. These patterns, formed by the open, close, high, and low prices of a trading session, provide valuable insights into market sentiment and potential future price movements. One such pattern that often captures the attention of traders is the Long-Legged Doji. With its unique characteristics, the Long-Legged Doji serves as a powerful signal of market indecision. Let's delve into this intriguing candlestick pattern and explore its implications for traders.
Understanding the Long-Legged Doji
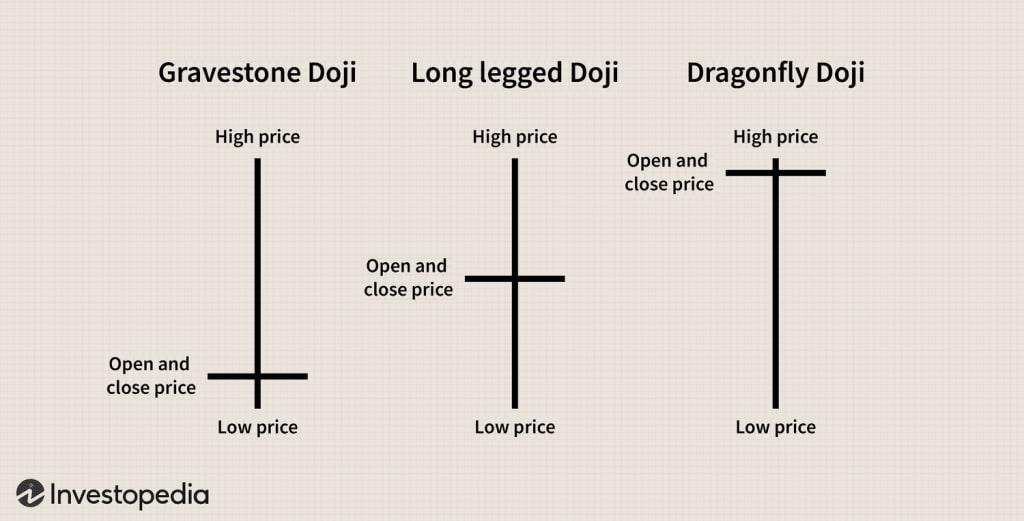
A doji is a candlestick pattern that occurs when the open and close prices are nearly identical, resulting in a very short or nonexistent body. This formation suggests that the forces of supply and demand are in equilibrium, creating a state of indecision between buyers and sellers. The Long-Legged Doji takes this concept a step further by incorporating long upper and lower shadows, also known as wicks or tails.
Visually, the Long-Legged Doji resembles a cross or a plus sign. The upper and lower shadows extend significantly beyond the length of the body, indicating that prices fluctuated widely during the trading session. This wide range signifies a battle between bulls and bears, as both sides struggled for control but ultimately failed to establish dominance.
Implications for Future Price Action
The significance of the Long-Legged Doji lies in its implications for future price action. This pattern suggests that the market sentiment is in a state of uncertainty, and a potential trend reversal or consolidation may be on the horizon. Traders interpret the Long-Legged Doji as a signal to exercise caution and wait for further confirmation before taking any trading positions.
To effectively utilize the Long-Legged Doji pattern, traders often look for additional technical indicators or confirmation signals. For instance, if the Long-Legged Doji forms after a prolonged uptrend, it could indicate that buyers are losing steam, and a potential reversal might be imminent. In contrast, if the pattern occurs after a downtrend, it suggests that sellers are becoming exhausted, possibly paving the way for a bullish reversal.
Confirmation signals can come in various forms, such as a break above or below the high or low of the Long-Legged Doji formation. This break signifies that either buyers or sellers have gained the upper hand and confirms the direction of the potential trend reversal. Additionally, traders may look for other candlestick patterns, trendlines, or support and resistance levels to strengthen their analysis.
The Importance of Holistic Analysis
It is essential to note that while the Long-Legged Doji provides valuable insights into market sentiment, it is not infallible and should not be relied upon as a standalone signal. Technical analysis is a holistic approach that combines multiple indicators and patterns to increase the probability of making accurate predictions.
Traders should consider incorporating other tools and techniques into their analysis, such as moving averages, oscillators, or volume indicators. By combining these different elements, traders can gain a more comprehensive understanding of the market dynamics and make more informed trading decisions.
Conclusion
In conclusion, the Long-Legged Doji is a candlestick pattern that captures the essence of market indecision. With its distinct visual characteristics and implications for future price action, it serves as a valuable tool for traders. By understanding the dynamics of this pattern and combining it with other technical indicators, traders can enhance their decision-making process and potentially capitalize on market reversals or consolidations. Remember, the key to successful trading lies in thorough analysis and prudent risk management.
FAQs
1. Is the Long-Legged Doji a reliable signal for trading decisions?
While the Long-Legged Doji provides valuable insights, it should not be solely relied upon for trading decisions. Traders should consider other technical indicators and confirmation signals to increase the probability of accurate predictions.
2. Can the Long-Legged Doji predict a trend reversal?
Yes, the Long-Legged Doji can indicate a potential trend reversal. If it forms after a prolonged uptrend, it suggests buyer exhaustion, while after a downtrend, it indicates seller fatigue.
3. Are there other candlestick patterns that work well with the Long-Legged Doji?
Yes, traders often combine the Long-Legged Doji with other candlestick patterns, trendlines, or support and resistance levels to strengthen their analysis and confirm potential trend reversals.
4. How should traders manage risk when using the Long-Legged Doji?
Traders should always employ prudent risk management strategies, such as setting stop-loss orders and position sizing according to their risk tolerance, even when using the Long-Legged Doji as a trading signal.
5. Can the Long-Legged Doji be applied to different timeframes?
Yes, the Long-Legged Doji can be applied to various timeframes, including intraday and longer-term charts. Traders should adjust their analysis and trading strategies accordingly based on the timeframe they are working with.
About the Creator
Jeewan Goswami
Hi Iam Jeewan Goswami
Keep reading
More stories from Jeewan Goswami and writers in Trader and other communities.
The Impact of SEC Charges on the Crypto Market|What is next move of crypto market.
In recent days, the crypto market has experienced a whirlwind of events that have sent shockwaves throughout the industry. The Securities and Exchange Commission (SEC) has taken action against major players in the market, including Binance and Coinbase. These developments have sparked a debate about the future of cryptocurrencies and the role of regulations in the industry. In this article, we will explore the implications of the SEC charges and their impact on the market.
By Jeewan Goswami11 months ago in Trader
"Stride in Style: Discover the ALDO Men's Albeck Oxford"
In the realm of men's footwear, finding the perfect balance between style, comfort, and versatility can often feel like an elusive quest. Yet, amidst the sea of options, there emerges a beacon of excellence that embodies these qualities seamless: the ALDO Men's Albeck Oxford. As a distinguished member of ALDO's esteemed lineup, the Albeck Oxford stands as a testament to the brand's commitment to crafting footwear that not only exudes sophistication but also delivers unparalleled comfort and durability.
By Kim Long Nguyệt Ngữ28 days ago in Trader
The Road to Nowhere
Trigger warnings: Violence, Death. "May the Sun burn your tongue out, woman," Fredrick's father screamed the curse into his mother's ear as their elegant little carriage rumbled along, its polished wood and gilded trim glinting in the torchlight. They had just left the small village of Saffron and were on an unnamed road to the capital for the Royal wedding. Fredrick leaned back in his plush velvet seat to escape into the passing landscape, but across from him sat the servant boy, a scrappy lad named Jack. Jack's eyes held a mixture of awe and fear, the kind that only a commoner could feel in the presence of nobility. Jack looked up and caught Fredrick's gaze, offering him a sad little smile before reaching into his pocket and retrieving a little caramel treat. This candy was no doubt stolen from the kitchen treat cupboard; if he was caught with it, he would be locked in the box as punishment.
By Frank English6 days ago in Fiction


Comments
There are no comments for this story
Be the first to respond and start the conversation.