
Understanding the Tweezer Top and Bottom Candlestick Patterns
Key Elements of Tweezer Patterns

In this article, we will delve into the fascinating world of candlestick patterns and focus specifically on a pattern known as the Tweezer Top and Bottom. Candlestick patterns are powerful tools in technical analysis, providing insights into potential trend reversals. The Tweezer Top and Bottom patterns are reversal candlestick patterns that can be found on various time frames. However, it is important to note that they represent potential reversals and not guaranteed ones. Let's explore these patterns and learn how to identify and trade them effectively.
In this article from Jeewan, we discussed the candlestick pattern known as the Tweezer Top and Bottom. These patterns are two-bar reversal candlestick patterns that can potentially indicate a reversal in the current trend. It is important to note that while they represent potential reversals, they do not guarantee them.
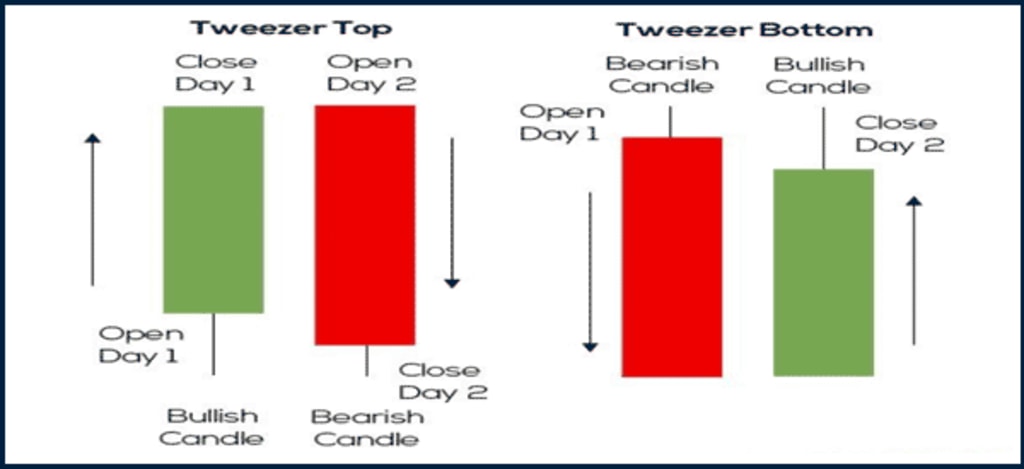
The Tweezer Bottom is a bullish reversal pattern that signals the potential end of a downtrend. It consists of two key elements. The first candlestick is a long body that shows sellers are in control. The second candlestick can take various forms, such as a large body bar, doji candle, hammer, or hanging man. The important characteristic is the equal lows with the bottoms, indicating a potential change in trend.
On the other hand, the Tweezer Top is a bearish reversal pattern that shows the potential end of an uptrend. The first candlestick also has a long body, indicating bullish control. The second candlestick should have equal highs with the tweezer tops, suggesting a potential reversal. If the second candlestick is a bearish hanging man, it could serve as an entry signal for short positions.
To trade these patterns effectively, traders should consider the strength of the first candlestick, the alignment of highs and lows, and the presence of confirming variables. The frequency of occurrence may vary, and traders often prefer the first candlestick to have a large real body. Support and resistance levels can provide additional confirmation for potential reversals.
It is essential to test your trading plan before entering the market with real money. Tweezer patterns can be valuable additions to your trading strategy, but it is crucial to understand their implications and consider other factors for successful trading.
Tweezer patterns can appear quite frequently on price charts, depending on the trader's criteria for matching highs and lows. Some traders prefer tighter criteria, while others allow for more flexibility. Ultimately, it's important to find a balance that suits your trading style and preferences.
When considering a trade based on Tweezer patterns, it's beneficial to identify key areas where these patterns occur. Support and resistance levels, as well as previous swing points, can serve as potential locations for Tweezer patterns. Finding these patterns at such levels increases the probability of a reversal or continuation of the trend.
Let's explore two scenarios: a tweezer bottom in an uptrend and a tweezer bottom in a downtrend. In an uptrend, the tweezer bottom signals a potential reversal. Traders can look for a tweezer bottom near the bottom of a range or just under a support level. This setup indicates that the overall trend direction is upward. Traders can take advantage of the reversal by entering long positions.
In a downtrend, finding reversals during a corrective decline can be more challenging. However, a tweezer bottom can still indicate a potential change in direction. Traders can look for a tweezer bottom at a former resistance level that is now acting as support. This setup suggests that price may reverse its downward movement and start making higher highs. It can be an opportunity to enter long positions.
It's worth noting that the second candlestick in the Tweezer pattern often takes the form of an inside bar, indicating a consolidation on a lower time frame. Traders can use a break of the high or low of the inside candlestick as an entry signal, placing their stop-loss order below the low of the two-candle pattern.
When trading Tweezer tops, which indicate a potential end to an uptrend or a reversal off a corrective rally in a down trending market, similar principles apply. Traders look for equal highs with the Tweezer tops and a bearish candlestick as the second candle. This setup can signal a potential trade entry for short positions.
It's important to remember that Tweezer patterns represent the failure of a strong move to advance in a particular direction. Understanding this theory behind the pattern allows traders to make more informed decisions. Confirming variables, such as support and resistance zones or technical indicators, can further enhance the probability of a successful trade.
In conclusion, Tweezer patterns are valuable tools in a trader's arsenal. They can provide insights into potential trend reversals and offer trade opportunities. However, it's essential to test your trading plan and consider additional factors before executing trades with real money. By incorporating Tweezer patterns into your trading strategy and applying sound risk management principles, you can increase your chances of success in the dynamic world of financial markets.
What are Tweezer Tops?
A Tweezer Top is a bearish reversal pattern that indicates the potential end of an uptrend. It consists of two key candlesticks. The first candlestick typically has a long body, indicating strong bullish momentum. The second candlestick can take various forms, such as a large body bar, doji candles, hammers, or hanging mans. The crucial characteristic of a Tweezer Top is that it shows equal highs with the first candlestick, representing a potential failure to make a new high price.
What are Tweezer Bottoms?
On the other hand, a Tweezer Bottom is a bullish reversal pattern that suggests the potential end of a downtrend. It also consists of two candlesticks. The first candlestick has a long body, indicating significant bearish sentiment. The second candlestick can have different shapes, but the important aspect is that it shows equal lows with the first candlestick, suggesting a potential shift in market sentiment.
Key Elements of Tweezer Patterns
Candlestick Type and Directional Intent
The type of candlestick in the Tweezer pattern plays a crucial role in understanding its implications. The first candlestick's long body indicates directional intent, whether it is bullish or bearish. For example, in a Tweezer Bottom, a strong red candlestick demonstrates that sellers are in control, while in a Tweezer Top, large-bodied bullish candles signify the dominance of bulls.
Equal Highs and Lows
To confirm the validity of a Tweezer pattern, it is essential to observe equal highs with Tweezer Tops and equal lows with Tweezer Bottoms. While the highs and lows don't have to be exact due to market imperfections, they should be close enough to indicate a potential reversal.
Interpreting the Tweezer Top Pattern
Bulls in Charge
During an uptrend, the Tweezer Top pattern represents a moment when bulls are driving the market higher. This is evident through large-bodied candles in the first candlestick of the pattern.
Failure to Make New Highs
In a Tweezer Top pattern, the second candlestick reveals the failure of bulls to make a new high price. This failure often leads to profit-taking by existing long positions or the entry of new short positions.
Potential Reversal Opportunities
The character of the first candlestick influences the potential of a reversal. The more bullish the first candlestick, the higher the probability of a reversal. Traders observe this pattern to identify a potential change in trend and make informed decisions based on its implications.
Analyzing the Tweezer Bottom Pattern
Sellers Happy with Profits
In a downtrend, the Tweezer Bottom pattern signifies sellers' satisfaction with their profits. Price encounters resistance and starts to reverse, creating an opportunity for bulls to enter the market.
Price Finds Resistance and Reverses
On the second day of a Tweezer Bottom pattern, the opening candlestick may briefly appear red as it makes a low off the open. Sellers, seeing the strong bearish sentiment of the first day, anticipate further downside movement and wait for the price to break the support low of the first candlestick. However, if the price reverses and turns into a bullish candlestick (often referred to as "red to green"), it can serve as an entry signal for long positions.
Entry Opportunities for Longs
The Tweezer Bottom pattern indicates a potential trend reversal, leading to higher highs in the market. Traders can use this pattern to identify entry points for long positions and take advantage of the shift in market sentiment.
Trading Strategies for Tweezer Patterns
Frequency of Occurrence
Tweezer patterns can appear frequently, depending on the trader's criteria for matching highs and lows. Traders often prefer the first candlestick to have a large real body to indicate less indecision in the market. The frequency of occurrence may vary based on individual preferences and trading strategies.
Criteria for Selecting Patterns
When selecting Tweezer patterns, traders consider various factors, such as the strength of the candlestick, the alignment of highs and lows, and the presence of confirming variables. These variables can include support and resistance levels, technical indicators, or previous swing points. By combining these elements, traders enhance the probability of identifying reliable reversal opportunities.
Support and Resistance Levels
To increase the likelihood of successful trades, traders often look for Tweezer patterns at support or resistance levels. These levels indicate areas where price has previously stalled or reversed, providing a stronger foundation for potential reversals.
Using Confirming Variables
Traders can complement the Tweezer pattern with other confirming variables to enhance their trading decisions. These variables may include additional technical indicators, price action signals, or trend analysis. By considering multiple factors, traders gain a more comprehensive understanding of the market and increase the accuracy of their trades.
FAQs (Frequently Asked Questions)
1. What is the purpose of Tweezer patterns in trading?
Tweezer patterns help traders identify potential trend reversals and make informed trading decisions based on shifts in market sentiment.
2. Do Tweezer patterns guarantee a trend reversal?
No, Tweezer patterns indicate potential reversals but do not guarantee them. Traders should consider other factors and confirming variables before making trading decisions.
3. What are some confirming variables that traders can use with Tweezer patterns?
Traders can use support and resistance levels, technical indicators, and price action signals as confirming variables to enhance the reliability of Tweezer patterns.
4. How frequently do Tweezer patterns occur?
The frequency of Tweezer patterns depends on individual trading criteria and market conditions. Traders can adjust their criteria to match their preferred frequency of occurrence.
5. Should Tweezer patterns be used for short-term or long-term trades?
Tweezer patterns are commonly used for short-term trades as they indicate potential reversals in the immediate price action. Long-term trades should be confirmed by additional price action or indicators.
About the Creator
Jeewan Goswami
Hi Iam Jeewan Goswami
Keep reading
More stories from Jeewan Goswami and writers in Trader and other communities.
Rising Window Candlestick Pattern in English
Rising Window Candlestick Pattern in English Candlestick patterns are widely used in technical analysis to predict price movements and make informed trading decisions. Among the various candlestick patterns, the Rising Window pattern holds a significant place. In this article, we will delve into the Rising Window candlestick pattern, its characteristics, identification methods, and how it can be utilized in trading strategies.
By Jeewan Goswami11 months ago in Trader
Valve Supplier in Nigeria
African Valve is the top Valve Supplier in Nigeria. African Valve stands as the premier supplier and manufacturer of valves across Africa with a commitment to excellence, we ensure top-notch products and services. We proudly serve clients across Africa, including Nigeria, Kenya, Algeria, Ghana, Tanzania, Sudan, and Ethiopia, ensuring reliable access to top-tier valve solutions continent-wide. As a reputed valve supplier we provide different types of valves available in different sizes and classes made with high standard material quality to meet the needs of various industries.
By african valve7 days ago in Trader


Comments
There are no comments for this story
Be the first to respond and start the conversation.