
Supply and Demand Indicator
Best strategy Supply and Demand Indicator
The Supply and Demand Indicator is a technical analysis tool used in trading that attempts to identify potential imbalances between buyers and sellers in a financial market. The indicator is based on the idea that price movements occur as a result of changes in supply and demand. When demand for a security is high and there is limited supply, prices tend to rise, and when supply is high and demand is low, prices tend to fall.

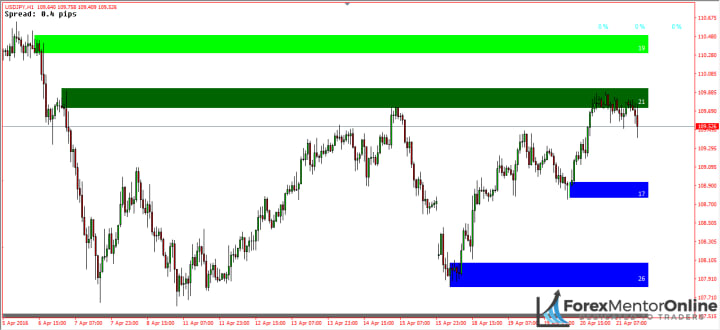
The Supply and Demand Indicator aims to identify areas on a price chart where these imbalances may occur, providing traders with potential entry and exit points. It does this by plotting potential supply and demand levels as horizontal lines on a chart, based on historical price and volume data. These levels are believed to act as support and resistance levels, potentially indicating a change in market sentiment.
One of the key advantages of using a Supply and Demand Indicator is that it can help traders to identify potential price movements before they occur. By identifying areas where supply and demand may be imbalanced, traders can enter positions in anticipation of price movements, potentially increasing their chances of profit.
Another advantage of using a Supply and Demand Indicator is that it can help traders to determine potential price targets. By identifying areas where demand is high and supply is limited, traders can set profit targets at these levels, potentially increasing their chances of success.

It's important to note that no technical indicator is a guarantee of success and that all trading carries a certain degree of risk. Traders should always use multiple indicators in conjunction with each other, as well as incorporate other forms of analysis, such as fundamental and market sentiment, to make informed trading decisions.
Additionally, traders should always use proper risk management techniques, such as setting stop loss orders, to limit their potential losses. The use of a Supply and Demand Indicator should be part of a comprehensive trading strategy, and traders should have a solid understanding of how the indicator works and how to interpret its signals before incorporating it into their trading plan.

In conclusion, the Supply and Demand Indicator can be a valuable tool for traders looking to identify potential imbalances in supply and demand and potentially profit from price movements that result from these imbalances. However, as with all technical indicators, it should be used in conjunction with other forms of analysis and proper risk management techniques to increase the chances of success.
Supply and Demand Indicator
Supply and demand is a fundamental principle of economics that shapes the functioning of markets and affects the price of goods and services. The supply and demand indicator is a tool used in technical analysis to identify changes in the supply and demand dynamics of a particular asset, with the aim of predicting future price movements. In this essay, we will explore the concept of supply and demand and how it relates to the stock market, as well as the mechanics and application of the supply and demand indicator in stock trading.
Supply and demand is the basis of market economics, and it refers to the interaction between buyers and sellers in determining the price of a good or service. The law of supply and demand states that the price of an asset will rise when demand for the asset exceeds the supply, and the price will fall when supply exceeds demand. In the stock market, supply and demand dynamics are influenced by a variety of factors such as changes in the economy, interest rates, consumer sentiment, and market expectations.
In the stock market, the supply and demand indicator is used to identify changes in the supply and demand dynamics of a particular stock. It is a visual representation of the relationship between the quantity of a stock that is available and the quantity that is desired by buyers. The indicator is constructed by plotting the high, low, and closing prices of a stock, and it is used to identify areas where the price of the stock may change direction based on the forces of supply and demand.
The supply and demand indicator can be used to make trading decisions by identifying areas of support and resistance. Support is an area where there is a large amount of buying pressure, and the price of the stock is likely to rise. Resistance is an area where there is a large amount of selling pressure, and the price of the stock is likely to fall. By identifying areas of support and resistance, traders can make informed decisions about when to buy or sell a stock.
In addition to its use as a trading tool, the supply and demand indicator can also be used to confirm trends in the stock market. When the price of a stock is in an uptrend, the indicator will show that there is more demand for the stock than there is supply, and the price will continue to rise. When the price of a stock is in a downtrend, the indicator will show that there is more supply of the stock than there is demand, and the price will continue to fall.
The supply and demand indicator is a relatively simple tool to use, and it can be applied to any stock or financial asset that is traded on a market. However, like all technical analysis tools, it is important to understand that the indicator is not a guarantee of future price movements and that other factors such as macroeconomic events, market sentiment, and investor behavior also play a role in determining stock prices.
In conclusion, the supply and demand indicator is a powerful tool for stock traders, as it provides a visual representation of the supply and demand dynamics of a stock and can help traders make informed decisions about when to buy or sell. By understanding the underlying principles of supply and demand and how they affect the stock market, traders can use the supply and demand indicator to enhance their investment strategies and potentially improve their returns. However, it is important to approach the use of the indicator with caution, as it is not a guarantee of future results, and other factors such as market sentiment and macroeconomic events also play a role in determining stock prices.
About the Creator
Enjoyed the story? Support the Creator.
Subscribe for free to receive all their stories in your feed. You could also pledge your support or give them a one-off tip, letting them know you appreciate their work.
Keep reading
More stories from writers in Trader and other communities.
The Role of Data Governance in the Investment Lifecycle
Your investment decisions should hinge on the accuracy, security, and accessibility of information. In this article, therefore, I have delved into the crucial role of data governance throughout the investment lifecycle.
By Sponsorcloud3 days ago in Trader


Comments
There are no comments for this story
Be the first to respond and start the conversation.