
Bullish & Bearish Kicker Candlestick Patterns: A Comprehensive Guide
Understanding Candlestick Patterns

We will explore one of the most powerful candlestick patterns known as the Bullish and Bearish Kicker Candlestick Patterns. Candlestick patterns are widely used in technical analysis to predict market trends and potential reversals. While these patterns are not foolproof and require confirmation from other signals, understanding them can provide valuable insights for traders and investors.
Understanding Candlestick Patterns
Before diving into the specifics of Bullish and Bearish Kicker Candlestick Patterns, let's briefly review the basics of candlestick charts. Candlestick charts display the price movement of an asset over a specific time period. Each candlestick represents a trading session, displaying the opening, closing, high, and low prices.
The body of the candlestick is filled or colored differently to represent bullish or bearish sentiment. The upper and lower wicks, also known as shadows, indicate the price range between the high and low of the session. Candlestick patterns emerge from the combination of these elements, offering valuable information about market sentiment and potential trend reversals.
What are Bullish and Bearish Kicker Candlestick Patterns?
Bullish and Bearish Kicker Candlestick Patterns are considered reversal patterns, signaling a potential shift in market sentiment. These patterns consist of two candlesticks and are characterized by a significant price change between them. The Bullish Kicker Pattern occurs at the end of a downtrend, while the Bearish Kicker Pattern appears at the end of an uptrend.
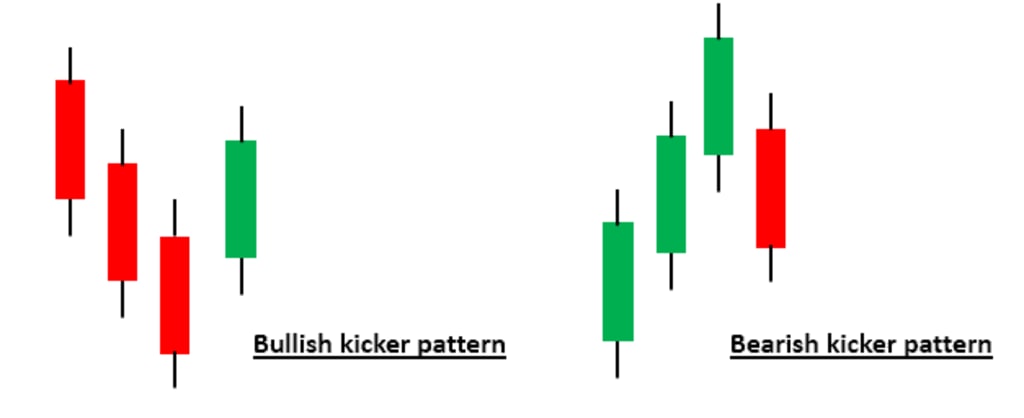
Bullish Kicker Candlestick Pattern
The Bullish Kicker Pattern starts with a red candlestick, representing a downtrend. It is followed by a large green candlestick with a substantial body. The size of the body is more important than the wicks or shadows, as it indicates strong conviction and a potential reversal. While the Bullish Kicker Pattern is a two-candlestick pattern, the preceding downtrend is crucial for its validity.
Bearish Kicker Candlestick Pattern
Contrary to the Bullish Kicker Pattern, the Bearish Kicker Pattern begins with a green candlestick, indicating an uptrend. It is then followed by a significant red candlestick with a large body. Similar to the Bullish Kicker, the size of the body holds more significance than the wicks or shadows. The Bearish Kicker Pattern suggests a conviction to the downside and a potential reversal. It is important to note that the Bearish Kicker Pattern requires a preceding uptrend for its relevance.
The Importance of Preceding Trend
The preceding trend plays a vital role in the interpretation of Bullish and Bearish Kicker Candlestick Patterns. Without a clear downtrend for the Bullish Kicker or uptrend for the Bearish Kicker, the patterns lose their significance. The presence of a well-established trend adds weight to the potential reversal signaled by the Kicker patterns.
In the case of the Bullish Kicker, the preceding downtrend indicates selling pressure and pessimism in the market. The sudden shift to a large bullish candlestick suggests a swift change in sentiment, with buyers stepping in aggressively. This change in behavior can be a strong indication of a trend reversal and a potential buying opportunity.
Similarly, for the Bearish Kicker, the preceding uptrend demonstrates buying interest and optimism among market participants. The subsequent appearance of a large bearish candlestick signifies a sudden shift in sentiment, indicating that sellers have taken control. This reversal in sentiment may suggest that the uptrend has exhausted its momentum and a potential selling opportunity could arise.
The Role of Gaps in Kicker Candlestick Patterns
Gaps, or spaces between the closing price of one candlestick and the opening price of the next, play an important role in Kicker Candlestick Patterns. Gaps can provide additional confirmation of the reversal signaled by the pattern.
In the case of the Bullish Kicker, a gap up between the two candlesticks strengthens the bullish sentiment. It indicates a significant increase in buying pressure, with the opening price of the second candlestick being higher than the previous candlestick's closing price. This reinforces the idea of a trend reversal and suggests that buyers are in control.
On the other hand, for the Bearish Kicker, a gap down between the two candlesticks adds to the bearish sentiment. It represents a substantial increase in selling pressure, with the opening price of the second candlestick being lower than the previous candlestick's closing price. This reinforces the notion of a potential trend reversal to the downside and suggests that sellers have taken charge.
Examples of Bullish and Bearish Kicker Patterns
Let's explore a couple of examples to further illustrate the Bullish and Bearish Kicker Candlestick Patterns:
Example 1: Bullish Kicker
Day 1: A red candlestick indicating a downtrend.
Day 2: A large green candlestick with a substantial body, opening higher than the previous day's close, and forming a gap up.
In this scenario, the Bullish Kicker Pattern suggests a reversal of the downtrend. The significant price gap and the strong bullish candlestick indicate a sudden shift in market sentiment, with buyers taking control and potentially leading to a new uptrend.
Example 2: Bearish Kicker
Day 1: A green candlestick indicating an uptrend.
Day 2: A large red candlestick with a substantial body, opening lower than the previous day's close, and forming a gap down.
In this case, the Bearish Kicker Pattern suggests a reversal of the uptrend. The notable price gap and the strong bearish candlestick indicate a sudden shift in market sentiment, with sellers gaining dominance and potentially leading to a new downtrend.
Remember, these examples are simplified for illustrative purposes, and it is important to consider other technical indicators and perform thorough analysis before making trading decisions based solely on candlestick patterns.
The Impact of Body Size on Reversal Signals
The size of the body in Bullish and Bearish Kicker Candlestick Patterns plays a significant role in determining the strength of the reversal signals. A larger body indicates stronger conviction and momentum behind the reversal.
For the Bullish Kicker, a large green candlestick with a substantial body suggests a more significant shift in sentiment. It indicates a strong buying interest and a potential influx of buyers entering the market, leading to a potential trend reversal.
Similarly, for the Bearish Kicker, a large red candlestick with a substantial body signifies a stronger shift in sentiment towards selling. It suggests a higher level of selling pressure and a potential trend reversal to the downside.
The size of the body provides a visual representation of the magnitude of the price movement and reflects the intensity of the buying or selling pressure. Traders and analysts often consider larger-bodied candlesticks as more reliable indicators of trend reversals.
Confirmation and Risk Management
While Bullish and Bearish Kicker Candlestick Patterns can provide valuable insights into potential trend reversals, it is crucial to confirm these patterns with other technical indicators or analysis tools. Relying solely on candlestick patterns can be risky, as false signals or market noise may occur.
Traders often use additional indicators such as trendlines, support and resistance levels, moving averages, or oscillators to validate the signals provided by Kicker patterns. These tools can help confirm the reversal and provide a more comprehensive view of the market.
Moreover, risk management is essential when trading based on candlestick patterns or any other technical analysis method. Setting stop-loss orders, defining risk-reward ratios, and practicing proper position sizing are crucial to protect capital and manage potential losses.
It is also worth noting that no trading strategy or pattern guarantees success in the financial markets. Traders should combine candlestick analysis with fundamental analysis, market sentiment, and their own trading experience to make well-informed decisions.
Conclusion
Bullish and Bearish Kicker Candlestick Patterns are powerful reversal patterns that can provide insights into potential trend changes. These patterns indicate a sudden shift in market sentiment and can be used by traders to identify potential buying or selling opportunities.
Understanding the preceding trend, the role of gaps, the size of the candlestick bodies, and the importance of confirmation and risk management are essential when using Kicker patterns. It is recommended to combine these patterns with other technical indicators and analysis tools to increase the probability of successful trades.
Remember that trading involves risk, and it is always advisable to conduct thorough research, practice risk management, and continuously educate oneself to improve trading skills.
frequently asked questions (FAQs) about Bullish and Bearish Kicker Candlestick Patterns:
Q1: What are Bullish and Bearish Kicker Candlestick Patterns?
A1: Bullish Kicker Candlestick Pattern: It is a two-candle pattern where the first candle is a long red (bearish) candle, followed by a second candle that opens higher than the previous day's close and closes as a long green (bullish) candle.
Bearish Kicker Candlestick Pattern: It is also a two-candle pattern, but the first candle is a long green (bullish) candle, followed by a second candle that opens lower than the previous day's close and closes as a long red (bearish) candle.
Q2: What do Bullish and Bearish Kicker patterns indicate?
A2: Bullish Kicker indicates a strong reversal signal where sellers lose control, and buyers quickly take charge, potentially leading to a bullish trend.
Bearish Kicker indicates a strong reversal signal where buyers lose control, and sellers quickly take charge, potentially leading to a bearish trend.
Q3: How can I identify Bullish and Bearish Kicker Candlestick Patterns?
A3: Bullish Kicker: Look for a long red candle followed by a long green candle with a higher open.
Bearish Kicker: Look for a long green candle followed by a long red candle with a lower open.
Q4: What is the significance of the preceding trend?
A4: For Bullish Kicker, a preceding downtrend increases the significance of the pattern, suggesting a stronger reversal signal.
For Bearish Kicker, a preceding uptrend enhances the pattern's significance, indicating a stronger potential reversal.
Q5: What role do gaps play in Kicker patterns?
A5: Gaps between the first and second candles add to the pattern's strength. In Bullish Kicker, a gap up indicates a more robust reversal, while in Bearish Kicker, a gap down strengthens the reversal signal.
Q6: How does the size of the candlestick bodies impact the patterns?
A6: Larger-bodied candlesticks in both Bullish and Bearish Kickers signify stronger shifts in sentiment, indicating more significant potential trend reversals.
Q7: Should I rely solely on Kicker patterns for trading decisions?
A7: It is advisable to confirm Kicker patterns with other technical indicators or analysis tools to minimize the risk of false signals or market noise.
Q8: How can I manage risk when trading based on Kicker patterns?
A8: Set stop-loss orders, define risk-reward ratios, and practice proper position sizing to protect capital and manage potential losses.
About the Creator
Jeewan Goswami
Hi Iam Jeewan Goswami
Enjoyed the story? Support the Creator.
Subscribe for free to receive all their stories in your feed. You could also pledge your support or give them a one-off tip, letting them know you appreciate their work.
Keep reading
More stories from Jeewan Goswami and writers in Trader and other communities.
How to Stay Grounded in a Volatile Market: A Trader's Guide
As a trader, you are likely no stranger to the ups and downs of the market. Volatile conditions can be both enticing and intimidating, offering the potential for significant gains but also posing the risk of substantial losses. In this article, we will delve into the world of volatile markets and explore how you can navigate them while maintaining your financial security and trading success.
By Jeewan Goswami12 months ago in Trader
How cryptocurrency exchange script can help your business enter the crypto market?
Introduction Companies are always looking for new and creative ways to stay ahead in the fast-paced digital world of today. A game-changer for anyone wishing to enter the lucrative cryptocurrency market is the cryptocurrency exchange script. Launching your own cryptocurrency trading platform is made easy and affordable with the help of this ready-made software. A cryptocurrency exchange script's features, which include real-time trading, modern security, and customization, allow it to be customized to meet your unique business requirements. Utilizing this technology can provide you with a competitive edge, improve operational efficiency, and draw in a larger user base—regardless of your startup or established business.
By Nova Michelina day ago in Trader


Comments
There are no comments for this story
Be the first to respond and start the conversation.