
What Is A Flag And Pole Pattern?
Flag And Pole Pattern

Trading in financial markets requires various tools that support traders' investments. These tools can be anything from a simple chart to advanced softwares that help predict market changes.
Today's article will analyse the best chart pattern, flag and pole. A specific chart formation identifies the continuation of the previous market trend. To learn about the pattern in detail, let's dive in.
Flag and Pole Pattern
Traders, when analysing the market, have to look into many aspects. Flag and pole is one such chat pattern that guides traders to identify the market characteristics. Flag individually is a price pattern and pole as well.
The flag and pole pattern work in a short time frame and help understand the market movements.
The pattern forms on the chart and helps to identify the continuation of the previous trend. It takes from a point when the price moves against the same market trend.
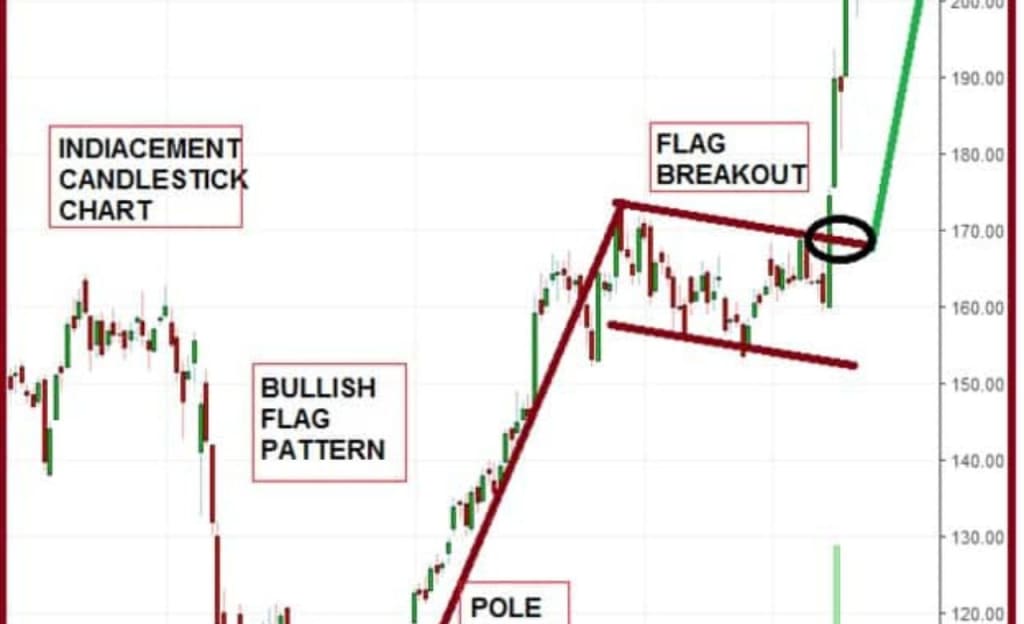
In the flag and pole pattern, the price makes a sharp movement in a direction. This reminds traders of a pole or the flagpole.
Also Read: Giottus Review 2022
Once the pattern forms on the chart, it moves sideways. Then, it attempts to change the trend by moving upwards. However, it has no or little momentum.
What do Flag and Pole patterns describe?
A flag and pole pattern in technical analysis signifies various aspects to traders. The pattern says that the buyers continuously and aggressively try to change the primary trend.
They bring it down by creating more market demand for the asset. However, the asset moves in range due to the selling pressure. With the help of patterns, traders try to identify the potential breakdowns in the assets.
When the price breaks, the lower range of the flag closes below it. So, traders can expect a continuation of the primary bearish trend in the market.
How does the Flag and Pole pattern work?
The flag and pole pattern refers to the tight consolidation in the price actions. It shows the counter-trend move that follows after the sharp directional movement in the price of assets.
In the pattern, there are five to twenty price bars.
The flag pattern can be upward or downward trending. The upward trending refers to the bullish flag, while the downward trend is the bearish flag. In addition, the bottom of the flag should not exceed the midpoint of the flagpole that preceded it.
Flag and pole pattern has five characteristics that define their working:
- Preceding trend
- Consolidation channel
- Volume pattern
- Breakout
Confirmation of price moves in the same direction as the breakout
When the flag pattern forms on the chart, the bearish and bullish patterns have similar structures. However, they differ in the trend direction with some differences in volume pattern.
In the bullish pattern, the volume increases in the preceding trend and declines in consolidation. In contrast, the bearish pattern volume increases first and then holds the level as they tend to increase as time progresses.
Also, the pattern is characterised by parallel markers over the consolidation area. When the lines converge, patterns are called a wedge or pennant pattern. These patterns are reliable continuation patterns.
Traders use the pattern to enter an existing trend setup and will continue.
How do trade Flag and Pole patterns?
In trading, the flag and pole pattern traders must consider three essential factors. These factors make trading easy with simple establishing of the strategy. The factors are:
Entry
The flag and pole are a continuation pattern of the current market trend. But traders should wait for an initial breakout to avoid false market signals. Traders can expect to enter a flag when the price breaks and closes above the upper parallel trend line in a long position.
For bearish traders should enter a short position a day after the price closes below the lower parallel trend line.
Stop-Loss
Traders use stop-loss in flag patterns to trade. Therefore, they enter the opposite side of the stop-loss point.
Profit Target
Traders use the pattern to set their profit targets. They use the difference measured in price between the flag pattern's parallel trend lines.
Conclusion
Flag and pole pattern is of great use for online traders. They can use it to enter the market, set their profit target and use the stop-loss to understand the entry point—a beneficial chart pattern.
The article gives a short yet significant introduction to the pattern and how traders can use it for effortless trading.
About the Creator
keith cooper
https://trendingbrokers.com/
Enjoyed the story? Support the Creator.
Subscribe for free to receive all their stories in your feed. You could also pledge your support or give them a one-off tip, letting them know you appreciate their work.
Keep reading
More stories from keith cooper and writers in Education and other communities.
Best Cryptocurrencies to invest in 2022: Rising Very Quickly
Do you want to diversify your portfolio by making investments other than a typical basket of stocks, bonds, and shares? Investing in cryptocurrency is considered to be a smart move as the industry is growing very quickly over the past few years. Despite valuing goes ups and downs in the market; many people prefer to invest in digital assets as it is a long and stable form of currency.
By keith cooper2 years ago in Education
Generative AI and Business Strategy: Integrating New Tech
In the fast-paced world of technology, businesses are always gluttonous with avant-garde equipment to break through and thrive. Abundant AI, a groundbreaking advance in bogus intelligence, stands out as a transformative force in about-face business landscapes. As we burrow into the affiliation of abundant AI into cardinal planning, it's important to accept how this technology can be leveraged to enhance decision-making, accumulate operations, and personalize chump experiences.
By Milan Milicabout 24 hours ago in Education
The SWOT Analysis of the Vocational Education Market
The vocational education market has been witnessing significant growth globally. According to recent data, the market size was valued at USD 683.4 billion in 2023 and is projected to reach USD 1585.23 billion by 2031, growing at a CAGR of 9.8%. This analysis delves into the strengths, weaknesses, opportunities, and threats (SWOT) of the vocational education market, with a focus on providing a comprehensive understanding of its current landscape.
By Naman Rohilla3 days ago in Education


Comments (1)
great artilce, i learned a lot from this article.