
Key mobile app performance metrics to track
Mobile App Performance Metrics

Mobile apps have been around since Nokia Symbian operating system two decades ago. But they were rudimentary. After all, one can’t do much with a phone keyboard.
The coming of touchscreen-enabled smart devices and 3G (followed by 4G) made mobile apps into big business.
How big?
- There are almost 3.3 million apps available on the Google Play store
- Mobile app revenue hit $133 billion in 2021
A tiny crumb of that huge pie means millions of dollars. But to get there, your app has to perform well.
How do you know if it is meeting all the benchmarks and performing satisfactorily?
We share the essential mobile app performance metrics to track in 2022.

Top Mobile App Performance Metrics For App Success
- Retention Rate
This remains by far the most important mobile app KPIs metrics to measure. If the users are not using the app anymore, they can hardly generate revenue or contribute to the success of the app.
The retention rate is the number of users who return after initial use.
For increasing retention rate you must know more about customer behavior tool online on your app. Session recording by Webmaxy is an ideal way to get a deep understanding of customer activity on the app.
To find it, divide the number of monthly active users by the number of monthly app installs (and multiply by 100 to express as a percent).
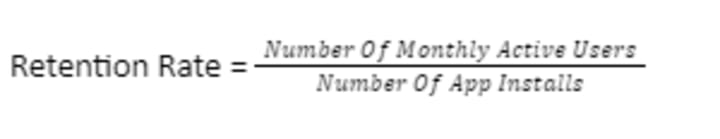
Number Of App Installs
2. Churn Rate
It provides a glimpse into the other side of the data. Those who are not retained are a part of the churn rate.
Hence Churn Rate = 100 – Retention Rate
Let’s clarify with an example.
X launched a dating app a year ago. There are 120,000 monthly installs. Last month 75,000 returned to the app after opening it.
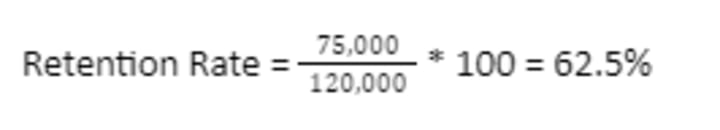
Churn Rate = 100 – 62.5 = 37.5%
Little less than two-thirds of the installs translate to active users.
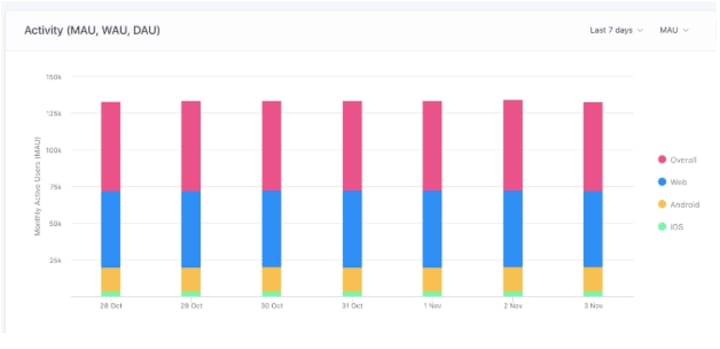
3. Active Users
This is an essential mobile app KPIs metrics to track to find how many active users are there.
An app might have a million installs but very few active users. Perhaps most everyone who installed it found the UI to be too difficult and most features locked behind a paywall.
Active users are calculated on a Daily or Monthly basis.
It gives you an idea about how engaged your users are with the app and with what frequency they require your app.
Of course, you would aim for a high retention rate, low churn rate, and high active users.
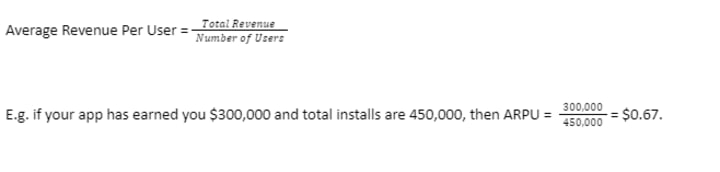
4. Average Revenue Per User
Apps are rarely free. Tracking how much you are earning per user is an essential mobile app performance metrics.
WhatsApp is free till now. But very few apps have zero revenue (note that WhatsApp for Business is a paid service).
Your income source might be from sales in the case of an online store or from unlocking premium features.
Another source of income that many resorts to is Google Display Network and similar monetization through ads display.
It is easy to calculate. Simply divide the entire revenue generated by your app till date by the total number of users.
Over time (say comparing quarters or years) it should trend upward.
5. Cost Per Acquisition
How much are you spending to acquire users? You need to know this crucial mobile app performance metrics.
The latest data from Statista shows it costs $1.75 to acquire a user (install), but $3.52 to get them to register and $75.22 to get them to make a purchase.
These data points are the global average and it would cost significantly more in the USA. There are 1.4 billion users in India and 276 million in Indonesia and the cost of acquisition in these countries must be a lot less.
To understand this mobile app performance metrics the Cost Per Acquisition, divide the total marketing spend by the total number of users. If you want to measure the cost of making an in-app purchase happen, divide it by the conversion you are focusing on.

6. Customer Lifetime Value
LTV is closely connected to Cost Per Acquisition.
Unless LTV is high, the app would not be profitable because you must be making a large amount of marketing spend that is not being recovered.
LTV is somewhat a guesswork and it is hard to use concrete numbers till the app is matured and trends can be easily observed. Analyzing user behavior is possible when you have a plethora of historical data to refer to.
LTV calculation needs data about how many times a user makes a purchase and how long they maintain the relationship.
To understand let’s look at an example:
It costs $60 to acquire a new customer, get them to sign up, and make a purchase.
Previous data shows the customer would make six purchases over the next two years. Each transaction would be worth an average of $100.
That is $600 in sales. Then every sale must pay at least $10 towards marketing (since it cost $60 to get the customer to download, install and order).
Out of the remaining $90, the cost of app development, cost of app maintenance (server cost), and cost of goods, if any, have to be recovered. The remainder is profit.
7. Return On Investment
ROI is important mobile app performance metrics because you have to know if your app is earning sufficient profit or whether it would have been better to spend the resources elsewhere.
ROI is calculated by dividing net profit by total investment. To change it to percent multiply by 100.
Net profit is calculated by subtracting all costs from the gross sales figure.
Long-term expenditures like initial ad spend might be apportioned over several years. The same is true for the cost of office space (if purchased), the cost of a laptop, and other gear.

Is industry-wide benchmarking possible?
Not really.
A shopping site like Amazon or a social media site like TikTok would always have a top retention rate and a gigantic number of active users.
One can hardly compare it to an app for meditation in terms of mobile app performance metrics. Analyzing user behavior directly is difficult since it is almost always comparing apples to oranges. That is why you need an app that can reveal useful mobile key performance indicators(KPIs). Webmaxy offers A/B testing, session replay and analytics, and heat maps in an easy to understand manner.
Even among apps in the same niche, it is hard to compare. A newbie shopping app where you sell junk jewelry can hardly compare with Amazon and Walmart.
Every app niche has a wildly different revenue model.
Amazon, for example, earns from:
Selling own private label brands—Solimo, Amazon basics, and Mama Bear
Allowing other sellers to use it as a marketplace and receiving a commission
Prime Memberships
Kindle sales
(We have not included outside the app offerings such as Alexa, Amazon Web Services, Amazon warehouses rental, etc.).
Best Buy and Walmart have very different revenue models from Amazon. the question of benchmarking anything except the broadest possible key performance indicators (ROI, number of installs etc) is not even possible.
Of course, a user would spend more time on a social media app and less on an investment app.
If you want to know more about the user journey use a free service to show analytics. Firebase by Google Analytics is the best when it comes to Android. Apple has its own similar service Apple App Analytics.
The success lies in interpreting key performance indicators to your satisfaction and pursuing those that matter diligently.
About the Creator
Adam Wilson
Adam Wilson comes with an experience of 12+ years in the IT industry. As a Customer Success Manager, he has been researching and trying to understand the customers’ behavior in different scenarios.
Keep reading
More stories from Adam Wilson and writers in Education and other communities.
Innovative Solutions: How IIT Roorkee is Shaping the Future of Supply Chain Management
In today's rapidly evolving business landscape, supply chain management plays a pivotal role in driving efficiency, agility, and competitiveness. As organizations seek to optimize their supply chain operations and adapt to changing market dynamics, innovative solutions are essential for navigating complex challenges and seizing new opportunities. In this article, we'll explore how IIT Roorkee is at the forefront of shaping the future of supply chain management through its innovative initiatives and collaborations. Additionally, we'll delve into Imarticus Learning's Supply Chain Management course with IITR and how it contributes to preparing professionals for the dynamic field of supply chain management.
By Imarticus Learninga day ago in Education
Beyond Conventional Wheelchairs: Why Electric Wheelchairs Are a Game-Changer in the UAE
In the realm of mobility aids, electric wheelchairs have emerged as a transformative solution, particularly in the bustling landscape of the United Arab Emirates. As the UAE continually strives to enhance accessibility and inclusivity, the advent of electric wheelchairs represents a significant stride towards achieving these goals. In this article, we delve into the reasons why electric wheelchairs have become a game-changer in the UAE, revolutionizing the way individuals with mobility impairments navigate their daily lives.
By Freya Alberta day ago in Education


Comments
There are no comments for this story
Be the first to respond and start the conversation.