
BLACK AMERICANS ON AN “ENDANGERED LIST”?
POLICE-KILLING DATA RAISES A NATIONAL ALARM

BLACK AMERICANS ON AN “ENDANGERED LIST”? POLICE-KILLING DATA RAISES A NATIONAL ALARM
More than 15,000 deaths recorded since 2013 reveal persistent racial disparities, wide differences between states and police departments, and continuing questions about accountability.
By Leavie Scott | Special Report | October 2026
A massive archive documenting fatal encounters with law enforcement is raising difficult questions about policing, race, public safety and accountability across the United States.
The Police Killings Data Archive, maintained by Police Data, says its records contain detailed information on more than 15,000 cases of people killed by police nationwide between 2013 and 2026. The organization describes the archive as the culmination of more than a decade of research and data collection led by founder Samuel Sinyangwe. [Police Kil...ta Archive]
The numbers are alarming on their own. But the charts presented with the archive attempt to tell a much larger story: who is being killed, where the killings occur, how outcomes differ by race, what happens when people flee police, how police departments differ from one another, and what happens after a person dies.
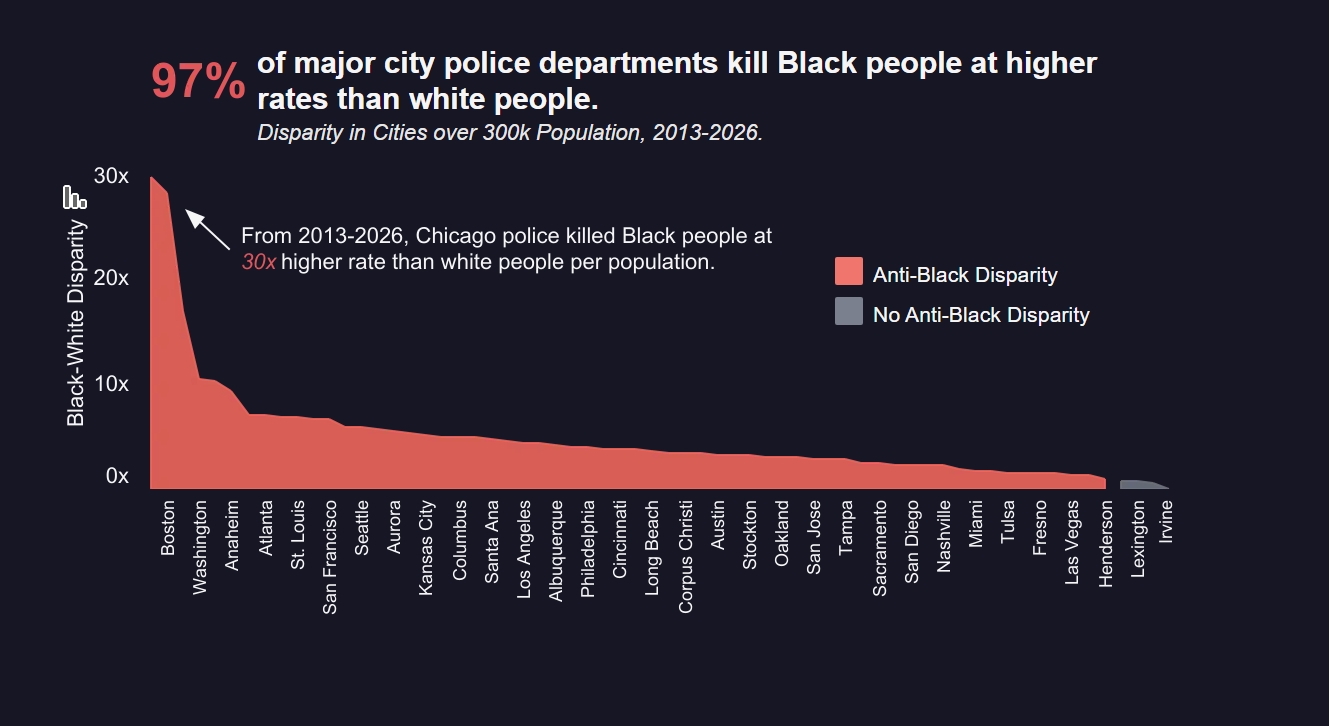
One of the most striking themes is the racial disparity involving Black Americans.
That disparity deserves serious attention. But the evidence must also be described precisely. The archive does not establish that Black Americans have literally been designated an endangered species by the federal government. “Endangered list” is therefore used here as a provocative metaphor for the scale of the disparity reflected in the data, rather than as a statement of official government policy.
GRAPH 1: MORE THAN 15,000 PEOPLE KILLED
The first major chart tracks cumulative police killings from 2013 forward.
According to the Police Killings Data Archive, police have killed more than 15,000 people since 2013. [Police Kil...ta Archive]
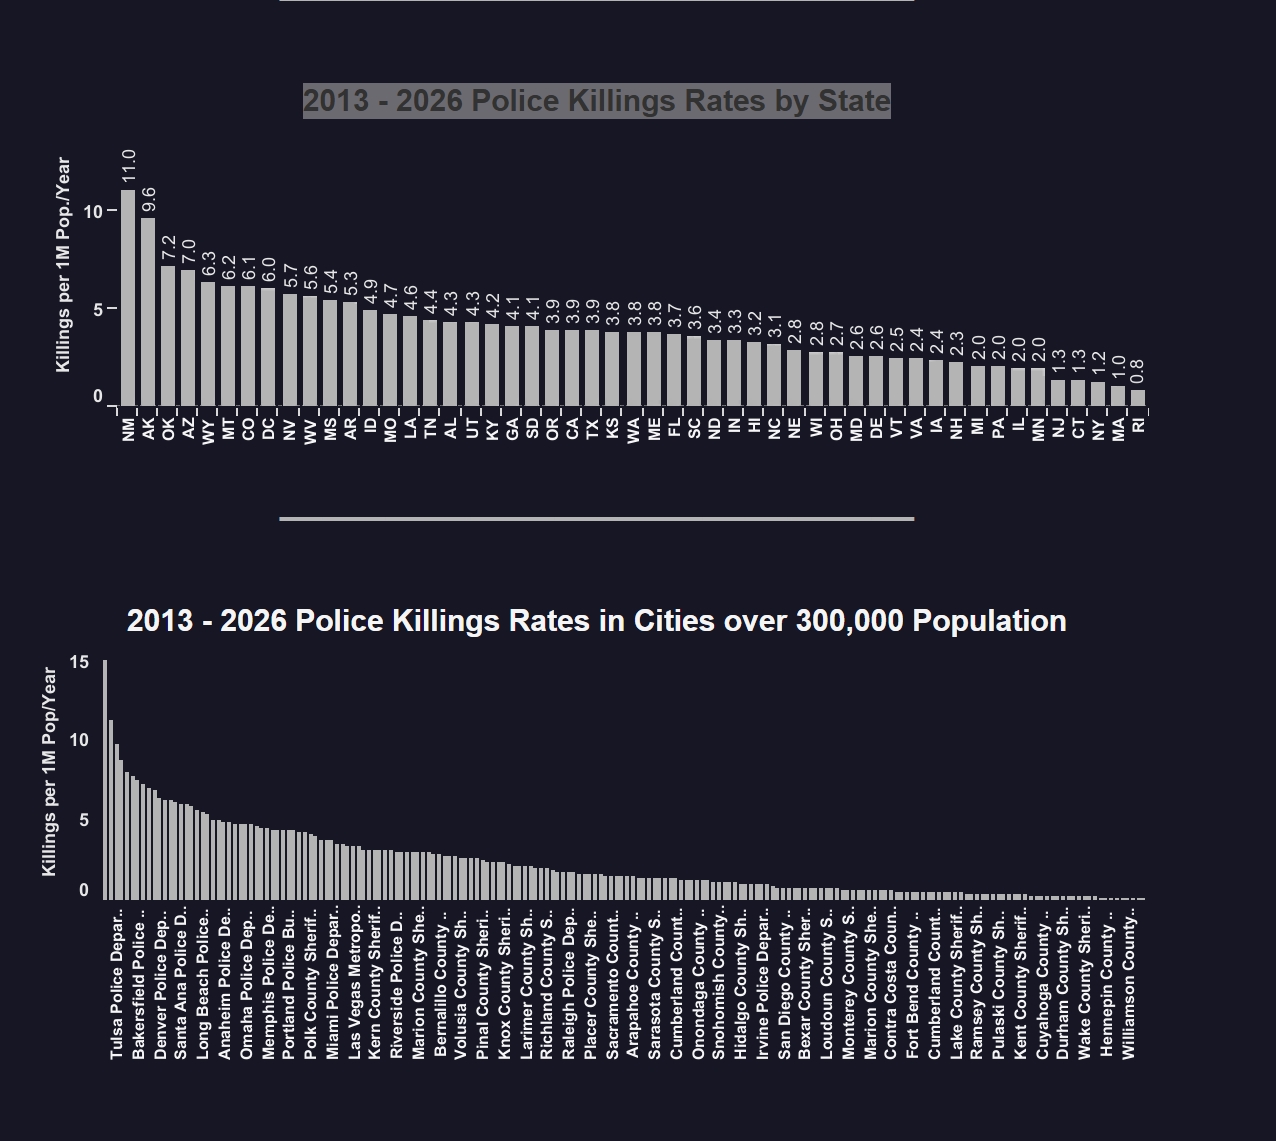
Rather than depicting a problem disappearing with time, the cumulative lines continue climbing. Every additional year adds deaths to the national total.
That is important because public attention to policing often rises dramatically after a nationally publicized death and then subsides. A long-term database paints a different picture. Fatal police encounters are not isolated to a single year, presidential administration, police chief or city.
They represent an issue stretching across the country over more than a decade.
GRAPH 2: THE STATE WHERE A PERSON LIVES MATTERS
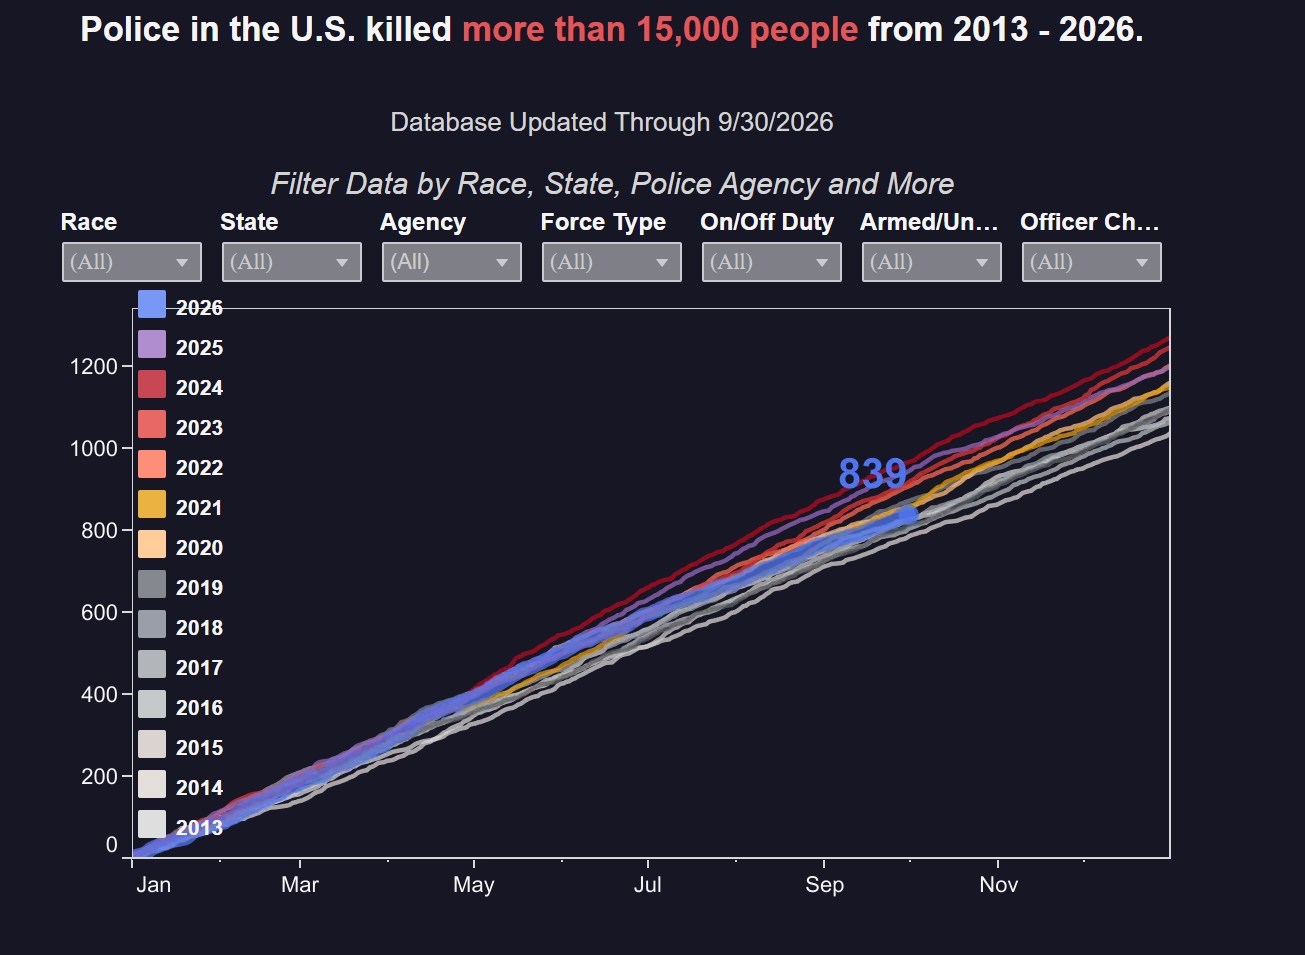
A second chart divides police killings by state.
The graph makes clear that fatal police encounters are not distributed evenly across America. Some states have substantially higher rates than others.
That difference raises an important policy question: Why should the likelihood of being killed during a police encounter vary so considerably depending on where an American lives?
Population, violent-crime rates, gun ownership, geography, police practices, state law, and training requirements may all contribute. A chart showing different state rates does not, on its own, prove which factor is responsible.
But the differences make comparisons possible.
If states facing comparable public-safety challenges produce dramatically different outcomes, legislators and police executives should examine which policies may be contributing to better or worse results.
GRAPH 3: RACIAL DISPARITIES STAND OUT
Then comes one of the archive's most important comparisons.
The graphic states that Black people are about three times as likely to be killed by police as White people, while another racial group shown in the archive has a rate around 1.2 times the White rate.
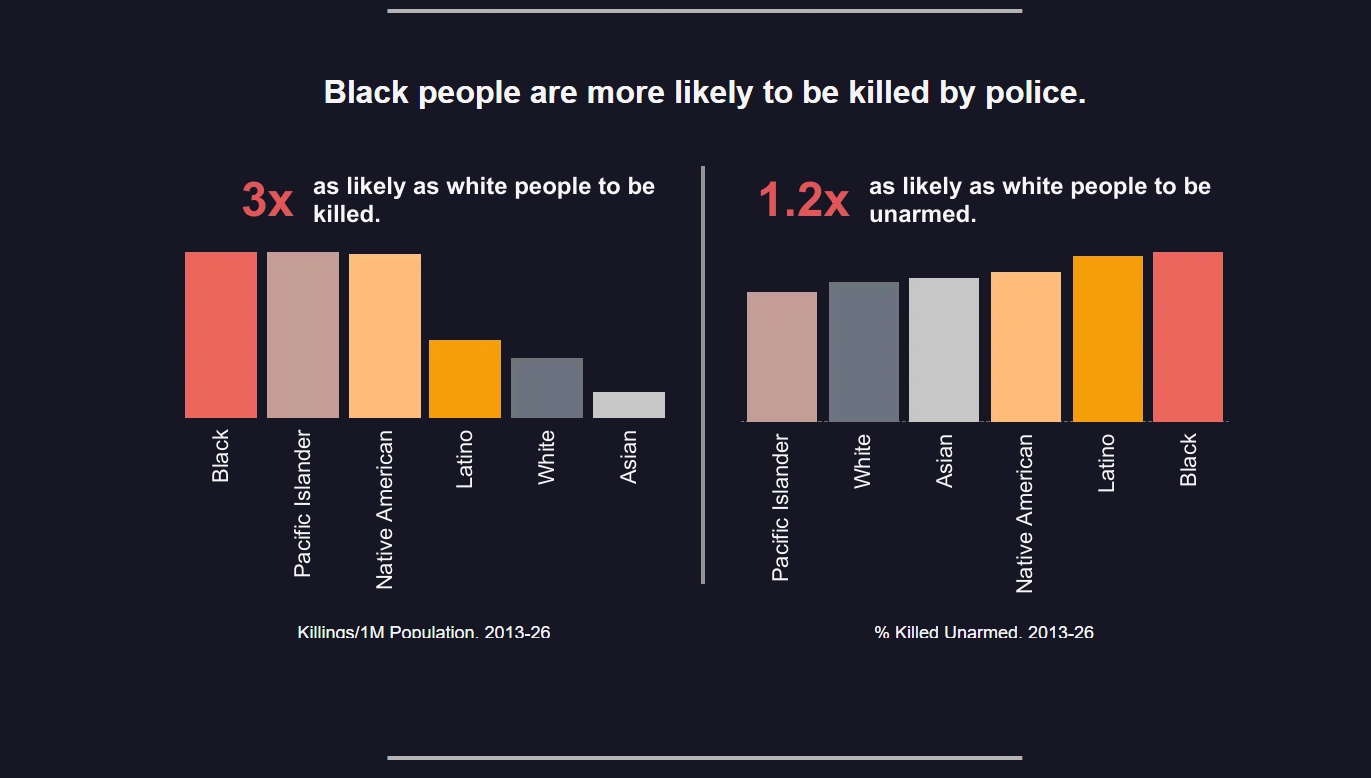
That is the statistic behind the provocative question in this article's headline.
A racial disparity is not in itself evidence that every individual shooting was racially motivated. Individual police killings involve different circumstances and must be examined on their own evidence.
But a disparity that appears across thousands of cases deserves examination rather than dismissal.
The question becomes bigger than whether a particular officer harbored prejudice. Policymakers must examine deployment patterns, traffic stops, searches, warrants, neighborhood enforcement, dispatch practices, use-of-force policies, and whether communities receive different types of police contact.
This is where statistics can expose questions that individual incident reports cannot.
GRAPH 4: UNARMED BLACK PEOPLE AND POLICE VIOLENCE
Another archive graphic focuses specifically on unarmed victims and indicates a major racial disparity involving Black Americans.
This category deserves particularly careful analysis.
“Unarmed” does not automatically establish that an officer's actions were unlawful. Police encounters can involve vehicles, physical struggles, and circumstances presenting dangers not captured simply by asking whether somebody possessed a weapon.
At the same time, an elevated rate of unarmed people being killed within any racial group creates a compelling reason for stronger scrutiny.
Departments should be able to explain when deadly force is used, what threat officers perceived, what de-escalation efforts were attempted, whether less-lethal alternatives existed, and whether department policy was followed.
Those are accountability questions, not anti-police questions.
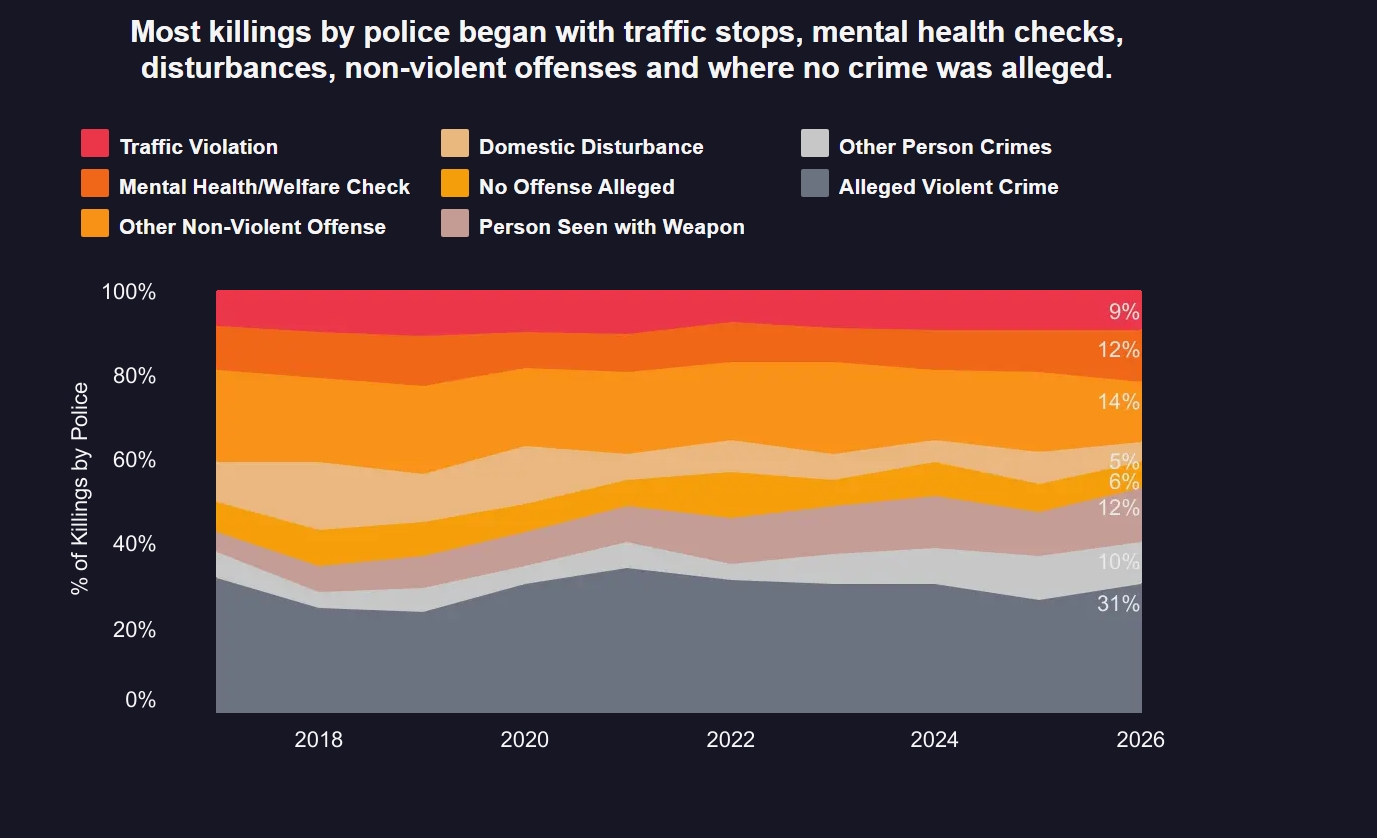
GRAPH 5: MOST KILLINGS BEGIN WITH SOMETHING OTHER THAN A VIOLENT CRIME
Another chart breaks down what preceded fatal police encounters.
The archive graphic indicates that many cases began with circumstances other than an alleged violent crime. The displayed categories include non-violent offenses, traffic stops, situations in which no crime was alleged, mental-health or welfare checks, and other circumstances, alongside violent-crime allegations.
This distinction matters.
The public may imagine a fatal police shooting primarily as the conclusion of a confrontation with somebody committing a serious violent felony.
The data presents a more complicated reality.
Some encounters that end in death originate with far less serious circumstances.
Every escalation therefore deserves scrutiny. Police agencies need to ask not only whether the final use of force was justified, but also whether earlier decisions unnecessarily moved an encounter toward violence.
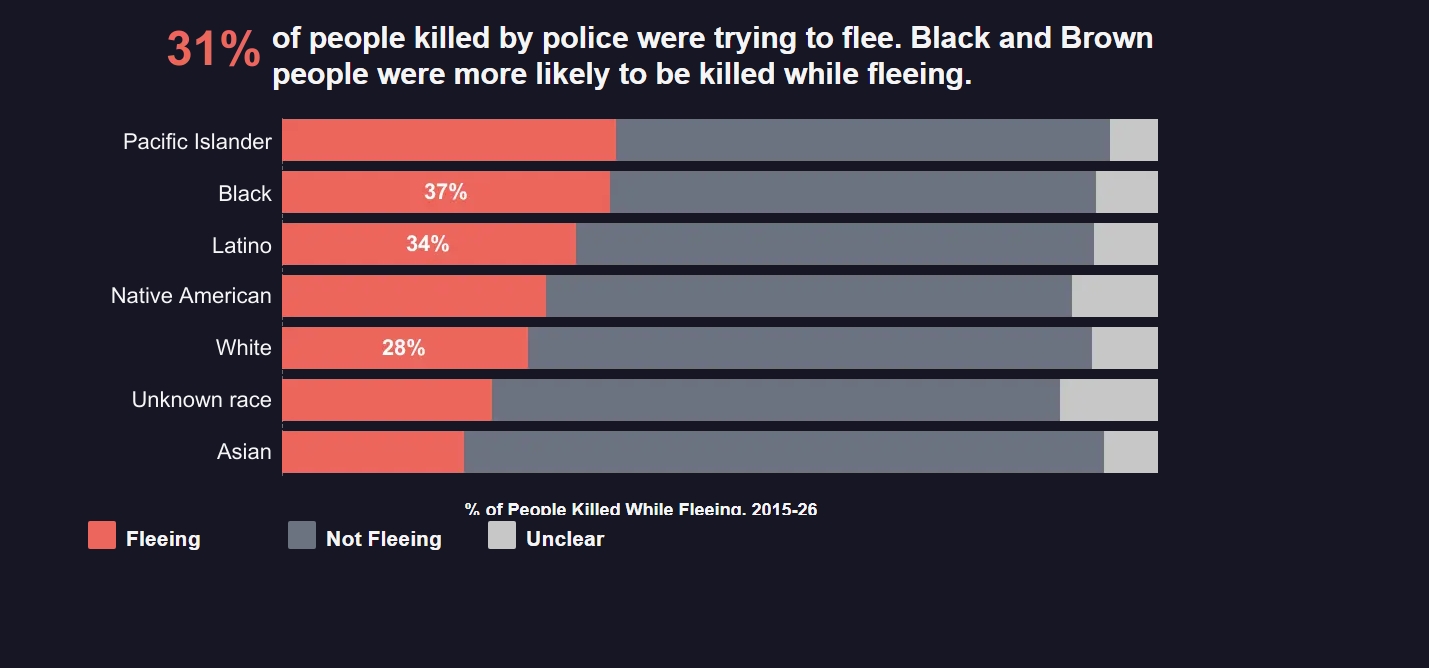
GRAPH 6: FLEEING SHOULD NOT AUTOMATICALLY BECOME A DEATH SENTENCE
One graph in the archive examines people who were fleeing when killed by police and displays substantial differences among racial groups.
Running from law enforcement can certainly present serious risks. A fleeing suspect may pose a threat to officers or members of the public.
But flight by itself should not erase the legal standards governing deadly force.
The central question remains whether an officer reasonably faced or sought to prevent a sufficiently serious threat under the circumstances.
That distinction is critical because fear, confusion, outstanding warrants, mental illness, and poor decision-making can all cause people to flee.
None automatically answers whether deadly force is justified.
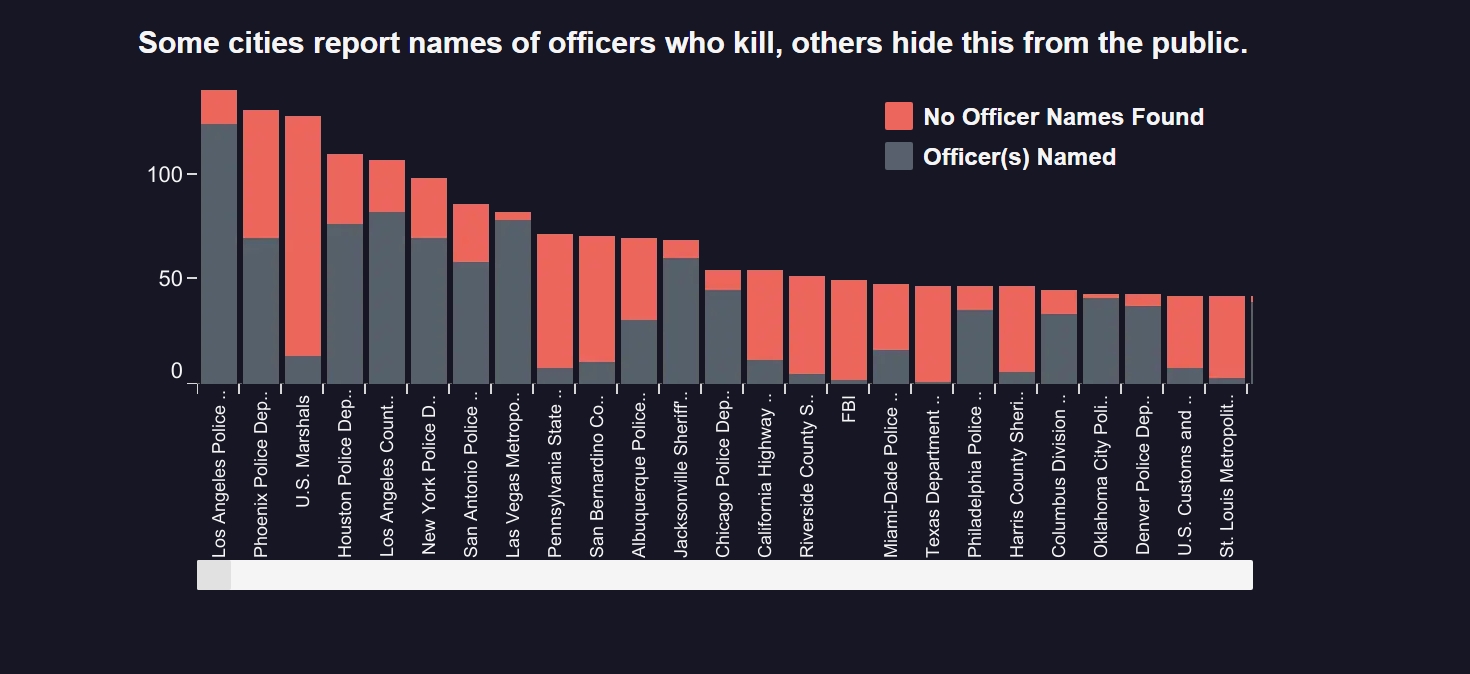
GRAPH 7: POLICE DEPARTMENTS PRODUCE DIFFERENT RESULTS
Another important visualization compares police departments.
Some departments have markedly different rates of fatal encounters than others.
That is one of the archive's most consequential policy questions because police practices are not identical everywhere.
Recruitment differs.
Training differs.
Supervision differs.
Pursuit policies differ.
De-escalation requirements differ.
Disciplinary systems differ.
And accountability differs.
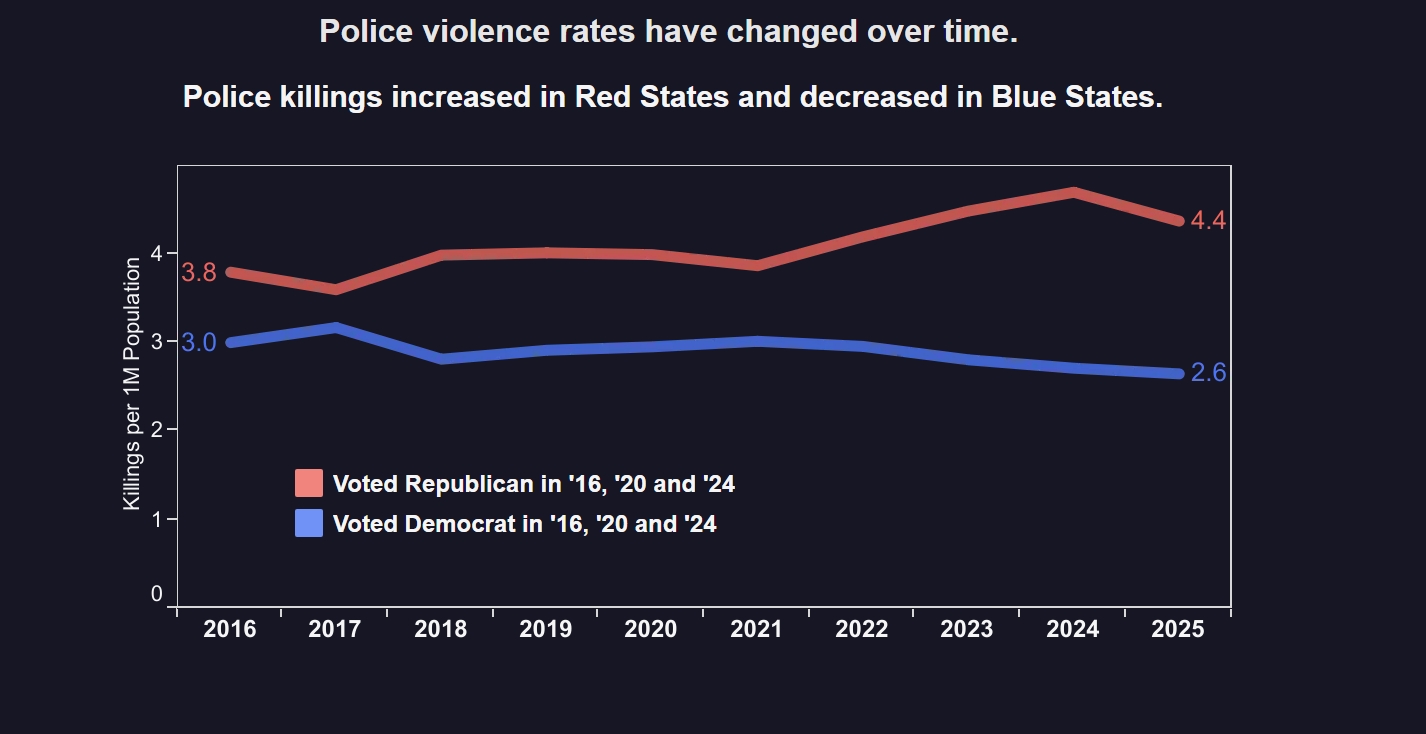
If one department can police a comparably sized population while producing fewer fatal encounters, the practices of that department deserve study.
Rather than assuming every department must operate the same way, policymakers should investigate measurable differences.
GRAPH 8: URBAN, SUBURBAN AND RURAL AMERICA
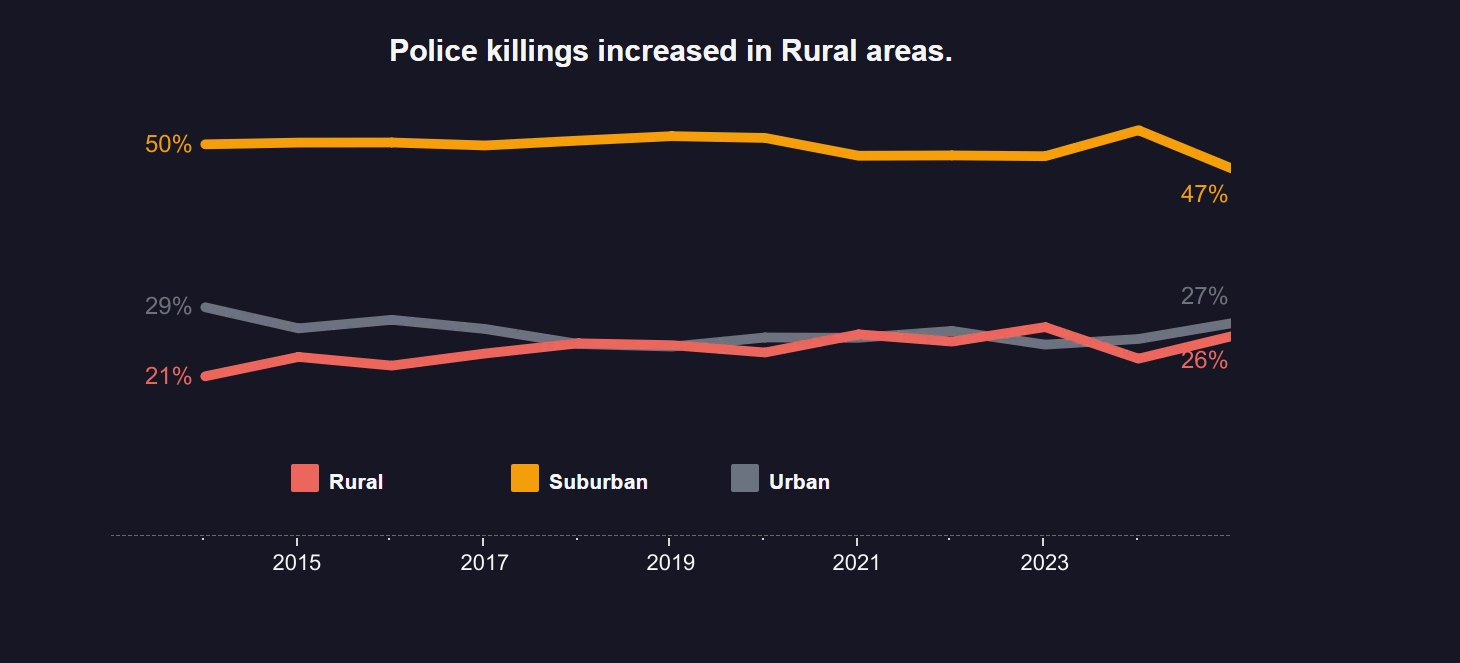
The archive also shows that police violence is not exclusively a large-city issue.
Its charts divide incidents across urban, suburban, and rural areas, demonstrating that police killings occur across different American communities.
That matters because the national conversation often centers on major metropolitan police departments.
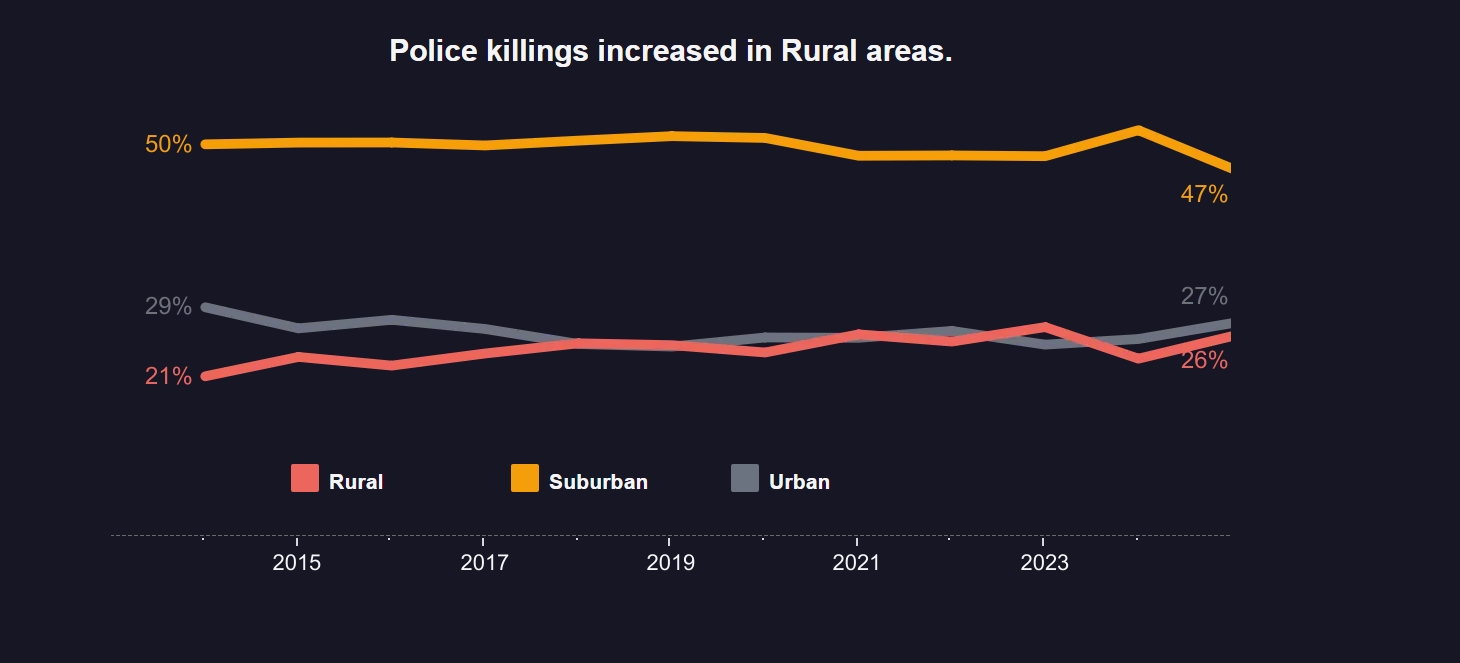
Rural sheriff's offices and smaller departments may receive far less media attention, despite possessing the same extraordinary governmental authority to detain people and, under legally defined circumstances, use deadly force.
Accountability should not depend on the size of a city's television market.
GRAPH 9: POLICE KILLINGS VERSUS COMMUNITY VIOLENCE
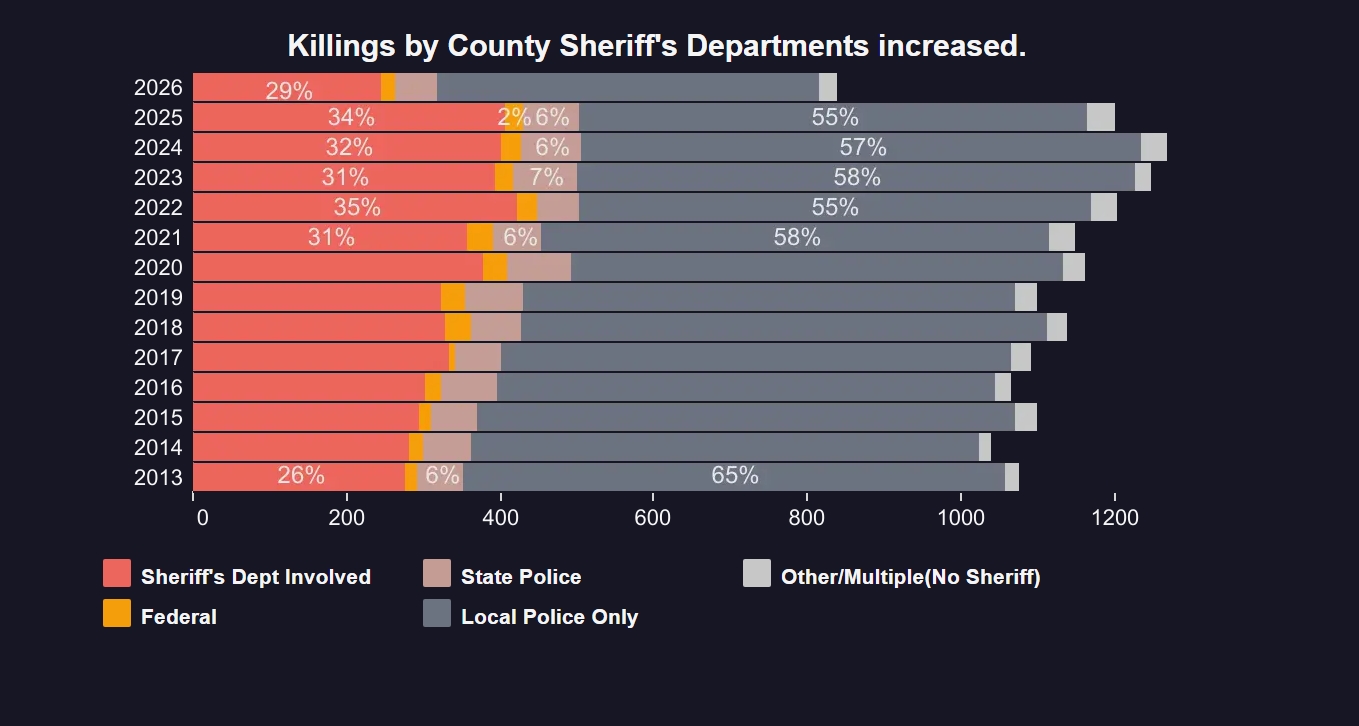
One of the archive's graphics compares changes in killings by police with murders reported by county sheriff's departments.
The significance of such a comparison is not that the two measures are identical. They are not.
Instead, the comparison raises questions about the common assumption that police killings simply rise and fall in direct proportion to criminal violence.
Researchers should test that proposition carefully rather than treating it as self-evident.
Crime levels matter when evaluating police activity, but they do not eliminate the need to examine agency policies, officer decisions, and differences between jurisdictions.
GRAPH 10: ACCOUNTABILITY AFTER A POLICE KILLING
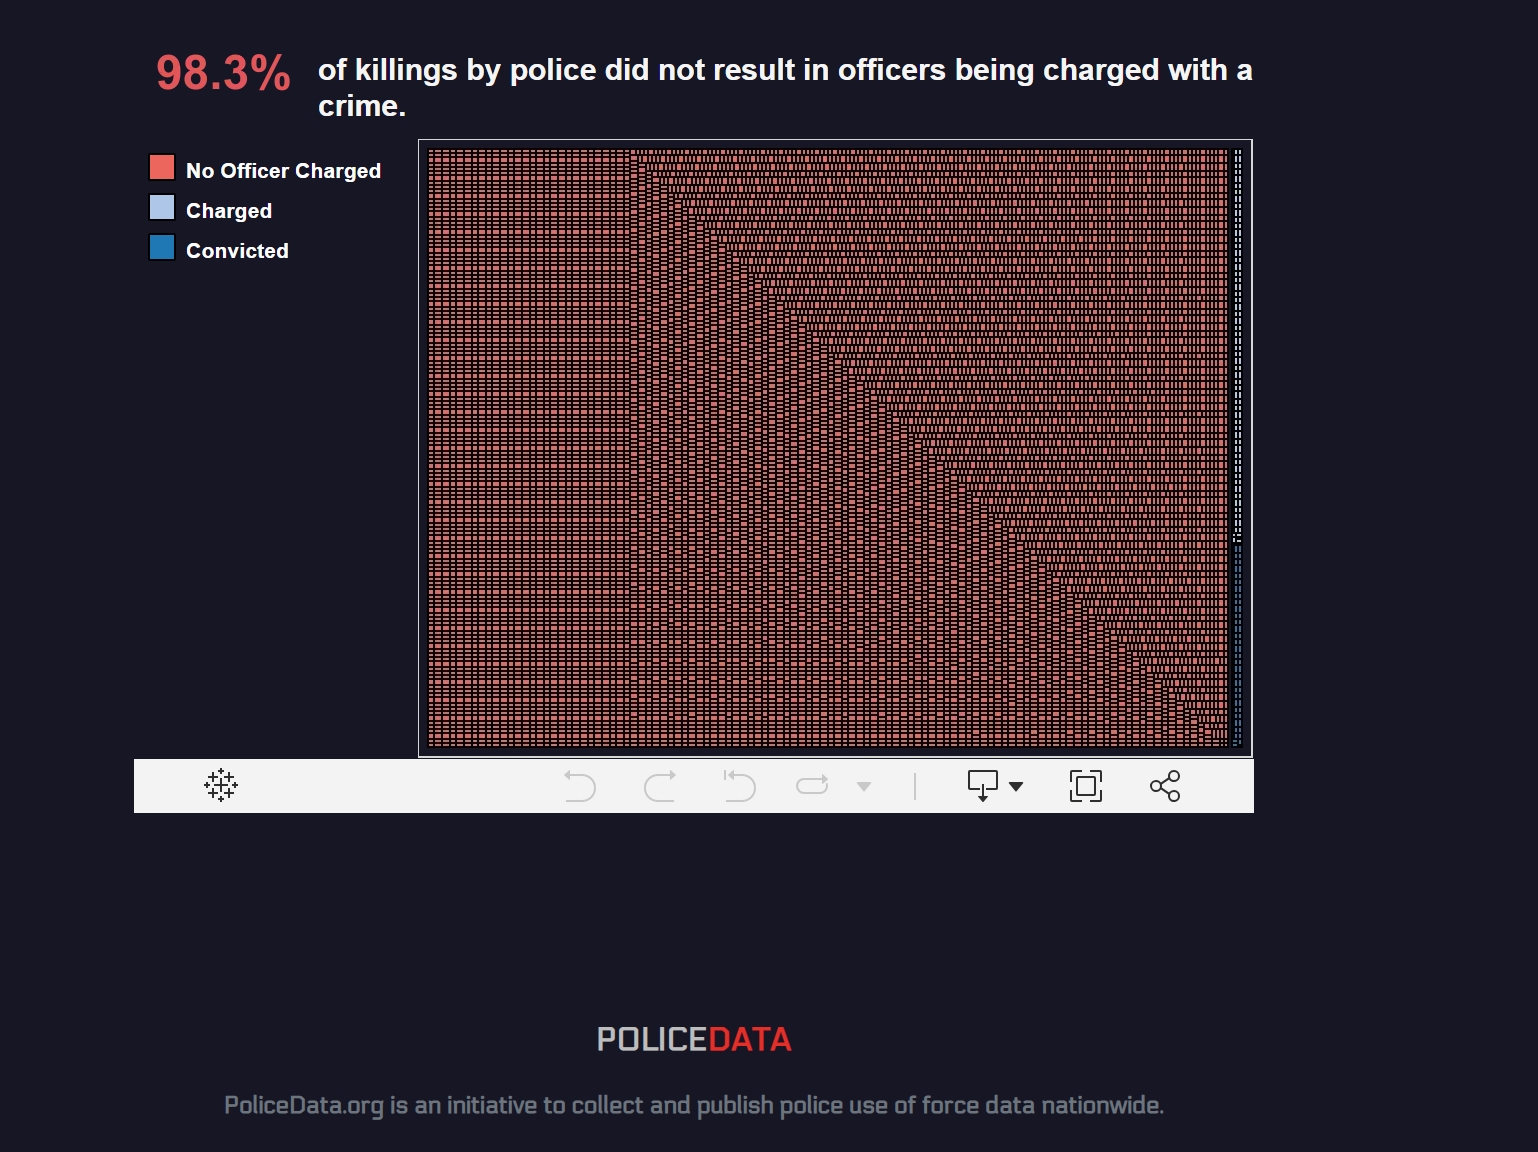
Perhaps the most troubling visualization appears near the bottom of the archive.
The graphic reports that 98.3% of killings by police did not result in officers being charged with a crime during the period represented.
That statistic requires careful interpretation.
A lack of criminal charges does not prove that 98.3% of killings were wrongful and went unpunished. Police officers are legally allowed to use deadly force under certain circumstances, and prosecutors must meet demanding evidentiary and legal standards before bringing criminal charges.
But the statistic inevitably raises another question:
Who holds the government accountable when government agents use deadly force?
Oversight does not have to mean criminal prosecution.
Accountability can include independent investigations, body-camera review, administrative discipline, civil litigation, transparent reporting, civilian oversight, policy reform, decertification where appropriate, and public disclosure of investigative findings.
The point is not to presume guilt.
The point is to demand credible review.
THIS IS BIGGER THAN ONE POLITICAL PARTY
Police reform should not be reduced to a contest between supporting police officers and supporting Black communities.
Americans can support law enforcement while simultaneously insisting that law enforcement operate under rigorous standards.
Officers also benefit from better training, clearer policies, effective supervision, and systems that distinguish legitimate policing from misconduct.
Good officers should not carry the burden created by preventable misconduct elsewhere.
Neither should citizens be forced to accept unnecessary deaths as the unavoidable price of public safety.
The Police Killings Data Archive is now preserved as a permanent archive as Police Data expands its research beyond fatalities to other forms of police use of force. The organization says the historical material is being retained as a resource for organizers, journalists and academics. [Police Kil...ta Archive]
Police Data's newer state reporting demonstrates the broader direction of that work. For example, its California reporting now includes information covering police shootings, Taser deployments and baton or impact-weapon uses, rather than fatalities alone. [policedata.org]
THE NATIONAL QUESTION
The numbers leave America with questions that cannot be answered by slogans.
Why are Black Americans represented so disproportionately in fatal police encounters?
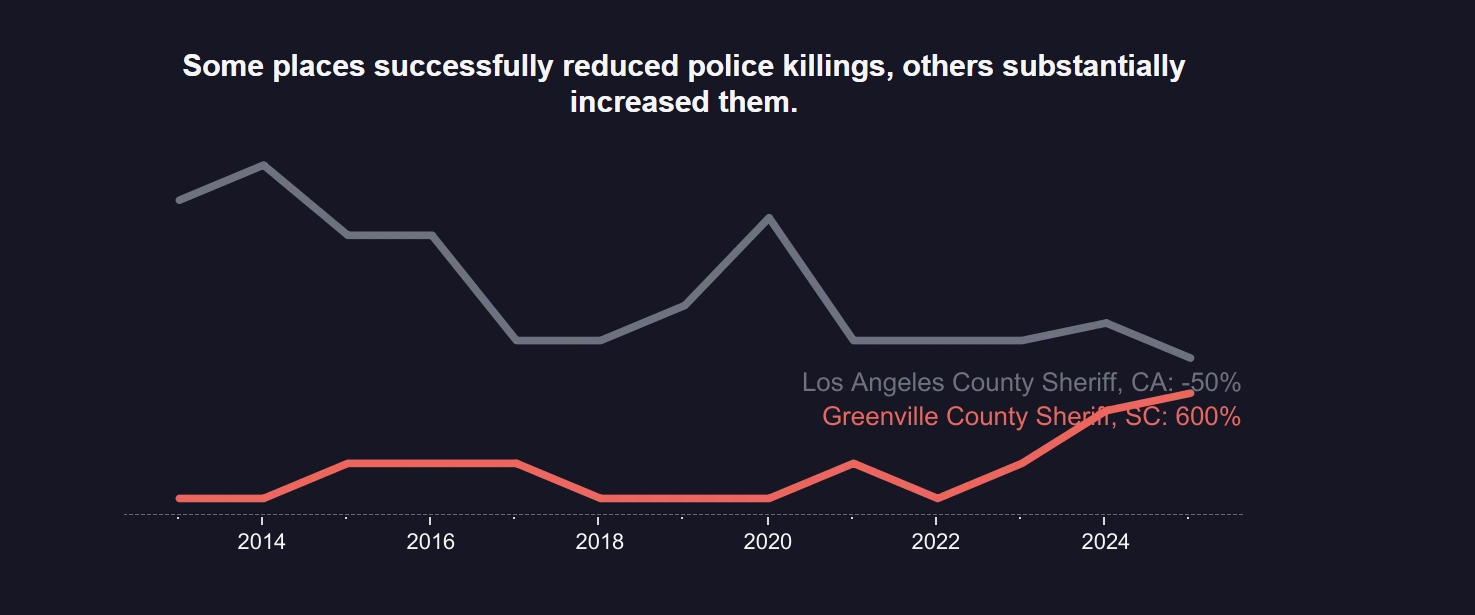
Why do states and police departments demonstrate different outcomes?
Why do some fatal encounters begin with allegations that are not violent crimes?
Which departments have successfully reduced deaths without sacrificing public safety?
And what forms of independent accountability produce the best results for civilians and police officers alike?
The archive cannot answer every one of those questions by itself.
What the archive can do is make the questions harder to ignore.
More than 15,000 recorded lives since 2013 are not merely points on a graph. [Police Kil...ta Archive]
Behind every point was a human being, an encounter with governmental authority and a set of circumstances that deserves to be understood.
For Black Americans, the racial disparities displayed in the archive demand particular attention.
Calling Black people an officially “endangered species” would go beyond what the evidence demonstrates. But asking whether persistent disparities constitute a national civil-rights and public-safety emergency is a legitimate question arising from the data.
The next step should not be another argument about whether Americans must choose between safe communities and accountable policing.
The country should demand both.
Public safety and civil rights are not competing American values. They are supposed to be part of the same promise.
Source note
This story is based primarily on the Police Killings Data Archive currently displayed by Police Data. The organization describes the material as an archive of its original fatal-police-violence database and says the collection covers more than 15,000 cases nationwide from 2013 through 2026. [Police Kil...ta Archive]
About the Creator
Press Release
I was born and raised in Chicago but lived all over the Midwest. I am health, safety, and Environmental personnel at the shipyard. PLEASE SUBSCRIBE to my vocal and check out my store
Enjoyed the story? Support the Creator.
Subscribe for free to receive all their stories in your feed. You could also become a paid subscriber, letting them know you appreciate their work.
Comments
There are no comments for this story
Be the first to respond and start the conversation.