

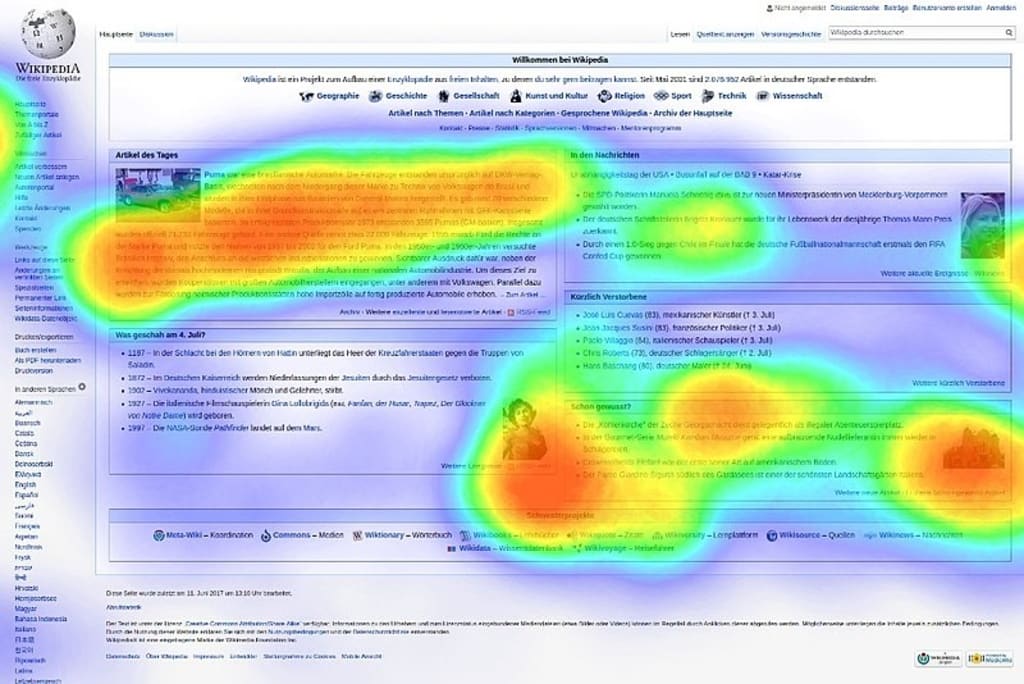
Types of the heat map
1. Mouse Tracking
Those are the most popular and commonly used heat map types. In order to capture the user's data, you need to add some monitoring code on your website, allow it to operate long enough to gather appropriate data and end up with a fascinating insight into how consumers communicate with their mouse while browsing a website. There are three major forms of mouse heat map that you can use.
Click and Tap Heat Map
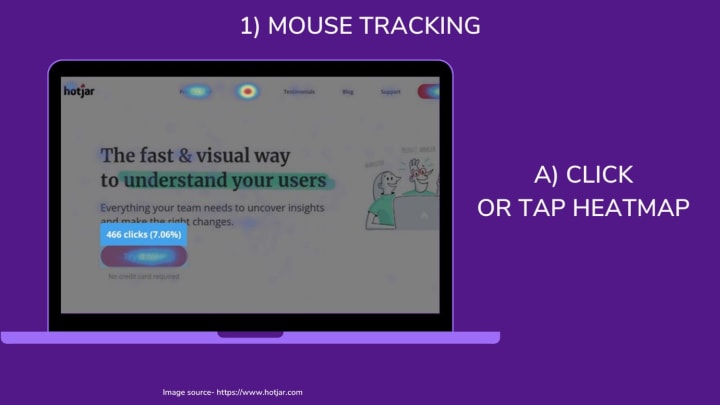
Click or tap heat maps to see where the users click. Tapping can be monitored if it is on mobile / tablet devices based on a touch screen. Such heat maps help you spot problems easily with your website such as are people clicking on the links? or are they clicking on links that are not clickable? They view which sections of a page are clicked on most (and least). Click maps are helpful to visualize what links & buttons are being used and also to find usability issues. The heat map is color-coded to display the most clicked items to least clicked (red, green, yellow).
Mouse Movement Heat Map
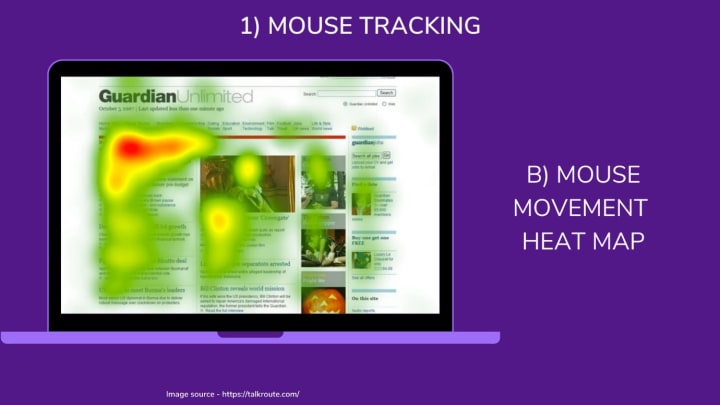
Move maps are mouse tracking heat maps. Move maps watch where users move and stop their mouse when browsing the website. The red spots points in a move map display when you stop the mouse Evidence in research shows a correlation between where users are searching and where their mouse is. A moving map informs you of where users are seeing when they are scrolling around the website.
Scroll Heat Map
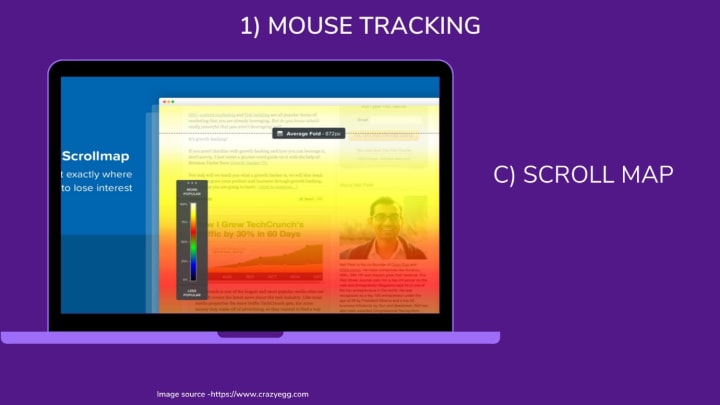
Scroll maps give you the actual proportion of people who scroll to any point on the page: the more red the location, the more users had seen it. A scroll map is a website heat chart displaying how quickly users travel down a site. The most noticeable and least prominent portions of a website from hot (popular) to cold (unpopular) can be obtained with scroll maps on a laptop, smartphone, tablet, and screen.
Confetti Heat Map
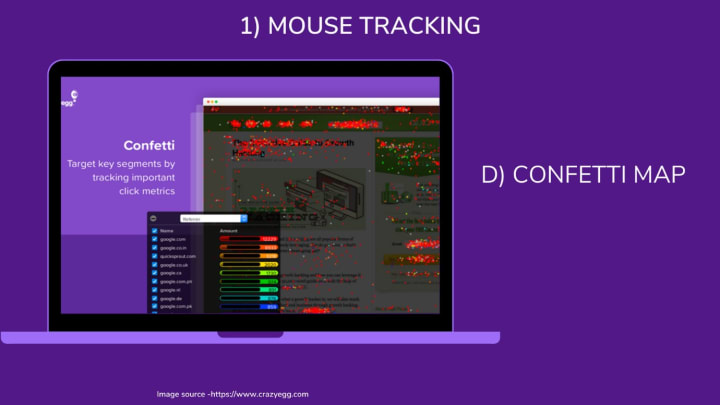
Confetti maps are special because they don’t just show the density of clicks. Instead, they show it like it is, that is, how many users clicked and where exactly they clicked. As a result, you can see all the mouse clicks on the page in the form of dots.
Most tools offering the confetti heat map as a feature often also feature a method of seeing which clicks came from which sources. For example, depending on how long you waited to aggregate the results, you’ll see a number of multi-colored dots strewn about the screen (hence the name confetti).
2. Eye Tracking Heat Map
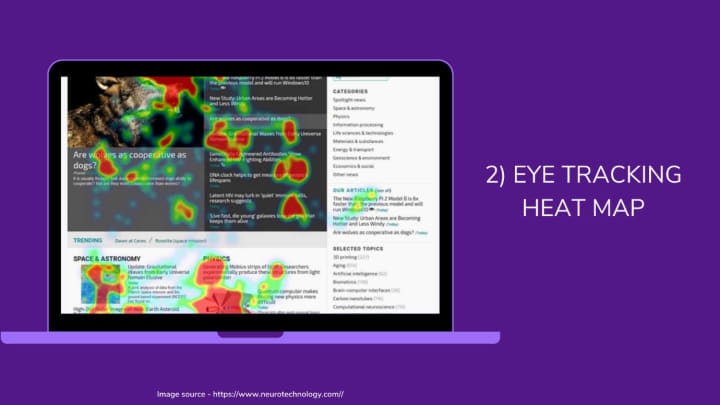
There are 2 main types of heat maps in eye tracking, and they're very different. A fixation volume heat map shows which parts of the page attracted the highest number of eye fixations. Fixation duration heat map shows how long they looked in a particular spot. For example, a fixation volume heat map will be more useful to understand which content actually stands out in a design (i.e. is the most eye-catching), while a fixation duration heat map might provide more insight into which content was most visually interesting for users.
Pros and Cons with eye-tracking heat maps
Pros –
1. In-depth insight beyond the transactional nature of clicks and mouse movements.
2. Can conduct a controlled study on prototypes and mock-ups designs
Cons –
1. It tends to be expensive and time-consuming
2. It needs respondents and takes weeks to complete the project
3. Attention Heat Map
This map is the equivalent of a 5 seconds eye tracking session of 40 participants. It shows which content most and least eye is catching for users when they first arrive. The results from Dhiti are 90% as accurate as lab-based eye tracking. The Heat map displays the most attractive elements of the image for viewers in the form of "hot" and "cold" spots creating a so-called heat map.
The Core Principle - “As humans, irrespective of our cultures, genders, and age groups, our visual system is wired to look at very much the same aspect of any design/image in first few seconds of viewing. That’s why it is possible to generate a predictive model of human visual attention.”
Dhiti - Attention AI- A predictive eye-tracking tool for designers, advertisers, marketers, agencies, and brands to pre-test your print and digital advertisements, signage, websites, apps, e-mail, packaging & shelf layouts.
About the Creator
Enjoyed the story? Support the Creator.
Subscribe for free to receive all their stories in your feed. You could also pledge your support or give them a one-off tip, letting them know you appreciate their work.
The Art of Work: Valuing Time in the Age of AI
Artificial intelligence isn't going away. You might be excited about that. You might be anxious. Whatever you're feeling, though, AI has become a permanent fixture in our society. As long as there's profit to be made, advancements in AI will shape the next wave of technology.
By Addison Horner15 days ago in 01


Comments
There are no comments for this story
Be the first to respond and start the conversation.