
How to Evaluate Recommender Systems
An Exhaustive List of Methods to Evaluate Recommender Systems


Imagine we have built an item-based recommender system to recommend users movies based on their rating history. And now we want to assess how our model will perform. Is it any good at actually recommending users movies that they will like? Will it help users find new and exciting movies from a plethora of movies available in our system? Will it help improve our business? To answer all these questions (and many others) we have to evaluate our model.
Below I provide many different techniques toevaluate the recommender system.
First I will discuss the maths-based methods for the evaluation. These help us lessen our algorithm options to use from bazillion algorithms out there.
After that, I will touch on more business-related metrics to help choose the best technique for our business.
In the end, I will discuss a few real-life scenarios to help further our understanding of recommendation problems in real life and how it varies with the domain.
Accuracy and Error Based Methods
Mean Absolute Error (MAE)
Mean absolute error is the average of the difference between the value predicted by the recommender and the actual value given by the user. And by the value, I mean the ratings given by the user. So first we compute the error by subtracting the predicted rating and actual rating for each user and then we take the mean of all the errors to calculate MAE.
Let see this in action with an example in a spreadsheet. Let’s say we calculated a recommendation score for movie Toy Story and we want to evaluate how accurate our model predicted scores. The below image shows how to do it.

MAE shows how much predicted score is far from the actual score. We take absolute (as the name suggests) in order to cancel the negative sign, as we are not interested positive or negative score, we only want to know the difference between real and predicted values.
Zero MAE means there was no difference between predicted and actual rating and that the model predicted accurately. Therefore, smaller the MAE the better. In our case, MAE is 1.5 which is close to zero indicates that our model will be able to accurately predict the ratings for movies for any given user.
Here is how it is represented in mathematical form:

Mean Squared Error (MSE)
Mean Squared Error is similar to Mean Absolute Error only difference is that instead of taking absolute of error to cancel the negative sign we square it.
MAE helps penalize results so even a small difference will result in a big difference. This also suggests that if MSE is close to zero that means the recommender system really did well because otherwise, the MSE won’t be this small.

Can you see what’s the one difference between MAE and MSE?
Root Mean Squared Error (RMSE)
MSE helps to negate the negative sign but it scales up the errors that cannot be compared to actual rating values due to different rating scales. So in our case from spreadsheet MAE was 1.6 but MSE is 4.

We can easily comprehend and compare MAE with ratings that overall difference for model’s prediction was 1.6 but we can’t say the same for 4 as we know it is not on the same scale as user ratings. This is were RMSE comes handy.
In RMSE, we take the square root of MSE to normalize the scale issue that MSE had. This normalizes our mean result on the same scale as it was for rating.
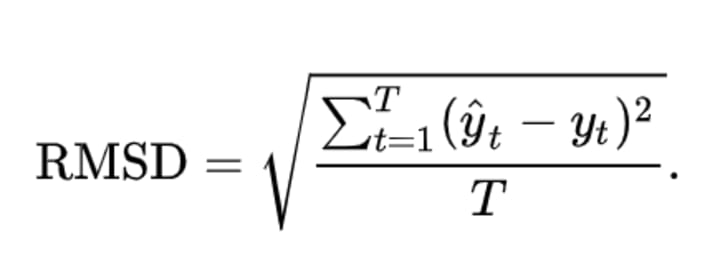
You must be asking what is the difference between MAE and RMSE. There is!. RMSE reconstructs the error terms while MAE doesn’t. MAE treats outliers and non-outliers equally while RMSE doesn’t. Also, RMSE will almost always be greater than MAE.
Did you notice? In our case as well RMSE is greater than MAE i.e. 2 and 1.6 respectively.

DECISION SUPPORT METHODS
Decision support metrics helps to understand how much the recommender was useful in assisting users to take better decision by choosing good items and avoiding bad items. Two of the most commonly used metrics are precision and recall.
Precision
Precision is the number of selected items that are relevant. So suppose our recommender system selects 3 items to recommend to users out of which 2 are relevant then precision will be 66%.

Precision is about retrieving the best items to the user assuming that there are more useful items available then you want.
Recall
The recall is the number of relevant items that are selected. So suppose there are 6 relevant items out of which recommender selects 2 relevant items then recall will be 33%

The recall is about not missing useful items.
Both precision and recall are commonly used to understand recommender systems' performance.
ROC Curve
Suppose we decide to recommend 20 items to users using our item-based collaborative filtering model. The 20 item list can have half of the items are correctly predicted while another half incorrectly predicted. Or it could have 90% of the items correctly predicted and only 10% are incorrectly predicted. Also changing the number of items to recommend will change how many correct and incorrect items our list has.
How to determine the best threshold of numbers of items to recommend that can get maximum relevant items and minimum irrelevant items? ROC curve can help us answer just that.
ROC curve helps to determine the threshold that could get us the best possible results. Here is how it looks graphically

ROC is a curve between correctly predicted items (TPR )and incorrectly predicted items (FPR). It provides insights if the goal is to tune the recommender to identify its sweet spots for its performance. You can view this video to get more understanding of ROC.
RANKING BASED METHODS
Methods we touched so far allow us to understand the overall performance of the results we get from the recommender systems. But they provide no information on how the items were ordered. A model can have a good RMSE score but if the top three items that it recommends are not relevant to the user then the recommendation is not much useful. If the user has to scroll down to search for relevant items then what’s the point of recommendations in the first place? Even without the recommendation user can scroll to look for items of their liking.
Ranking based evaluation methods assist us in understanding how suggested items are ordered in terms of their relevancy for the users. They help us to measure quality items ranking.
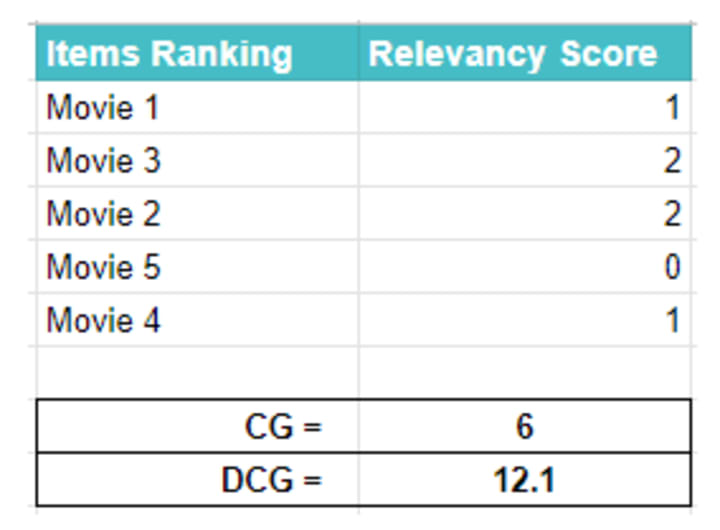
nDCG
nDCG has three parts. First is ‘CG’ which stands for Cumulative Gains. It deals with the fact that most relevant items are more useful than somewhat relevant items that are more useful than irrelevant items. It sums the items based on its relevancy, hence, the term cumulative. Suppose we are asked to score the items based on their relevancy as
Most relevant score => 2
Somewhat relevant score => 1
Least relevant score => 0
If we are to sum these score we will get cumulative gain for the given items.


But CG doesn’t account for the position of the items on the list. And hence, changing the item's position won’t change the CG. This is where the second part of nDCG comes in to play i.e. ‘D’.
Discounted Cumulative Gain, DCG for short, penalized the items that appear lower in the list. A relevant item appearing at the end of the list is a result of a bad recommender system and hence that item should be discounted to indicate the bad performance of the model. To do so we divide the relevance score of items with the log of its rank on the list.

DCG helps with the ranking but suppose we are comparing the different lists of the recommender. DCG for each of the list will be different depending upon where the recommender places the items. What will be DCG for when the most relevant item was placed at 10th position on 20 items list of recommender verses DCG for when the somewhat relevant item was paced at 10th position on 11th item list. To normalize this ’n’ of nDCG, the third part, comes in to play.
nDCG normalized the DCG values of the different number of the items lists. To do so we sort the item list by relevancy and calculate the DCG for that list. This will be the perfect DCG score as items are sorted by their relevancy score. We divide all DCG score of all the list we get by this perfect DCG to get the normalized score for that list.


Mean Reciprocal Rank
Mean reciprocal Rank, MRR for short, focuses on where is the first relevant item in the recommended list. MRR for a list with the first relevant item at its third position will be greater than for a list with the first relevant item at 4th position.
MRR takes the reciprocal of the relevant items’ position and sums them. If relevant items are on positions 2 and 3 on an item list MRR will be (1/2+1/3).

This also suggests that higher the item in the ranking the higher is the penalty and as the item goes down the list its penalty decreases. So relevant Item on number 58 wouldn’t matter.
Average Precision
Precision helps to understand the overall performance of the model but doesn’t tell if the items were ranked properly. Average Precision, AP, in short, helps to measure the quality of the selected item’s ranking of the recommender model.
It calculates the precision for only the relevant items that are recommended.
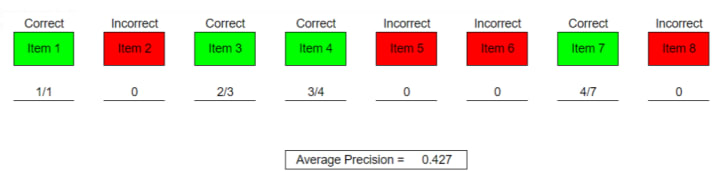
Suppose our model recommends 8 items, as depicted above, out of which 4 are correct and 4 are incorrect. We take the first relevant item and calculate its precision which in our case is the first item, therefore, its precision will be 1/1. Next, calculate precision for the second relevant item (item 3). Its precision will be 2/3. 2 because from 1st till the current item there are two correctly predicted items out of total 3 items. We will do the same for all the relevant items. Lastly, take the mean of the precision list to compute Average Precision.
The overall precision for this model is 0.5 while the Average Precision is 0.427. Lower AP indicates the quality ranking.
What will be the average precision when the first 4 items are relevant and how it performs compared to overall precision?
Spearman rank correlation evaluation
Spearman rank correlation computes the score of how model ranked the items compared to how they should be ranked. Let’s understand this with an example
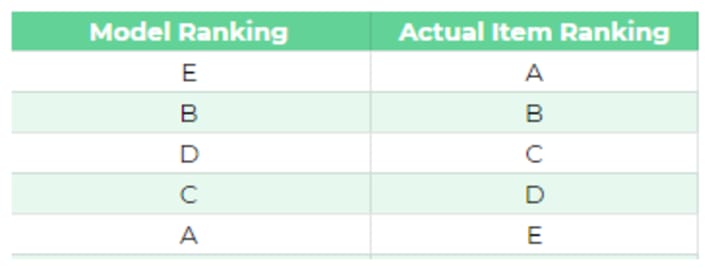
Suppose our model ranks the items (A to E) in the order shown in the image above. We then list the rank in which the recommender items are listed
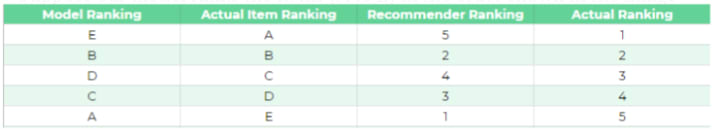
Recommender Ranking column in the image above list the rank in which the items are listed compared to how actual items. So ‘E’ was actually ranked in 5th position so we store add 5 in the ‘Recommender Ranking’ column for item E. We do the same for all other items.
Next, we calculated the difference between recommender ranking and actual ranking.

Now we calculate Spearman rank correlation using the difference’ as follows

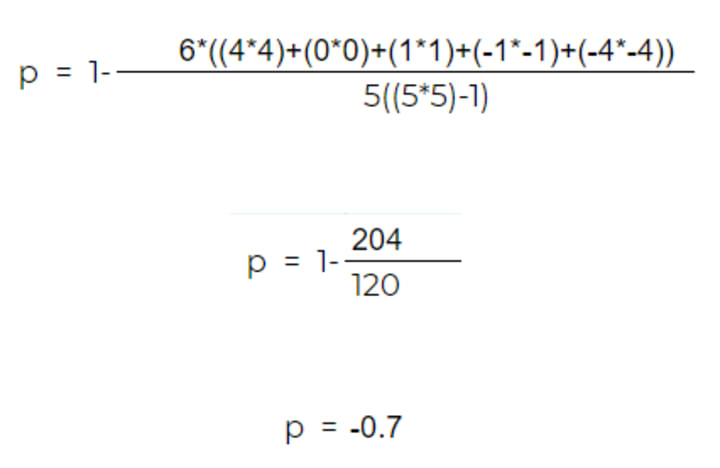
pearman rank correlation ranges between 1 and -1 with negative sign indicates that items are ranked in the opposite direction.
Other Method
We touched on different metrics to evaluate the performance of the recommendation system model in terms of its predicting, decision making, and raking power. But they don’t help us assess questions such as the number of items model is suggesting out of total item base. Or If the model recommends something out of unusual or it only recommending items similar to the user’s past history. Let discuss such approaches in this section.
Coverage
Coverage helps to measure the number of items the recommender was able to suggest out of a total item base. Suppose we have 1000 products and the model covers 800 of those items to the different users then it means that coverage of our recommender is 80% which is not bad. Coverage can be further broken down into the type of item. Percentage of populate items vs nonpopular items the model was able to suggest. If the goal is to suggest the maximum number of items to the user then coverage can be a very helpful tool to assess the recommender model.
Popularity

It is normal for some items to dominate user preferences. These are popular items. And it is equally normal for a recommender to also mostly suggest popular items. And it is neither a bad thing. It is up to us if we want our model to suggest popular items or we want recommender to suggest non-popular items. The popularity metric helps us evaluate just that. Able to understand how much of our recommender is suggesting such items can help us decide if we should move forward with the model or not.
Novelty
In some domains, such as in music recommender, it is okay if the model is suggesting similar items to the user. But even then suggesting similar items again and again can lead to bad user experience as users may want to explore new and something different. Novelty helps to understand such behavior of the model. Do our recommender model has the capability to recommend items out of the blue?. The novelty might not be useful where you are recommending items to a user on checkouts as users will be more interested in similar items that they purchased. But a place where the user is still exploring the website suggesting something completely new and different can be useful and novelty helps measure that.
Diversity
Similar to novelty, depending upon the domain and where we are to recommend items understanding our model's diversity is also useful. Measuring how diverse our model’s suggestion is can be very useful. As high diversity means that our users will always have something different and diverse to view and consume. So for the domain where we always want to show something new diversity is the metric to go for.
Temporal Evaluation
People taste changes with time. You might rate a movie 10 out of 10 when you watched it but after two-three years your rating might drop to 8 or event 6. This could be due to your taste may have changed or you got mature, or you are a completely different person now than you were back then when you gave the movie 10 stars. There are many factors that could change your likeness towards something. Considering temporal effects on an item can also help us built and evaluate the model. The winner of Netflix competition also had a temporal element in their model. Consider every rating that the user gave vs only taking into account the ratings that the user recently gave can have a substantial impact on our model’s ability to predict what user may like at that point in time. And we should consider this element as well when assessing the performance of a recommender system.
Business Metrics
Apart from measuring the prediction power of the recommendation system, it is very much important, or even more, to measure how the model is performing to achieve the business objective. Any model how sophisticated it maybe is built to help support business right?. Measuring the business metrics for which the model was built should be the end goal. If the model is to increase revenue and if revenue increases after integrating the recommendation system then that is a good recommender system for your business. If the model is targeted to improve the in-app experience and if you see daily active user increases then your model performed exactly why it was built. Improving email campaigns, increase retention rate, increasing in-app engagement, If a model delivers for what it was built then it is a good recommender system otherwise you should re-built and re-evaluate it.
I strongly recommend checking out this recommender evaluation course If you are interested to learn and tackle many such real-life problems. The mentors not only discuss evaluation methods in greater depth but also explains a lot of business scenarios and how to tackle them.
Conclusion
We touched on a number of ways to evaluate the performance of recommender systems. We started by discussing accuracy-based methods such as MSE and RMSE. We then looked at decision-based techniques such as precision, recall, and ROC curve. We also discussed ways to assess how our model is ranking items using rank approaches such as MRR, nDCG, and AP. Apart from mathematical methods we also touched on other methods such as coverage, novelty, diversity, and temporal based approaches. Lastly, we saw how to assess models considering the objective of the business for which we are creating the model
But regardless of what method you use, always remember it starts with a deep understanding of the domain and the problem we are solving for. The useful evaluation will always depend upon asking the right question.
Whatever method we choose to test our recommender system will almost always depend on the question we are trying to solve. And we will need to deeply understand the domain for which we are building the model. Below are some example scenarios to help you understand how methods to evaluate model changes with the problem we are given to solve.
Do note that there can be more than 1 solution to the problems discussed below. I won’t go in detail on that and I’ll let you find out.
1- An e-commerce company reached out to you to build a model that could suggest 2 items on their checkout page. Their analytics systems have around 30% of the user’s purchase history and 10% of items with rating history. What method will you use for this type of problem? RMSE, Precision, MRR, nDCG or any other method?
2- A online music company wants you to build a model that could recommend users new songs that they have never heard of. They also want you to show a predicting score for each song that the system recommends. The company wants to increase the user's average time on the website.
3- You are tasked to build a model for a medical consultancy firm that could recommend the best consultant to the users based on the symptoms and issues they are facing. Keeping in mind that any consultant can entertain one patient at a time so recommending best to all won’t work. Also, you cannot suggest just any consultant to any patient. There background and locality are also needed to be considered.
4- ABC gym wants to play the music in their gym which could motivate the people inside. The gym is for both males and females and is open throughout the day. The owner of the gym has informed you that their customer base comprises of people from different backgrounds. The task is to recommend songs considering customer’s gender, background, time of the days to play the music that could motivate them, and pleases majority of the people.
What evaluation methods will you use to test the model’s performance that could overcome the issue the business owners are facing?
Tip: To tackle the above problems you need to have a strong understanding of the domain and need to consider every aspect of the business to decide what method to go for.
Similar Reads
About the Creator
Keep reading
More stories from muffaddal qutbuddin and writers in 01 and other communities.
Understand How Item Based Collaborative Filtering Works
Recommendation systems have been around us for quite some time now. Youtube, Facebook, Amazon, and many others provide some sort of recommendations to their users. This not only helps them show relevant products to users but also allows them to stand out in front of competitors.
By muffaddal qutbuddin3 years ago in 01


Comments
There are no comments for this story
Be the first to respond and start the conversation.