

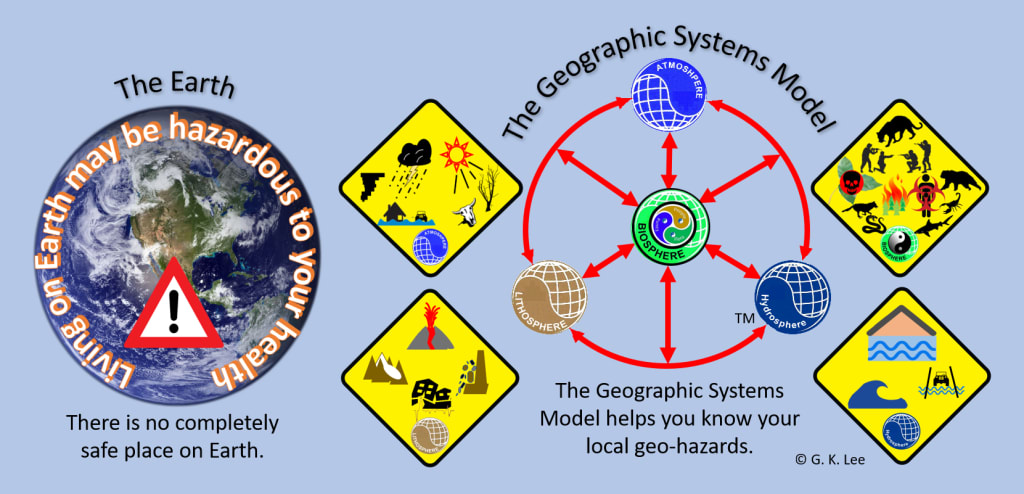
There is no completely safe place on Earth. Natural disasters can destroy in minutes what took humans years, decades or even centuries to build. The UN Sendai Framework for Disaster Risk Reduction identified lack of awareness of local geo-hazards as a major problem. A geo-hazard (i.e. geo = Earth, hazard = risk or danger) in this paper refers to natural disasters and their causes. Governments may have emergency plans, but many smaller rural and poor communities don’t. Teaching the Geographic Systems Model supports the Sendai Framework. When people are more aware of their local geo-hazards they can:
1) Know the hazard zones and safer zones.
2) Plan routes for evacuation and delivery of relief supplies.
3) Make better land use plans to reduce the impact of natural disasters.
4) Make emergency preparation plans and increase resilience.
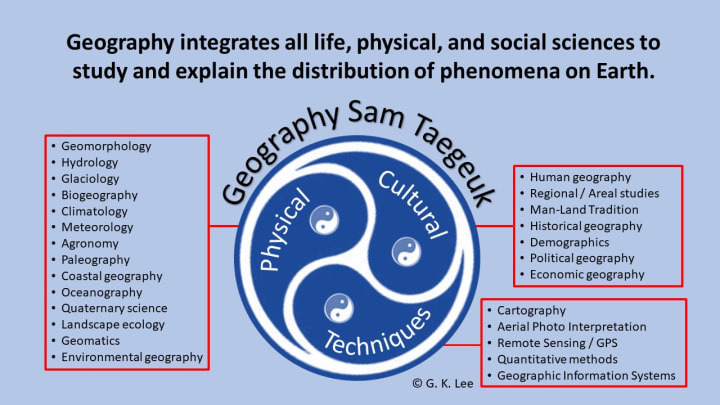
This article is an overview of how the Geographic Systems Model can be used to teach people to identify their local geo-hazards. Geography integrates all life, physical, and social sciences to describe and explain the world around you. All of us live on planet Earth. We are surrounded by the natural world. We are all connected by Geography. This Model can be used in elementary to college classrooms. It can get students to connect their classroom lessons to their local community and daily lives. The Geographic Systems Model brings continuity to their education. This can be done without altering the curriculum. And it can cost next to nothing.
I developed the Geographic Systems Model as a systematic tool to study the environment. I used it to teach natural science. Teaching by example is a tried and true method. So, I also use it in my daily life. I’ve used it when buying my home in California to avoid areas prone to wildfires, landslides, flash floods, and flooding. It was my primary tool used to plan local and international field trips. [Note: In 17 years of teaching, I only had to cancel 2 international trips and postpone 3 local field trips for reasons related to Nature.] In Thailand, I used it to manage a sustainable rural family farm. I created emergency preparedness (EmPrep) and emergency communications (EmComm) plans for small HAM (amateur radio) groups in the US and overseas. The Geographic Systems Model works.
Use the Geographic Systems Model
We all live somewhere on Earth. Our location determines our environment. Geo-hazards are part of our local environment. They may be known or unknown. Some are familiar and relatively predictable (like seasonal storms). Others may be unfamiliar and unpredictable (such as earthquakes). Geo-hazards vary in size, magnitude, intensity, duration, etc.
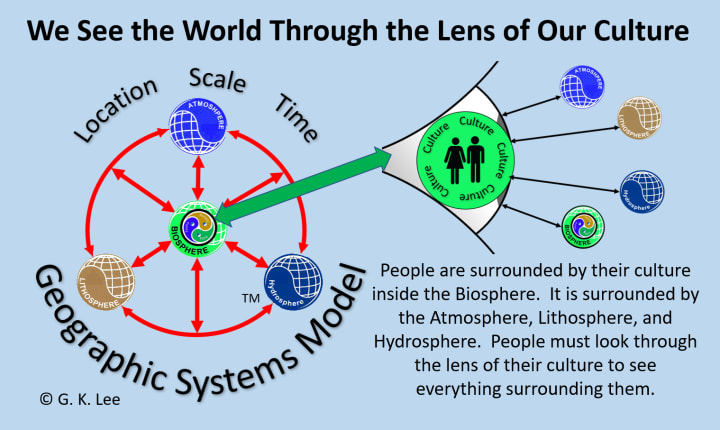
Every location has advantages and disadvantages. Where we are born and grow up shapes our world view. Our life, family, and community set what we consider “normal.” Our way of life forms our culture. We see the world through the lens and filter of our culture. When people from different places on Earth look at the same object, they may perceive it differently. They may all “see” a tree. Some see it as a food source. Others primarily value its shade. Still others use it for building materials. Their perceptions are not right or wrong. Their perceptions are just different. [Note: Even people from the same culture can look at the same thing and “see” it differently. Look around you. I doubt everyone in your life have the same opinion about what is the best food to eat.] This is why I say, “Geography may not change the world, but it will change the way you see it.”
Using the Geographic Systems Model
The Geographic Systems Model is a conceptual framework to guide your view of the world. It divides the world into four realms. Three are non-living (Atmosphere, Lithosphere, Hydrosphere) and one is living (Biosphere). Each environmental sphere has associated matter, energy, and processes. Knowledge of these environmental spheres helps you understand the geo-hazards affecting your area.
Location, Scale, and Time are important concepts in this model. Your location on Earth reveals the matter and energy available to power a geo-hazard. For example, the closer you are to the Equator, the more heat energy is present to power weather systems. Your distance from water bodies affects moisture content of the air. Elevation above sea level also affects air temperature and moisture. The higher you go on mountains, the temperature decreases. This affects vegetation types. If forested mountain slopes are cleared, the potential for landslides and floods increases.
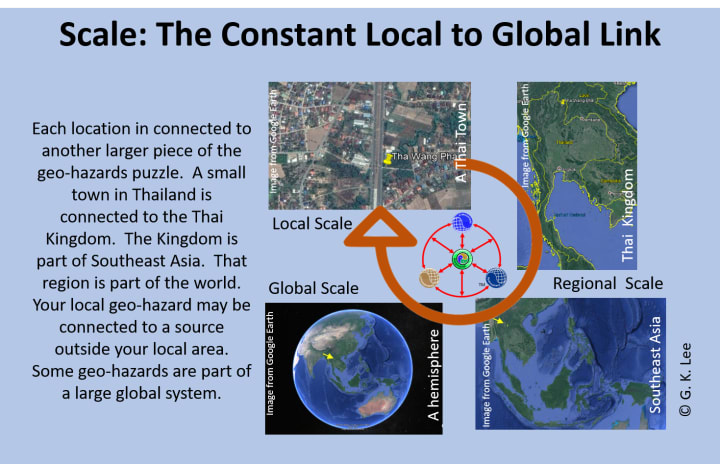
Scale refers to the size and level of detail. We can look at places in terms of their local, regional, or global setting. From space, we can see large expanses of the Earth’s surface. With our eyes, we cannot see as much detail as when looking down from an airplane. You can see more details on the Earth’s surface from the airplane, but for a smaller area than from space. When you walk on the ground, you see more detail for a smaller area than from an airplane. Even on the ground, you would see different amounts of detail when standing looking at the grass than if you were kneeling to examine the grass.
Time is the sequential passage of events. In Geography we use the natural time intervals of day / night and the cycle of the seasons of the year. When studying natural systems, changes in heat energy and moisture varies from day to night as well as season to season. The diagram below summarizes how Location, Scale, and Time affects temperature and moisture on Earth.
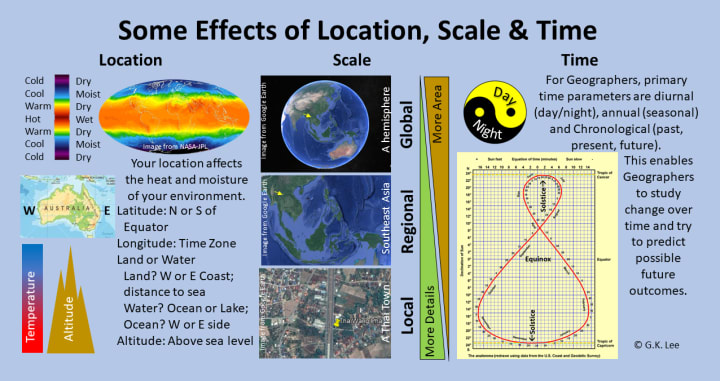
You can use the table in the diagram below to systematically compare-and-contrast two or more places. Finding similarities and differences between places can lead to more questions. This begins the process of understanding the relationships of people to their environment. For example, the same kind of geo-hazard occurs in different places. Yet how people perceive the risk / hazard may be different. This could lead to new ideas for dealing with your local geo-hazards. Remember, there are no “right/wrong” ways to see a risk or danger. People see things differently.
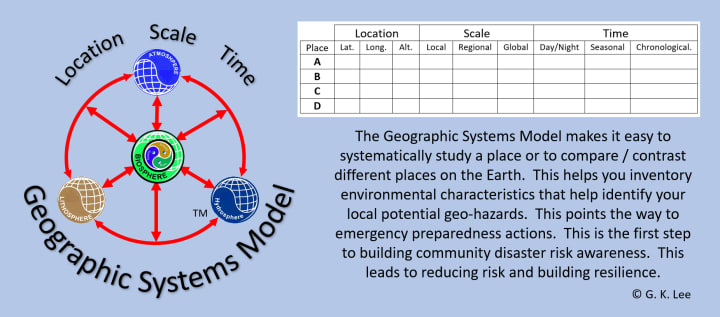
The arrows in the Geographic Systems Model show the possible connections between the environmental spheres. Materials and energy may move along these pathways from one sphere to another. As matter and energy move between the environmental spheres, energy is used or stored. Matter may change forms. The matter and energy can be moved vertically away or toward the Earth’s surface. Air and water currents can move energy and matter horizontally between the Equator and the Polar regions as well as East / West across the globe. The model shows why we can say all things are connected. [Note: Watch for a future paper describing the Geographic Systems Model in more detail.]
The Geo-Hazards
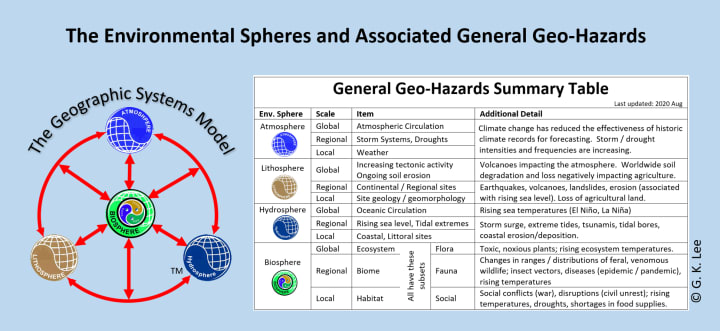
Each environmental sphere is associated with various geo-hazards. The summary table lists each environmental sphere, scale, and major phenomena, and details of key geo-hazards. This table gives you a starting point to begin your search for local geo-hazards. Once you identify them, look for connections between the local and regional scales. Then from regional to global scale. For example, you are at a coastal location where tsunamis are a concern. At this level, you need to know something about the direction from which tsunamis may approach. Then look at the near-shore and sea floor topography and water depth. These local factors help determine tsunami height. At the regional scale and global scales, you would look for seismic zones capable of generating tsunamis. This information helps you to assess the likelihood of an event. The distance from the source to your location lets you estimate the approximate warning time you may get that a tsunami is on its way. Of course, this depends on other factors such as national and international warning systems, agreements, etc. This example shows the need to look beyond your local level. Using this approach, you get a better understanding of how regional and global factors can directly and indirectly affect your location.
Synergy in Natural Systems
Synergy is a condition when the whole is greater than the sum of its parts. In math, it might be something like 2 + 2 = 8. Normally we would think there’s been a mistake. It must be mathi-magic, right? Another example might make this clearer. You go to the store and see a bicycle for sale. You want to buy two of the same model bicycle. The store only has one new one (in the box) and the assembled one for display in the window. The store manager tells you they won’t be getting more. You buy both and take them home. If you remove the unassembled bicycle from the box, it should weigh the same as the fully assembled bicycle. They both have all the same parts. You can’t ride the unassembled bicycle. Thanks to synergy, you can ride the assembled bicycle to go around town. The whole (assembled bicycle) is greater than the sum of its parts.
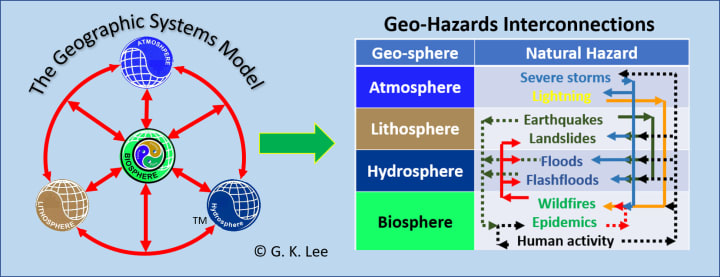
Natural disasters are often a combination of factors from one or more environmental spheres. For example, a forest fire occurs in the Biosphere. After the fire, the mountain slopes (Lithosphere) are often bare exposed soil. Heavy rain (from the Atmosphere) on the slopes erodes the soil and can create landslides (on the Lithosphere). Landslides can block streams and rivers causing flooding (Hydrosphere). Increased sediment loads can damage aquatic habitats (Biosphere). Geo-hazards can occur singly, in sequential order, or simultaneously in varying combinations. The diagram below shows some of the possible linkages of geo-hazards to one another.
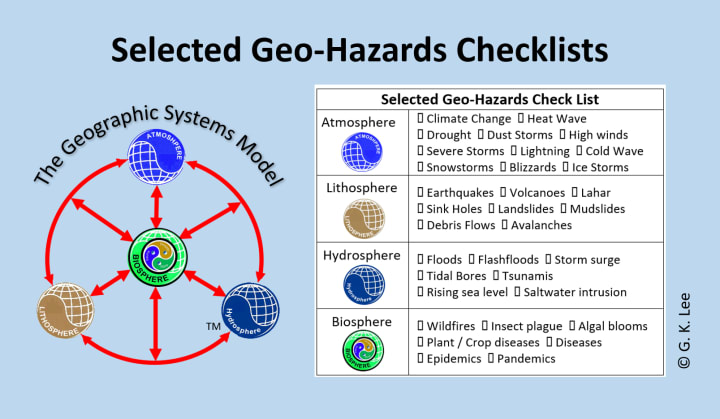
The table below lists the environmental spheres and selected geo-hazards. The information in the table is not comprehensive. This is the initial phase of awareness for those unfamiliar with natural sciences. Use the checklists to guide your search to discover your local geo-hazards. For your personal safety and well-being, you must know your local geo-hazards.
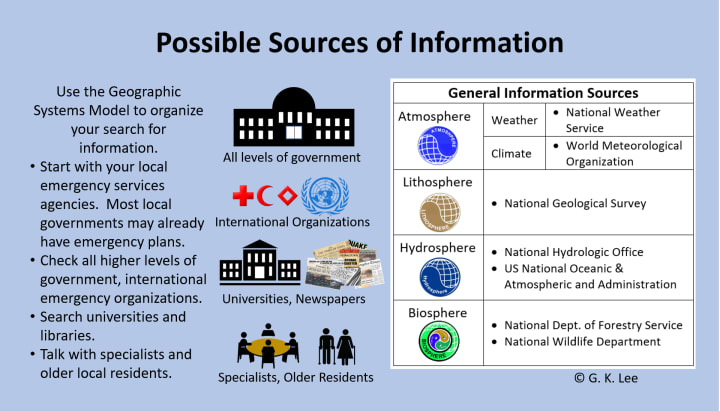
Sources of Information
Use the Geo-Hazards Checklists to organize your local geo-hazards search. Many local governments have emergency plans. Get a copy and check the date. It may need to be updated. See what geo-hazards are mentioned. Do they have emergency plans for each one? If so, get familiar with them. If not, there is work to do to fill the gaps. Don’t stop your search for local geo-hazards here. There may be other local geo-hazards that were unknown at the time they made the plan.
The diagram below summarizes some general places to seek more information. Seek information from higher level so government in your country. Consult international emergency organizations (i.e. International Red Cross / Red Crescent, and the United Nations). See if universities have studies or reports on the potential for local natural disasters. Go to the library and look through old newspapers. Include legends, folk tales, and oral histories. While some may discount legends and folklore, remember oral histories existed before writing. True, some things get skewed in the telling. You may be surprised to find some consistency between folktales and modern scientific facts. Talk with long-time residents. During the research phase, you are casting a wide net.
Avoiding Hazard Areas
Make use of available government geo-hazard maps. Your priority is to avoid being in a geo-hazard area. Don’t expect the hazards to be neatly separated. Some areas may be affected by more than one type of geo-hazard. The sample below comes from the Philippines. The map shows two types of geo-hazards: Landslides and Floods. These two phenomena tend to affect different areas. Landslides tend to happen on steeply sloping land which implies higher elevation. Floods occur in low-lying areas. So, it is unlikely a piece of land would have a high risk of landslides and flooding. But don’t think that you are safe at the edge of the “High Flood Risk” / “Low Landslide” area (see red arrow in diagram below). You could be outside the “High Flood Risk” area but still get flooded.
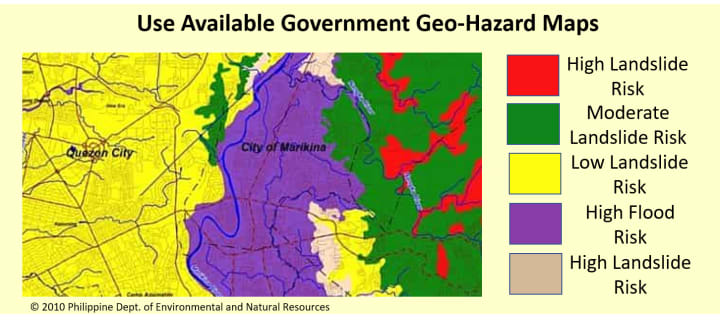
If you are familiar with the Philippines, you know typhoons are natural hazards that strike every year. The area shown above can be hit by a typhoon. Heavy rains can cause landslides and flooding. Those hazards are shown on the map. Typhoons also have strong winds. The map does not show this hazard. Depending on the orientation of the shore to the approaching storm, coastal flooding can also occur by wind-driven waves (i.e. storm surge). Low lying areas next to rivers on the coast can face double trouble. The heavy rains from the typhoon cause flooding in settlements along the river. When the river reaches the coast, storm surge adds more water to an already flooded coastal settlement.
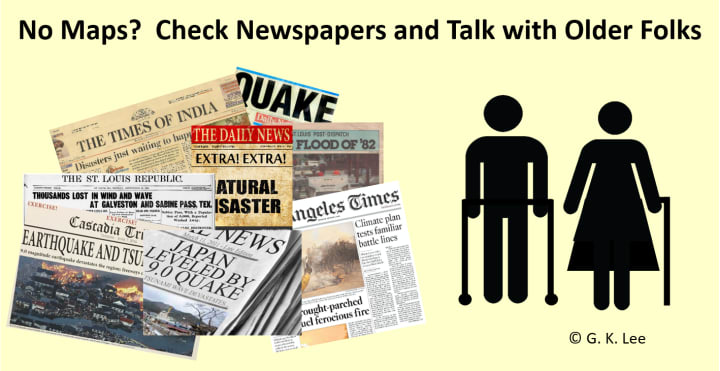
If there are no maps for your area, look at past newspaper articles. You may not find maps, but the articles may describe the area (e.g. a neighborhood name, the section of the city, or street names). Don’t forget to talk with long-time residents. Memories may not be as precise as maps from satellites and computers. And some types of geo-hazards have not occurred in the lifetime of some older folks. Therefore, your data search must be wide-reaching.
Don’t forget to make notes about the time intervals for local disasters. Some storms are seasonal. Earthquakes and tsunamis are irregular and unpredictable. However, earthquakes can make tsunamis. The quake can be across the Pacific (well beyond your local area). Yet it can produce a tsunami that poses a threat to you from a quarter of the world away or more.
Identifying Safer Areas
Finding safer areas sounds simple. Look at the various maps and find clear areas with no geo-hazard. You may get lucky to find some areas totally risk free or which have a very low risk of all local geo-hazards. If not, then you will need to settle for areas where the risk is lower for as many geo-hazards as possible. These relatively “safer” areas are the places to locate critical government offices and emergency services (e.g. police and fire stations, hospitals, schools, etc.) Schools are often used for emergency shelters because they can hold many people. Also, playgrounds and sports fields can serve as emergency helicopter landing zones (LZ). [Note: The LZ size depends on the type of helicopters used. A safe bet is a football field. Larger helicopters can use them. These are large and open enough to be clear of vertical obstructions (e.g. trees, power lines, etc.) Place a large flag somewhere along the perimeter of the field. This shows the pilot surface wind direction for landing.] Before finalizing any decisions about these safer areas, check the access routes going to and from them.
Assessing Access Routes
The more access routes to a safer area the better. All access routes should be assessed for geo-hazard risks. Having more than one route is useful. The least vulnerable are your primary routes. Be sure to have alternative routes, too. You are less vulnerable if you have an alternative route getting to and from a safe zone.
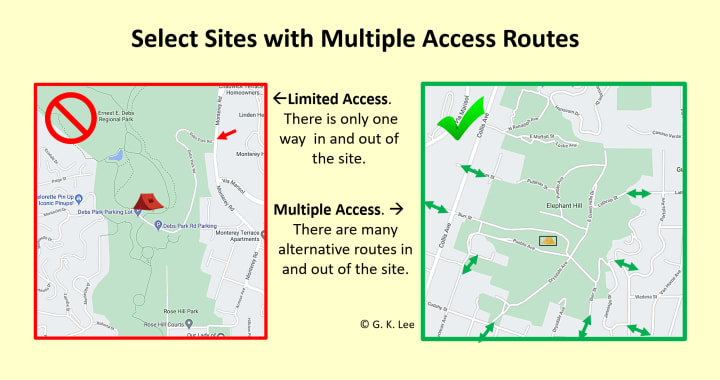
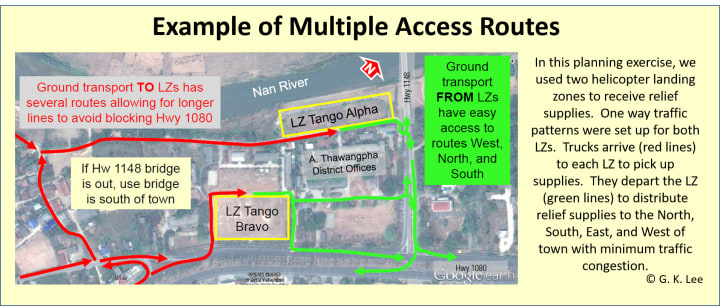
Another advantage of multiple access routes to a safe zone is reducing traffic congestion. In some major disasters, damaged roads and limited access were major problems. Supplies were flown in only to get piled up at the airport. Few trucks, gas shortages, limited access, and damaged roads slowed distribution efforts. In some cases, long delays cause relief supplies to be spoiled and unusable.
The diagram below shows an emergency plan for a small rural town next to a river. It was an administrative center. There was no airport nearby. The river was not navigable by transport vessels or barges. We chose these two helicopter landing zones because they were large open fields with multiple road access to a major highway. One LZ was susceptible to 100-year floods. The highway bridge (top right of photo below) was a point of vulnerability. If the bridge went out, the only alternative route West was a bridge immediately south of town. After that, two other alternative bridges West required driving on the main highway an hour north and south from town. This situation pointed out the need for a contingency plan for supplying people West of the river. During the rainy season, highway bridges are at risk of damage. So, emergency operations require monitoring the condition of all key bridges along possible relief routes.
Changing Scale to Connect to the World
For many people, “out of sight, out of mind” is a common work mode. The Geographic Systems Model makes you aware of things beyond your local level. The concept of Scale in the Geographic Systems Model shows how your location is connected to the rest of the world.
I recall the building of a new library on a college campus. Many construction contracts have penalty clauses if the job isn’t done on time. They were close to putting the roof on the growing library structure. They were not able to get materials to complete the roof. They were falling behind schedule. A severe hurricane struck the US East Coast. The college was on the West coast. The severity of the hurricane was such that all available roofing materials were diverted to disaster recovery efforts. I couldn’t help thinking, “too bad they didn’t have a geographer on staff.” Hurricanes rarely strike the US West Coast. Yet a hurricane on the other side to the US affected the library roof project on the West Coast. The connections may be direct or indirect. In the end, you can be affected by geo-hazards thousands of miles away.
Change scale and assess access routes coming to and going from outside your local area. If supply routes are blocked at the regional level, you may be impacted. You want to know the vulnerability of each route. Identify alternative routes and their vulnerability. This helps you identify primary and alternate evacuation routes for relief supplies and evacuation. Once vulnerable points (e.g. landslide areas, roads prone to flooding, possible bridge washouts, etc.) are identified, you can make mitigation plans. Calculating travel times (including possible delays) help you to estimate time to get relief supplies into the disaster area. Examine road conditions and travel times for day / night, seasonal, and weather conditions. The more information you have, the better your emergency plan.
What to Do Next?
Once you know your local geo-hazards, you can use the information to:
1. Use the hazard zone information to make an emergency plan. This could include risk reduction measures. These steps can build disaster resilience to shorten recovery time.
2. Avoid locating in a hazard zone.
3. Consider moving to a safer zone.
4. Estimated travel times for relief to arrive helps you determine how long you need to hold out. This affects the quantity and types of emergency supplies you need to prepare.
Thanks for taking time to read my article. If it was useful, please “like” it and share it with others. The number of reads encourages me to continue writing related articles. Possible follow-on articles include making emergency plans, information on emergency communications, emergency water treatment, etc.
About the Creator
Best Season for Everest Base Camp
An exciting trip to Everest Base Camp (EBC) is something that many people want to do. The trip gives you a chance to see beautiful scenery, learn about other cultures, and push your limits in the world's biggest mountains.
By Nepal Trek Adventures & Expedition Pvt. Ltdabout 11 hours ago in Wander


Comments
There are no comments for this story
Be the first to respond and start the conversation.