


Trading charts come in various forms, including bars and candlesticks charts. In this article, we will focus on how candlestick charting can help traders in their trades. A candlestick chart shows the high and low opening and closing prices at a specific point in the chart, whereas bars represent the same data in a different way. Daily charting, for example, shows each bar/candlestick as a specific day of trading activity. Some traders prefer to set their trading at two-minute intervals, while others opt for 15-minute intervals.
The essential aspect of candlestick and bar charting is to focus on the price and volume of a trade, as it helps identify areas of profit, reversals, and stop limits. The ultimate goal is always to determine the probability of profit, where to enter and exit a trade, and most importantly, to develop a strategy that works for you based on your specific candlestick choices.
Bearish and Bullish Patterns
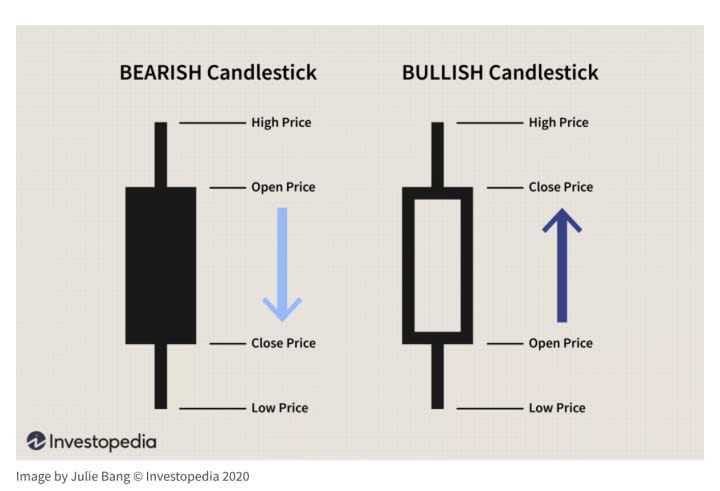
In stock market terminology, "Bearish" refers to a downtrend, indicating a fall or start of a downward trend with the going price higher than the closing price. On the other hand, "Bullish" usually represents an uptrend, with the opening price lower than the closing price and displayed in green. Bullish patterns come in various forms, including abandoned baby, hammer, and dark cloud, among others. Technicians analyze momentum, oscillators, or volume, which all confirm buying in these patterns.
The objective is always to buy low and sell high, and as we learn more about patterns, we understand more about technical analysis and what to look for before opening a trade and what to watch for when closing a transaction. Short term signals, volume, and trends are vital in the forex market, where technical analysis is crucial because it focuses on short price movements. Once you understand candlesticks and can read bars, you can anticipate how history will repeat itself in the stock market and find it before it happens.
Bullish Patterns and Analysis
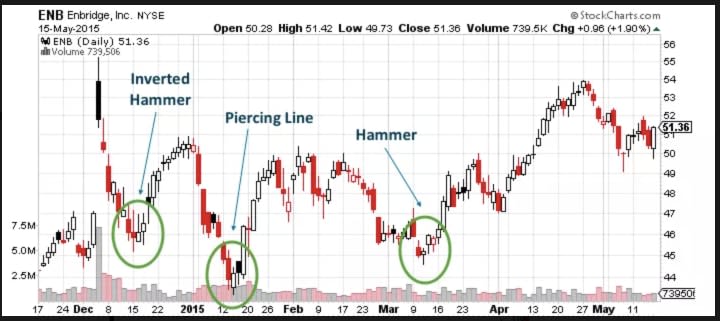
The above graphic displays different bullish patterns, including abandoned baby, hammer, and morning star, among others. In a later post, we will discuss both bullish and bearish patterns and other ways to identify them. Buying on a low, low with a technical analysis strategy and selling high, high is the best way to profit from these patterns.
Understanding Your Patterns
To understand patterns, we need to watch what our candlesticks/bars are doing. Point and Figure (P&F) charts are the easiest to read and prepare your daily trades, and we will discuss them in detail later. It is crucial to have a trading strategy in place and plan out your trades before making any moves. If you are new to trading, seek advice from a licensed financial advisor or accountant before making trades. You are responsible for your stock market portfolio. All advice provided here is from personal trading experience, and it is essential to understand that it is subjective and may not be suitable for everyone.
Candlestick charting is a popular method of charting that focuses on high and low opening and closing prices at a certain point in the chart. Bullish and bearish patterns are different chart patterns that represent an uptrend or a downtrend, respectively. Technical analysis involves studying volume and trends to discover signals for short term trades.
In conclusion, understanding trading charting basics, bearish and bullish patterns, and technical analysis is crucial to succeed in the stock market. Watching candlesticks/bars and identifying patterns using P&F charts can help traders anticipate how history may repeat itself in the stock market and find profitable trades.
Reference:
Using Bullish Candlestick Patterns To Buy Stocks
https://www.investopedia.com/articles/active-trading/062315/using-bullish-candlestick-patterns-buy-stocks.asp
Technical Analysis
https://www.investopedia.com/terms/t/technicalanalysis.asp
Point and Figure Charting: A Basic Introduction
https://www.investopedia.com/articles/technical/03/081303.asp
About the Creator
Bharath S
From Oddanchatram, Tamil Nadu, India
Survey Success:
There are endless opportunities to make money online from the solace of your own home. One famous technique is taking surveys, which can be an incredible method for earning some extra cash in your spare time. However, not all survey takers are equal. To genuinely boost your earning potential, it's critical to approach survey-taking like a pro.
By Signor Wilson6 days ago in Trader
How to resell tickets on Stubhub or Ticketmaster
Ticket reselling has become a popular way for individuals to sell tickets they can no longer use or to profit from high-demand events. Platforms like StubHub and Ticketmaster offer secure and user-friendly environments for buying and selling tickets, ensuring a safe transaction for both sellers and buyers. This guide aims to provide a detailed overview of how to effectively resell tickets on these platforms, from setting up your account to successfully completing a sale. Whether you're a seasoned reseller or new to the practice, this guide will equip you with the knowledge and tips needed to maximize your success and avoid common pitfalls.
By amaan anderson7 days ago in Trader


Comments
There are no comments for this story
Be the first to respond and start the conversation.