
The Ultimate Guide to Crypto Trading Chart Patterns for Beginners
Looking to improve your crypto trading skills? This beginner's guide to crypto trading chart patterns covers everything you need to know to get started. From support and resistance levels to bullish and bearish chart patterns, we've got you covered.

I. Introduction
When it comes to crypto trading, understanding chart patterns can be a crucial aspect of making informed trading decisions. Chart patterns can help you identify trends and potential price movements, giving you an edge in the market. But for beginner traders, chart patterns can seem overwhelming and confusing.
In this ultimate guide to crypto trading chart patterns, we'll break down the basics of chart patterns and provide you with a comprehensive overview of how to read and use them in your trading strategies. Whether you're a seasoned trader looking to brush up on your skills or a complete beginner looking to get started, this guide is for you.
We'll cover everything from the basics of technical analysis to common bullish, bearish, and indecision chart patterns, as well as how to combine chart patterns with other technical indicators. By the end of this guide, you'll have the knowledge and tools you need to confidently navigate the world of crypto trading chart patterns. So let's get started!
Join Binance using my referral link and receive a discount on trading fees!
A. Explanation of why understanding crypto trading chart patterns is important for beginners
As a beginner trader in the crypto market, it's important to have a solid understanding of chart patterns. Chart patterns can help you identify trends and predict potential price movements, allowing you to make informed trading decisions.
By analyzing historical price data, chart patterns can provide insights into the psychology of the market and the behavior of traders. They can help you identify support and resistance levels, which are key areas where the price is likely to either reverse or break through. Chart patterns can also help you recognize potential trends, such as uptrends, downtrends, and sideways movements.
By understanding these patterns, you'll be able to make more informed trading decisions and avoid common mistakes that can lead to losses. For example, you'll be able to identify when a price is likely to break through a key resistance level and potentially continue its upward trend, allowing you to enter a long position with confidence.
Overall, understanding crypto trading chart patterns is an essential skill for any trader in the crypto market. By taking the time to learn about chart patterns and how to use them, you'll be setting yourself up for success and increasing your chances of making profitable trades.
Join TradingView today for the ultimate trading experience!
B. Brief overview of what the article will cover
In this ultimate guide to crypto trading chart patterns, we'll cover everything you need to know to get started with chart patterns, including:
The basics of technical analysis: We'll explain what technical analysis is and why it's important for trading. We'll also introduce you to common technical analysis tools, such as candlestick charts, trend lines, and support and resistance levels.
Bullish chart patterns: We'll define bullish chart patterns and explain how they signal an uptrend in the market. We'll also go over some common bullish chart patterns, such as the double bottom and ascending triangle.
Bearish chart patterns: We'll define bearish chart patterns and explain how they signal a downtrend in the market. We'll also cover some common bearish chart patterns, such as the double top and descending triangle.
Indecision chart patterns: We'll define indecision chart patterns and explain how they signal a potential trend reversal. We'll also discuss some common indecision chart patterns, such as the doji and spinning top.
Combining chart patterns with other technical indicators: We'll explain how to use chart patterns in conjunction with other technical indicators, such as moving averages and relative strength index (RSI). We'll also go over the benefits and drawbacks of this approach.
Putting it all together: We'll provide an example of how to use chart patterns to make a trading decision. We'll also explain why it's important to consider other factors, such as market trends and news events, when making trading decisions.
By the end of this guide, you'll have a solid understanding of chart patterns and how to use them to make more informed trading decisions in the crypto market.
Also Read: A Beginner's Guide to Bitcoin Mining with Kryptex: How to Get Started and Maximize Your Earnings
II. The Basics of Technical Analysis
A. Definition of technical analysis
Technical analysis is a method of analyzing financial markets by examining historical price data and identifying patterns and trends. This approach to analysis is based on the belief that past price movements can provide clues about future price movements.
Unlike fundamental analysis, which focuses on the underlying economic and financial factors that affect an asset's value, technical analysis is solely focused on the price and volume data of an asset. Technical analysts use a variety of tools and techniques, such as charts and technical indicators, to analyze this data and identify patterns that can be used to predict future price movements.
One of the key principles of technical analysis is that market trends tend to persist, meaning that assets that are trending up or down are likely to continue doing so. Technical analysts also look for support and resistance levels, which are areas on a chart where the price has historically had trouble moving past.
While technical analysis can be a powerful tool for predicting future price movements, it's important to note that it's not foolproof. Market trends can change suddenly, and unexpected news events can cause sudden price movements that technical analysis alone may not be able to predict. As such, it's important to use technical analysis in conjunction with other factors, such as fundamental analysis and market trends, when making trading decisions.
B. Explanation of why it's important for trading
Technical analysis is a vital tool for traders looking to make informed investment decisions. By analyzing historical price data, technical analysts can identify trends and patterns that can be used to predict future price movements. This can be especially useful in the fast-paced world of cryptocurrency trading, where prices can fluctuate rapidly and unpredictably.
One of the key benefits of technical analysis is that it provides traders with a way to quantify and visualize market trends. This can help traders make more informed decisions about when to buy or sell an asset, and can also help them manage risk by identifying key support and resistance levels.
In addition, technical analysis can help traders cut through the noise and focus on what's really important: price and volume data. By filtering out the news and other extraneous information, traders can get a clearer picture of market trends and make more informed investment decisions.
Finally, technical analysis can help traders stay disciplined and avoid emotional trading decisions. By using objective tools and techniques to analyze the market, traders can avoid getting caught up in the hype and speculation that can lead to impulsive and irrational trading decisions.
Overall, technical analysis is an essential tool for any trader looking to make informed investment decisions in the fast-paced world of cryptocurrency trading. By providing a way to quantify and visualize market trends, technical analysis can help traders make more informed decisions, manage risk, and stay disciplined in the face of market volatility.
C. Introduction to common technical analysis tools
Technical analysts use a variety of tools and techniques to analyze market trends and predict future price movements. Here are some of the most common technical analysis tools used by traders:
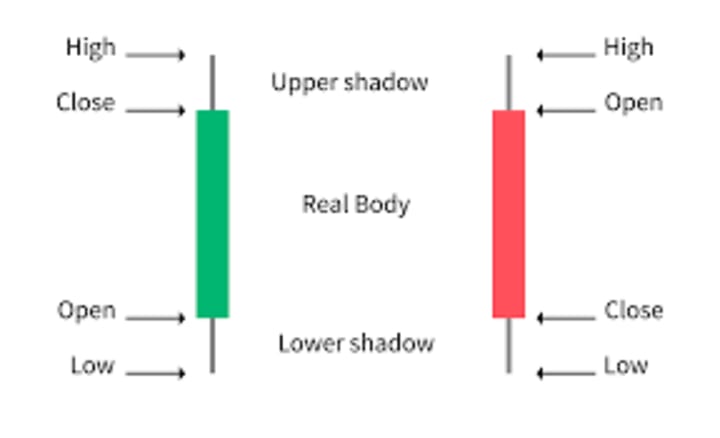
Candlestick charts: Candlestick charts are a type of chart that shows the price movements of an asset over a given period of time. Each candlestick represents a specific time period, and the body of the candlestick represents the opening and closing prices, while the wicks or shadows represent the high and low prices.
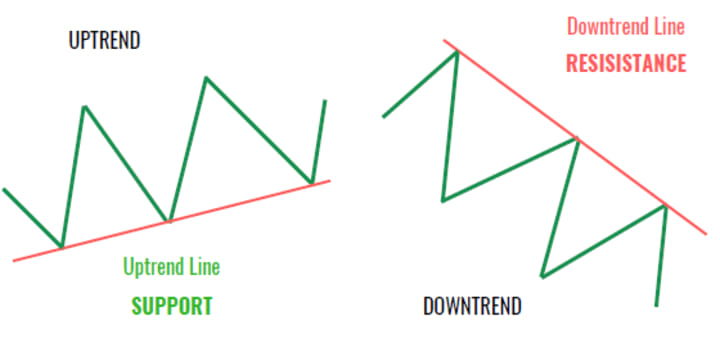
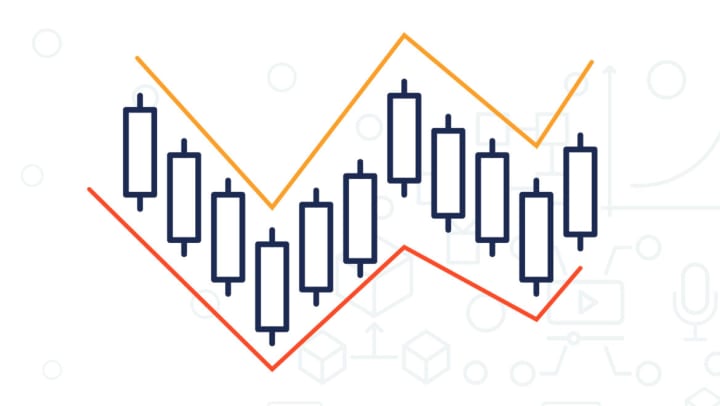
Trend lines: Trend lines are used to identify the direction of a market trend. A trend line is drawn by connecting two or more price points on a chart, and is used to identify areas of support and resistance.
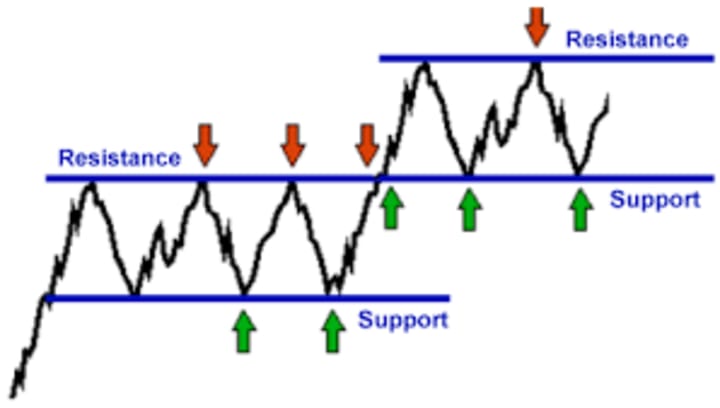
Support and resistance levels: Support and resistance levels are areas on a chart where the price has historically had trouble moving past. Support levels are areas where the price has historically tended to bounce back up after a decline, while resistance levels are areas where the price has historically tended to stall or reverse after an uptrend.
These are just a few of the most common technical analysis tools used by traders. Other tools and techniques include moving averages, technical indicators, and chart patterns. By using these tools and techniques, traders can identify trends, manage risk, and make more informed investment decisions.
- Also Read: 5 Things to Consider Before Investing in Cryptocurrency
- Also Read: The Beginner's Guide to Understanding NFTs
- Also Read: Honeygain Review: Passive Income Made Easy
III. Bullish Chart Patterns
A. Definition of bullish chart patterns
Bullish chart patterns are patterns that appear on price charts of financial assets and indicate a potential uptrend or price increase. These patterns are formed by a series of price movements that suggest the market is experiencing an increase in demand for the asset.
Traders use bullish chart patterns to identify potential buying opportunities in the market. By recognizing these patterns, traders can make more informed investment decisions and increase their chances of profiting from the market.
There are several different types of bullish chart patterns, each with their own unique characteristics and implications for the market. Some common bullish chart patterns include the cup and handle pattern, the double bottom, and the inverse head and shoulders pattern.
While bullish chart patterns can be a useful tool for traders, it's important to remember that they are not foolproof. The market is inherently unpredictable, and even the most reliable chart patterns can sometimes fail to produce the expected results. Traders should always use caution and sound risk management techniques when making investment decisions based on bullish chart patterns.
Join TradingView today for the ultimate trading experience!
B. Explanation of how they signal an uptrend
Bullish chart patterns signal an uptrend in the market by providing traders with a visual representation of market sentiment. These patterns are formed when prices rise over a period of time, indicating an increase in demand for the asset.
Traders use bullish chart patterns to identify potential buying opportunities in the market. For example, the cup and handle pattern is formed when an asset's price falls into a "U" shape, consolidates, and then rises again. This pattern suggests that demand for the asset is increasing and that a further rise in price is likely.
Similarly, the double bottom pattern is formed when an asset's price falls to a certain level twice before bouncing back up. This pattern indicates that the support level is strong and that a reversal is likely, signaling an uptrend.
Bullish chart patterns are not infallible, and there are always risks associated with trading. However, by recognizing these patterns, traders can gain insights into market sentiment and make more informed investment decisions. By understanding how bullish chart patterns signal an uptrend, traders can improve their chances of profiting from the market.
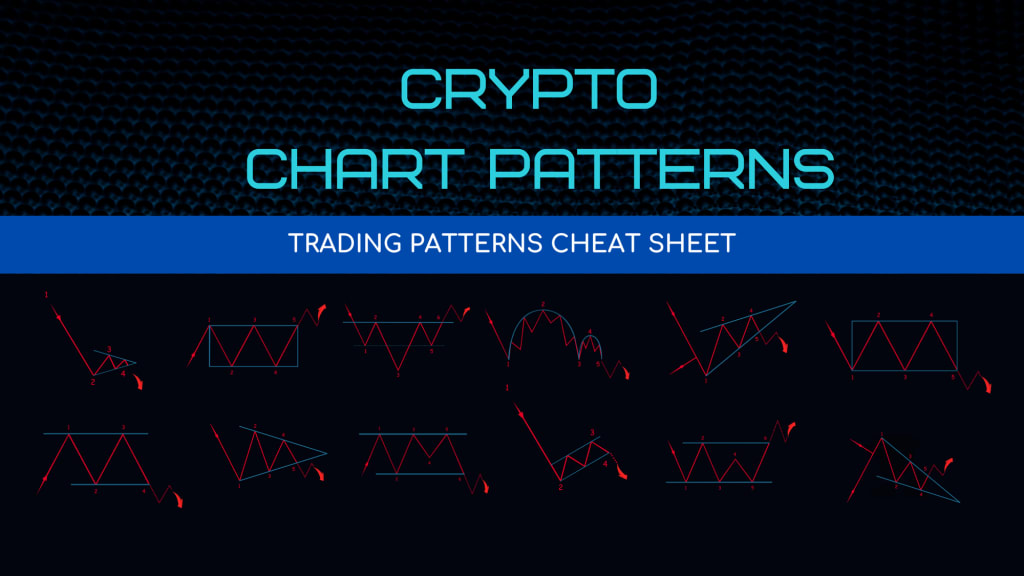
C. Common bullish chart patterns
There are several common bullish chart patterns that traders use to identify potential buying opportunities in the market. Here are a few examples:
Double Bottom - This pattern occurs when an asset's price falls to a certain level twice before bouncing back up. The double bottom pattern indicates that the support level is strong and that a reversal is likely, signaling an uptrend.
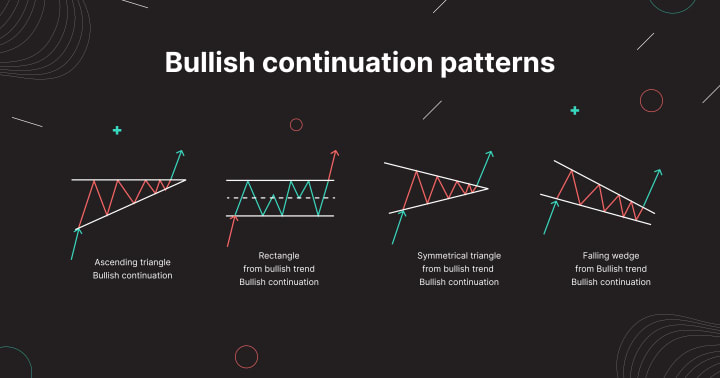
Ascending Triangle - This pattern is formed when an asset's price makes a series of higher lows and a horizontal resistance line is drawn across the highs. This pattern indicates that buyers are becoming more aggressive and that a breakout above the resistance level is likely, signaling an uptrend.
Cup and Handle - This pattern is formed when an asset's price falls into a "U" shape, consolidates, and then rises again. This pattern suggests that demand for the asset is increasing and that a further rise in price is likely.
Inverse Head and Shoulders - This pattern is formed when an asset's price falls to a low, bounces back up, falls again to a lower low, bounces up again, and then falls to a higher low. This pattern indicates that buyers are gaining control and that a breakout above the neckline is likely, signaling an uptrend.
These are just a few examples of bullish chart patterns that traders use to identify potential buying opportunities in the market. By recognizing these patterns, traders can make more informed investment decisions and increase their chances of profiting from the market.
Join TradingView today for the ultimate trading experience!
IV. Bearish Chart Patterns
A. Definition of bearish chart patterns
Bearish chart patterns are technical indicators that signal a potential downtrend in an asset's price. These patterns are formed on price charts and are used by traders to identify potential selling opportunities. Bearish chart patterns are typically characterized by a series of lower highs and lower lows, indicating that sellers are gaining control and that the asset's price may be poised to fall.
Bearish chart patterns come in many forms, but some of the most common ones include the double top, descending triangle, head and shoulders, and falling wedge patterns. Each of these patterns has its own specific characteristics that traders look for in order to identify potential selling opportunities.
By using bearish chart patterns in their technical analysis, traders can make more informed investment decisions and increase their chances of profiting from the market. Understanding how these patterns work and how to identify them can be an important part of any trader's strategy.
B. Explanation of how they signal a downtrend
Bearish chart patterns signal a potential downtrend in an asset's price by showing a series of lower highs and lower lows on the price chart. This pattern indicates that sellers are becoming more aggressive, and buyers are losing control. As a result, the price of the asset may start to fall.
When traders identify a bearish chart pattern, they look for confirmation that the downtrend is likely to continue. This confirmation may come in the form of a breakout below a key support level, a drop in trading volume, or a move below a moving average.
Traders may use a variety of technical indicators to confirm the bearish chart pattern and make informed trading decisions. For example, they may use the Relative Strength Index (RSI) to gauge whether the asset is oversold and due for a rebound, or they may use the Moving Average Convergence Divergence (MACD) to identify potential momentum shifts in the market.
By understanding how bearish chart patterns signal a potential downtrend and using technical analysis to confirm their predictions, traders can make more informed investment decisions and increase their chances of profiting from the market.
C. Common bearish chart patterns
Bearish chart patterns are important technical indicators that can help traders identify potential selling opportunities in the market. Some of the most common bearish chart patterns include:
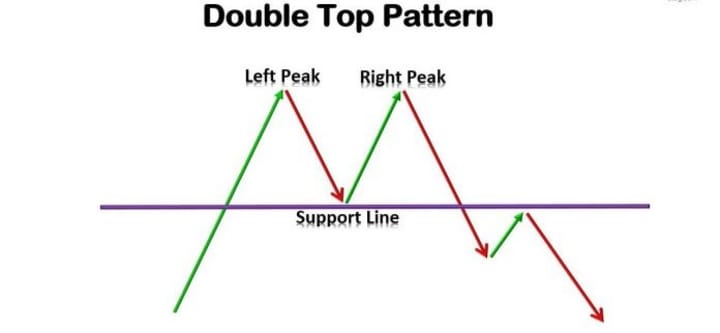
Double Top: This pattern occurs when an asset's price reaches a high point twice and fails to break through, indicating that there is resistance at that level. Traders may see this as a signal that the asset's price is likely to fall.
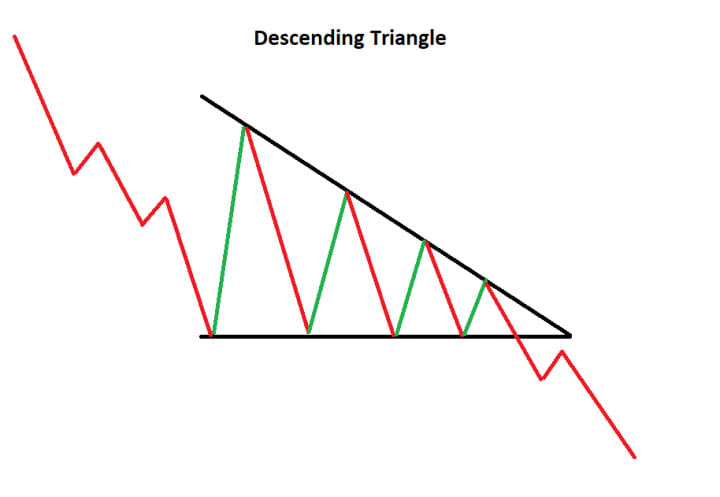
Descending Triangle: This pattern is characterized by a series of lower highs and a horizontal support line. When the asset's price breaks below the support line, it may signal that the price is likely to fall further.
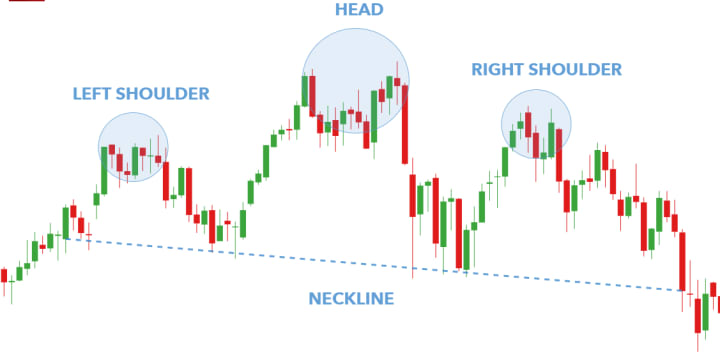
Head and Shoulders: This pattern is characterized by a peak (the "head") surrounded by two smaller peaks (the "shoulders"). When the asset's price breaks below the "neckline" (the line connecting the two troughs between the shoulders and the head), it may signal that the price is likely to fall further.
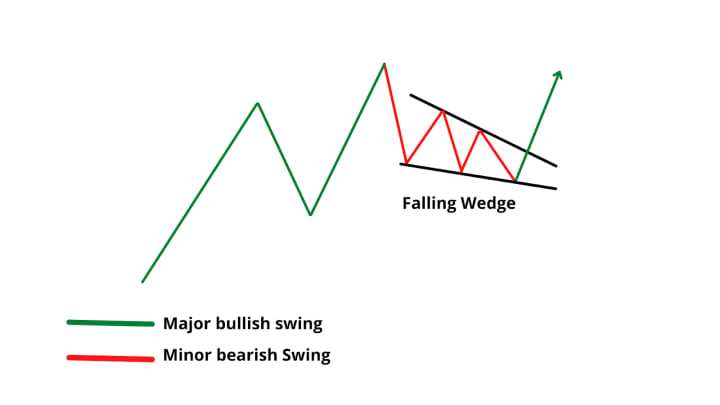
Falling Wedge: This pattern is characterized by a series of lower highs and lower lows that form a downward-sloping wedge shape. When the asset's price breaks above the upper trendline of the wedge, it may signal that the price is likely to rise, but if it breaks below the lower trendline, it may signal that the price is likely to fall further.
By understanding these common bearish chart patterns and using technical analysis to identify them, traders can make more informed investment decisions and potentially profit from the market. However, it's important to remember that no trading strategy is foolproof, and traders should always exercise caution and carefully manage their risk.
V. Indecision Chart Patterns
A. Definition of indecision chart patterns
Indecision chart patterns are technical indicators in the field of chart analysis that represent a time period when neither the buyers nor the sellers have control of the market. During this time, the price of an asset remains relatively stable, with small price fluctuations. These patterns are characterized by a period of consolidation, where the market is waiting for new information to emerge before making a significant move.
Indecision chart patterns can be helpful for traders because they signal an upcoming breakout, which could lead to a significant price movement in one direction or the other. However, it's essential to exercise caution when using these patterns, as false signals are common, and trading without proper risk management could result in significant losses.
There are several different types of indecision chart patterns, including Doji, Spinning Top, and Inside Bars. Each of these patterns signals a different level of indecision in the market, and traders can use them to make more informed trading decisions.
By understanding the definition of indecision chart patterns and how they work, traders can potentially use them to their advantage and increase their chances of making successful trades. However, as with any trading strategy, it's important to remember that there are risks involved, and traders should always do their research and carefully manage their risk.
B. Explanation of how they signal a potential reversal
Indecision chart patterns can also signal a potential reversal in the market, which can be useful for traders looking to take advantage of changing market conditions. When an indecision pattern occurs after a significant trend, it could indicate that the market is losing momentum, and a reversal may be on the horizon.
For example, a Doji candlestick pattern, which is a type of indecision pattern, occurs when the opening and closing prices of an asset are almost identical, creating a small or nonexistent body with long upper and lower shadows. If a Doji pattern appears after a prolonged uptrend, it could signal that the buying pressure is weakening, and the market may be preparing to reverse its course.
Similarly, a Bearish Harami pattern, which is an inside bar pattern, occurs when a small candlestick is followed by a larger one that is completely inside the range of the previous candlestick. If this pattern occurs after an extended uptrend, it could indicate that the buying momentum is fading, and the market may be ready to reverse its course.
Indecision chart patterns can be powerful indicators of market sentiment and can provide valuable information to traders looking to make informed trading decisions. However, it's important to remember that these patterns are not foolproof and should be used in conjunction with other technical analysis tools and risk management strategies. By combining these techniques, traders can potentially increase their chances of success and minimize their risks.
Join TradingView today for the ultimate trading experience!
C. Common indecision chart patterns
Indecision chart patterns are an important tool for traders to identify potential market reversals. Here are two of the most common indecision chart patterns:
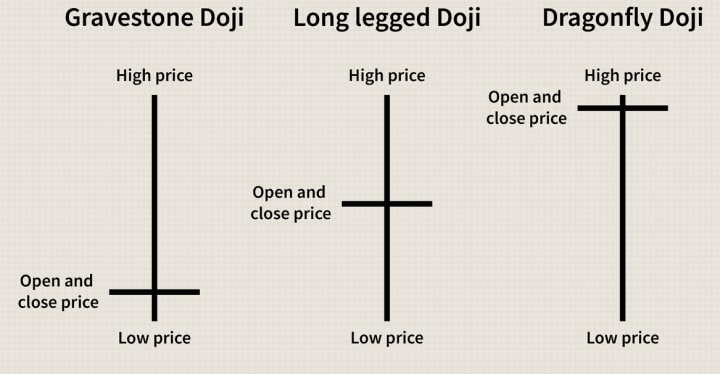
Doji: A Doji candlestick pattern is formed when the opening and closing prices of an asset are almost identical, creating a small or nonexistent body with long upper and lower shadows. This pattern often occurs after a prolonged uptrend or downtrend, and it can signal that the market is losing momentum and may be preparing to reverse its course.
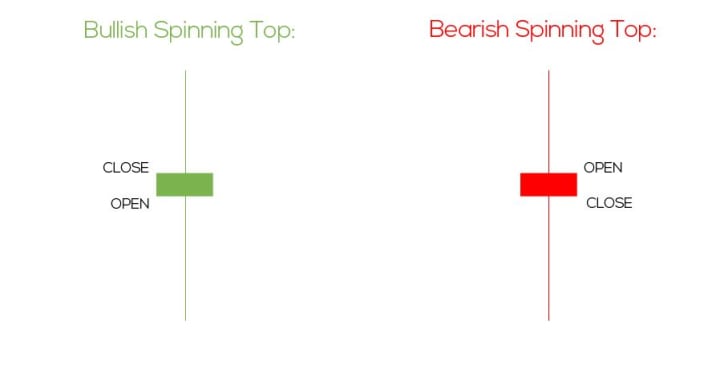
Spinning Top: A Spinning Top candlestick pattern is formed when the opening and closing prices of an asset are close to each other, and the candlestick has a small body with upper and lower shadows of equal length. This pattern is similar to the Doji, but the body is larger, indicating a higher level of indecision in the market. Like the Doji, this pattern can also signal a potential reversal in the market.
It's important to note that these indecision chart patterns should not be relied upon solely to make trading decisions. Instead, they should be used in conjunction with other technical analysis tools and risk management strategies to maximize the chances of success and minimize risks. With practice and experience, traders can use these patterns to their advantage and make more informed trading decisions.
VI. Combining Chart Patterns with Other Technical Indicators
While chart patterns can provide valuable insights into market trends and potential reversals, they should not be used in isolation. By combining chart patterns with other technical indicators, traders can gain a more comprehensive understanding of market conditions and make more informed trading decisions.
Here are some common technical indicators that can be used in combination with chart patterns:
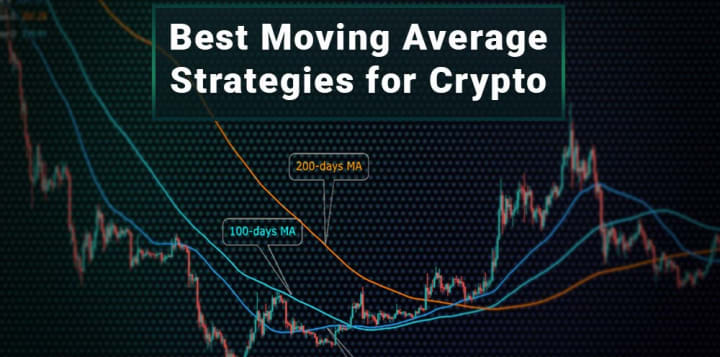
Moving Averages: Moving averages are a widely used technical indicator that can help traders identify trends and confirm chart patterns. By calculating the average price of an asset over a certain period of time, moving averages can provide a smoother and more reliable signal of trend direction.
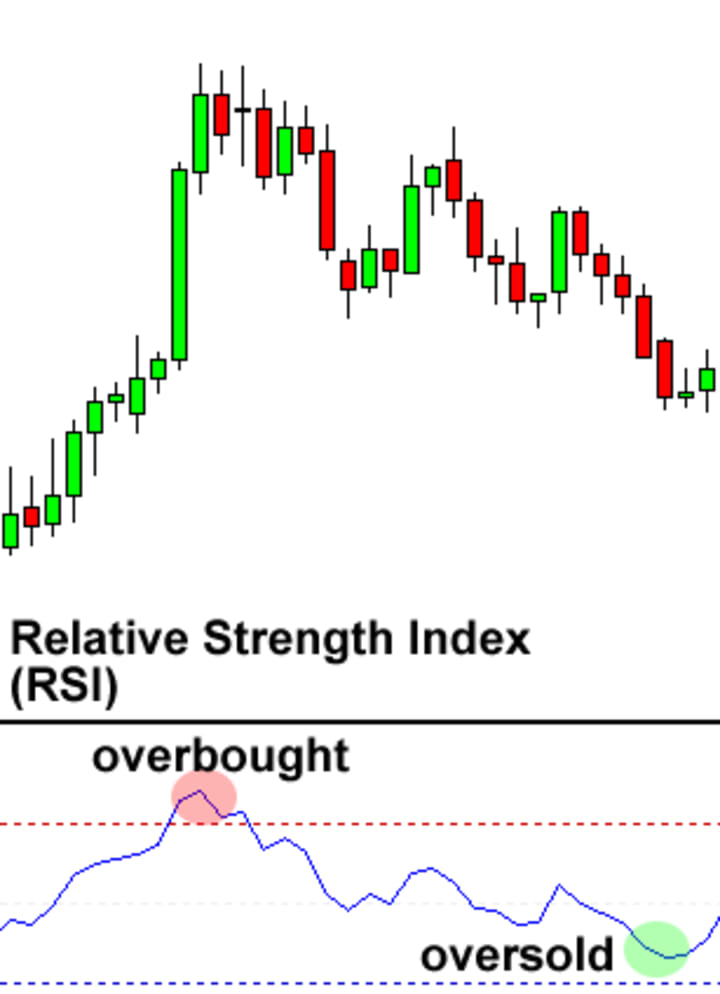
Relative Strength Index (RSI): The RSI is a momentum oscillator that measures the strength of price movements. It can help traders identify overbought and oversold conditions, as well as potential divergences that may signal a reversal.
Bollinger Bands: Bollinger Bands are a volatility indicator that can help traders identify potential breakouts and trend reversals. By measuring the standard deviation of an asset's price relative to a moving average, Bollinger Bands can provide a sense of how much the price is likely to fluctuate in the near term.
By combining chart patterns with these and other technical indicators, traders can gain a more nuanced understanding of market conditions and make more informed trading decisions. However, it's important to remember that no indicator or combination of indicators can provide a foolproof trading strategy. Successful trading requires a combination of technical analysis, risk management, and discipline.
A. Explanation of how to use chart patterns in conjunction with other technical indicators
When analyzing charts, traders can combine chart patterns with other technical indicators to make more informed trading decisions. For example, traders may use moving averages to identify trends, or use the Relative Strength Index (RSI) to identify overbought or oversold conditions. By incorporating these technical indicators alongside chart patterns, traders can gain a more comprehensive understanding of the market and potentially increase their chances of making profitable trades. This section will provide a brief overview of some common technical indicators that traders can use in conjunction with chart patterns.
B. Benefits and drawbacks of this approach
Combining chart patterns with other technical indicators can have both benefits and drawbacks. On the one hand, using multiple indicators can provide traders with more information and increase the likelihood of accurate predictions. For example, if a trader sees a bullish chart pattern and also sees that the RSI is indicating oversold conditions, they may be more confident in their decision to buy.
On the other hand, using too many indicators can lead to analysis paralysis, where traders become overwhelmed by conflicting signals and have trouble making a decision. Additionally, relying too heavily on technical indicators can cause traders to miss important fundamental factors that may impact the market.
Ultimately, the key is to strike a balance between using technical analysis and paying attention to broader market trends and news. By using chart patterns and technical indicators as part of a broader trading strategy, traders can potentially improve their results and minimize their risks.
VII. Putting it All Together
Putting it all together involves taking everything you've learned about crypto trading chart patterns and applying it to real-world trading scenarios. This means identifying patterns in the market, using technical indicators to confirm your analysis, and making informed trading decisions based on this information.
To do this successfully, traders need to have a deep understanding of the different types of chart patterns, how they signal market movements, and how to use them in combination with other technical indicators. They also need to stay up-to-date on market news and events that may impact their trading decisions.
One effective strategy for putting everything together is to start by identifying long-term trends in the market, using chart patterns to confirm these trends, and then using technical indicators to identify entry and exit points. By taking a systematic approach to trading and staying disciplined in your strategy, you can potentially improve your results and minimize your risks over time.
Ultimately, successful trading requires a combination of technical skill, market knowledge, and discipline. By mastering the basics of crypto trading chart patterns and incorporating them into your trading strategy, you can potentially increase your chances of success and achieve your financial goals.
A. Example of how to use chart patterns to make a trading decision
In this section, we will walk through an example of how to use chart patterns to make a trading decision. Let's say you are interested in trading Bitcoin and you notice a double bottom pattern forming on the daily chart. This is a bullish pattern that can signal a potential trend reversal.
To confirm the pattern, you look at the trading volume to make sure it is increasing as the pattern forms. You also check the Relative Strength Index (RSI) to see if it is oversold or neutral. If the RSI is oversold or neutral and the volume is increasing, it can add confirmation to the double bottom pattern.
Based on these factors, you decide to go long on Bitcoin with a stop-loss order just below the double bottom pattern. You also set a take-profit order at a key resistance level.
It's important to note that trading decisions should not be based solely on chart patterns, but should be combined with other technical indicators and fundamental analysis for a more comprehensive approach.
B. Explanation of why it's important to consider other factors (e.g. market trends, news events)
In making any trading decision, it's crucial to consider multiple factors in addition to chart patterns. For instance, economic and political events can significantly impact the performance of cryptocurrencies. News about new regulations, technological advancements, or even natural disasters can affect the value of a cryptocurrency.
Furthermore, it's essential to have a solid understanding of the market conditions before making any trade. Factors such as market volatility, liquidity, and trading volume can all impact the price of cryptocurrencies.
Therefore, while chart patterns can be a useful tool in making trading decisions, they should not be the sole factor in your decision-making process. A holistic approach that considers various technical and fundamental factors will help you make better trading decisions.
VIII. Conclusion
In conclusion, understanding crypto trading chart patterns is a crucial aspect of technical analysis and can provide valuable insights into the market trends. By identifying these patterns, traders can make informed trading decisions and improve their chances of success.
Bullish, bearish, and indecision chart patterns are the most commonly used patterns in crypto trading, and traders should be familiar with them to navigate the market successfully. However, it's also essential to combine chart patterns with other technical indicators and consider other factors before making a trade.
With a solid understanding of chart patterns and other critical trading concepts, beginners can enter the crypto trading world with confidence and make informed trading decisions. It's also essential to remember that successful trading requires discipline, patience, and ongoing learning. By continuously improving their knowledge and skills, traders can stay ahead of the curve and succeed in this dynamic and exciting market.
A. Final thoughts and encouragement for beginners to continue learning about technical analysis
In conclusion, understanding crypto trading chart patterns is crucial for beginners who want to be successful in the market. Technical analysis is a powerful tool that can help traders identify trends and make informed decisions. By learning about bullish, bearish, and indecision chart patterns, as well as how to combine them with other technical indicators, traders can gain a deeper understanding of the market and potentially increase their profitability. It's important to remember, however, that chart patterns should not be relied upon solely when making trading decisions, as other factors such as news events and market sentiment can also have a significant impact.
To recap, in this article we covered the basics of technical analysis, including candlestick charts, trend lines, and support and resistance levels. We also explained the three main types of chart patterns and provided examples of each. Additionally, we discussed how to use chart patterns in conjunction with other technical indicators and the benefits and drawbacks of this approach. Finally, we gave an example of how to use chart patterns to make a trading decision and emphasized the importance of considering other factors.
As a beginner, it can be overwhelming to learn about technical analysis and chart patterns, but don't be discouraged. It takes time and practice to become proficient in this field, but the effort is worth it. With patience and dedication, you can become a successful trader. Keep learning, stay curious, and don't be afraid to experiment with different strategies. Good luck on your trading journey!
About the Creator
TeckyBlock
Learn about blockchain technology, cryptocurrency, NFT and metaverse in here. please visit https://teckyblock.com for further information.
Keep reading
More stories from TeckyBlock and writers in Trader and other communities.
Power of Gunbot: The Ultimate Guide to Creating Trading Bots and Automated Trading Strategies
Introduction In the ever-evolving world of cryptocurrency trading, staying ahead of the competition and maximizing profits require innovative approaches. Gunbot, a revolutionary trading bot platform, offers a solution that empowers traders to create their own trading bots and harness the power of automated trading strategies. In this ultimate guide, we will explore the remarkable features, benefits, and ease of use of Gunbot, providing you with the knowledge and insights to enhance your trading success.
By TeckyBlock10 months ago in Trader
"Stride in Style: Discover the ALDO Men's Albeck Oxford"
In the realm of men's footwear, finding the perfect balance between style, comfort, and versatility can often feel like an elusive quest. Yet, amidst the sea of options, there emerges a beacon of excellence that embodies these qualities seamless: the ALDO Men's Albeck Oxford. As a distinguished member of ALDO's esteemed lineup, the Albeck Oxford stands as a testament to the brand's commitment to crafting footwear that not only exudes sophistication but also delivers unparalleled comfort and durability.
By Kim Long Nguyệt Ngữ4 days ago in Trader
2023 Fashion Designer Shoes Men Casual Platform Sneakes Lace Up Trainers Student Sneakes Mens Vulcanized Shoes Zapatillas Hombre
In the ever-evolving world of fashion, footwear has become more than just a functional accessory; it's a statement of style, personality, and individuality. One of the most intriguing trends to emerge in recent years is the fusion of casual comfort with elevated design, epitomized by the rise of platform sneakers for men. These shoes seamlessly blend streetwear flair with high-fashion sensibilities, creating a versatile option that can effortlessly transition from day to night, casual to formal.
By Wedson Vegasa day ago in Trader


Comments
There are no comments for this story
Be the first to respond and start the conversation.