
The 6,566-Tweet Blueprint: How Serenity Turns AI Hype Into Supply Chain Hypotheses
A deep dive into one investor’s posts reveals a repeatable method for finding bottlenecks, timing entries, and avoiding the trap of copying trades without the research.
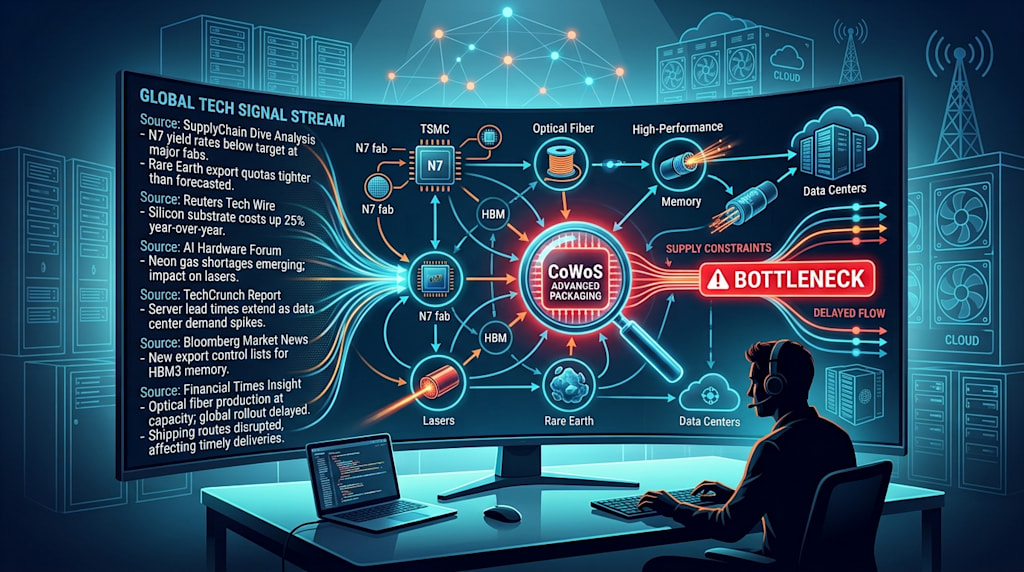
From Tweets to Supply Chains: How Serenity Turns AI Industry Changes into Investigable Hypotheses
This article is not about which stocks Serenity recommended. Using a snapshot of 6,566 tweets as a sample, stripping away market cheers, social jokes, and short-term trades, a recurring path emerges underneath. Start from end-demand capital expenditure. Trace upward along architectural changes. Find nodes where qualified supply is constrained, qualification cycles are long, and the incremental value is large enough. Then use revenue-conversion timing and financing structure to judge whether that value belongs to existing shareholders.
This article reconstructs that path.
1. Don't Rush to Call Him a "Bottleneck Master"
The most accurate summary: thematic investing anchored on AI capital expenditure as demand, using industry architecture as a map, certified scarce supply as a filter, and revenue-conversion timing plus financing structure as the valuation interface. On December 30, 2025, he laid out the path himself. Compute-service providers buy compute chips. Chips are made by TSMC. Cluster expansion requires optical interconnect. Optical interconnect traces back to AXT's materials.
He does not stop at drawing the supply chain. He keeps asking: who controls existing supply, and can others replace it within the target time; has demand already entered contracts, qualification, or is it only at the demo stage; who funds the growth; and ultimately, does company revenue increase, or does per-share equity of existing shareholders also increase? Sivers' foundry allocation, IQE's debt restructuring, and his turn on IREN's equity issuance correspond to these three questions.
He cannot be packaged as a "bottleneck master" who was fixed and unchanging from day one. The early archive contains another distinct language: short squeezes, index inclusion, ETF launches, short-term rebounds, put sales, near-term price targets. On September 11, 2025, he said outright that many trades were not based on analysis but were "vibe trades." The five opportunities on September 12 included Hims & Hers' short covering, Litecoin's fund launch, Robinhood's index inclusion, and Nebius' contract value. The later bottleneck system cannot retroactively overwrite these early behaviors.
Nor does he avoid financial analysis. Of 721 non-reply long posts, 60.7% hit finance, financing, or valuation dictionaries, exceeding the 42.0% for supply-demand and pricing. He opposes using financial data from the wrong stage to measure a company, not financial data itself. For memory companies already generating operating profit, he looks at profit and market cap. For Sivers at the qualification stage, he looks at customer projects and capacity conversion. For POET, which has capacity but lacks customers, he looks at cash and the demand gap.
His most central unit of comparison is how large the future increment is relative to the company today. Nvidia is an important information gateway for him, but it need not be the highest-beta holding in every cycle. On August 27, 2026, he said Nvidia is already very large, and excess opportunities come more from how its architecture and capacity decisions affect other supply-chain companies. The Raspberry Pi case in February follows the same logic. It is not that a small device outperforms Apple, but that the same incremental dollar from a new use case may be economically far more meaningful to a small company.
His research goal is not merely to find the correct trend. It is to find a position that the trend must pass through, where supply is constrained, where the increment is large enough, and where the current price has not fully explained it. On August 16, 2026, he gave his own path: know that co-packaged optics will develop, see that Nvidia has locked up continuous-wave laser capacity, list the remaining suppliers, then choose Sivers, which he believes has the highest elasticity. That passage is almost a minimum executable version.
What is worth copying is the investigative procedure. What cannot be directly copied is position implementation. His research can produce very specific, testable outputs: changes in customer website lists, mass-production windows in partner earnings, an existing foundry allocation at a company, output per wafer, raw-material price pass-through, and the number of shares needed for financing. At the same time, he has publicly admitted that extreme concentration and margin financing amplify drawdowns. Treating "the industry judgment is correct" and "any position can withstand it" as the same thing does not match this archive. On July 18, 2026, he self-reported a 49.4% drawdown for the month. On August 15, he mentioned a drawdown of about 77.8% from the peak.
2. Attention Statistics: What Is He Actually Researching in Public?
Tweets cannot directly reconstruct how many hours a person spent researching. A field visit may leave only two sentences. A market move may generate dozens of replies. So "attention allocation" must first be operationalized into three observable indicators: the share of posts by primary function, the share of body-text characters, and the coverage rate of a given research signal in the full text. Only the first mutually exclusive classification can sum to 100%. Industry and signal categories may overlap.
The uploaded snapshot has 6,566 unique post IDs. After excluding 1 pure repost, the content-statistics population is 6,565. Of these, replies or reply-style text number 3,475, or 52.9%. Non-reply long posts with at least 600 non-whitespace characters after cleaning number 721. The semantic sample draws 40 posts from each of six periods, 240 total, then reweights by each period's actual post volume. Full structured scanning, 240 stratified semantic codes, and targeted close reading of cases are the three reading scales. Keyword scanning is not described as line-by-line close reading.
Based on the mutually exclusive primary-function coding of the 240 stratified sample, supply-chain mapping and competitive positioning is about 13.9%. Supply-demand, capacity, and pricing is about 6.6%. Finance, financing, and valuation is about 10.6%. Event tracking and evidence updates is about 9.1%. Research method, retrospective, and error correction is about 8.4%. These five research-type categories total about 48.5%. The remainder is mainly positions, trading, and return disclosure at about 17.8%; price, macro, and market narrative at about 14.4%; and social, jokes, and low-information replies at about 19.3%.
When converted to visible body-text characters, supply-chain mapping is about 17.0%. Supply-demand is about 14.2%. Finance and valuation is about 17.7%. The five research-type categories total about 64.8%, while social low-information is only about 7.1%. Research posts are longer. A one-line reply and a long analysis each count once in post counts, but not in textual space. Half the posts are not research. Most textual space is used for research. Both statements hold.
Full-sample signals also show that finance has not been excluded by the technology narrative. Of all 6,565 posts, finance, financing, and valuation hit 1,496, or 22.8%. Of the 721 long posts, 438 hit, or 60.7%. Supply-demand and pricing was 13.8% overall and 42.0% in long posts. Supply chain and customer relationships was 13.3% overall and 40.8% in long posts. Mass production and qualification timing was 9.2% overall and 31.6% in long posts. The most explanatory combination is not "bottleneck" appearing alone. It is the same batch of long posts frequently containing supply relationships, mass-production qualification, pricing, valuation, and financing at the same time.
On the industry map, by full-sample dictionary, optical interconnect and photonics covers 2,043 posts, or 31.1%. Chips, foundry, and advanced packaging covers 21.1%. Compute services and cloud covers 15.1%. Memory covers 10.2%. These are not four independent portfolios. A post about Nvidia, Sivers, and a foundry can fall into two or three themes at once.
Time variation matters more than overall ranking. The compute-services theme covered about 64.0% of that month's posts in November 2025. Photonics was zero that month, rose to about 27.6% in December, about 42.2% in March 2026, and about 52.7% in May. Memory was about 21.8% in February 2026 and rebounded to about 19.3% in August. This matches the action timeline in the original posts. First concentrate on Nebius. Then research upstream names such as AXT. Then expand into the photonics architecture switch. In August, from already-revalued memory leaders, he traced further into older memory products.
The most frequently mentioned tickers are Sivers, Nebius, Lumentum, AXT, and Applied Optoelectronics. But this chart must never be read as position weights. IREN appears 418 times, and much of the later discussion was precisely criticism of its financing. POET was simultaneously an object of doubt, a supply-chain clue, and later a small exploratory position. The more a person talks about something, the more it may be because he likes it, or because it is controversial. Less mention does not equal selling. On August 13, he said the main logic of IQE and AXT had been validated, so he reduced coverage, but still held and waited for operating growth. Distinguishing a shift in research interest from entering a holding phase requires specific position disclosures.
3. Six Stages of Evolution: Not a Post-Hoc Winner List
1. July–September 2025: Event Trading and Growth-Stock Comparison Coexist
The earliest Upwork content mixed positions with anime-style chart jokes. In September of that year, short-term rebounds, short covering, listings, and index fund flows occupied a prominent place. On September 27, he listed short-term trades such as Gemini, Figma, Rocket Lab, and Klarna, admitting some were just swings, while Nebius was placed in a longer fundamental framework. Even early on, one should distinguish what he is trading from what he invests in with the most conviction.
By September 20, the systematic case for Nebius appeared. The Microsoft contract, financing, revenue growth, affiliate assets, and valuation relative to CoreWeave together formed the rationale. On September 23, he explicitly stated that he established the position after the Microsoft deal, rather than claiming he had foreseen everything at the earliest stage. The same day, he said he sold TSMC call options, trimmed some small caps, and rotated into Nebius stock and short-term options. Research conviction and trade implementation were already combined, but not on the same time scale.
2. October–November 2025: Compute-Service Concentration, While Screening Business Models
On October 25, he disclosed selling several miner-turned-compute companies and increasing concentrated exposure to Nebius. On November 1, he placed software, customer relationships, and margins above merely owning power capacity. His unit of comparison gradually shifted from who can win a big contract to who can own a more complete, higher-value-added compute-service business. But this was not a one-way liquidation. After the market fell on November 13, he disclosed buying back IREN and Cipher and continuing to add to Nebius. Writing his history as "after discovering the best company, he never traded peers again" would miss this explicit buyback.
3. December 2025: From Compute End-Demand Backward to Materials
On December 22, he was already discussing AXT. On December 26, he connected concentrated material supply, next-generation computing architecture demand, and his own positions. On December 29, he went further upstream with "bottlenecks within bottlenecks" to discuss raw materials. By December 30, he clearly wrote out the research path from compute services to chips, manufacturing, interconnect, and materials. The key change here is not a sudden preference for small caps. It is the beginning of a search for upstream nodes that end-demand budgets must pass through but the market has not fully understood.
4. January–February 2026: Memory, Overseas Supply Chains, and "Assets Repurposed"
On January 26, his overseas list already included Nittobo, Unimicron, Samsung, SK Hynix, Kioxia, and Nanya. He explained why he would go outside the U.S. market for certain critical or near-monopoly positions. The February Korea market research extended further into fund constituents, cross-shareholdings, and option volatility. IQE at the same time was another kind of opportunity: an old business depressed valuation, while existing equipment could potentially be redirected to photonics demand. The research object expanded from a single stock to capacity, ownership, securities packaging, and market accessibility.
5. March–May 2026: The Photonics Architecture Switch Becomes Central
Co-packaged optics brings optical connections closer to compute or switch chips. It was the architectural change he repeatedly focused on in this stage. On March 11, after earlier hesitation, he established a Soitec position. On March 16, he published the Sivers entry thesis. In April and May, his expression increasingly emphasized qualification stages, specific product designs, foundry allocations, and customer projects that would ramp years later, not merely current shortages.
He also began to distinguish clearly between bottlenecks and control points. On April 22, he considered AXT and Sandisk closer to bottlenecks, while glass substrates and distributed-feedback lasers embodied control points in a multi-year architecture switch. On May 24, he described Sivers as a control point and partly also a bottleneck. The terminology was not a permanently fixed classification table. It was a combination that changed with two constraints: technical substitutability and capacity allocation.
6. June–September 2026: Waiting for Fulfillment, Experiencing Drawdowns, Continuing to Trace Down Another Layer
Much of this stage was monitoring already-established themes rather than constantly switching to new tracks. The public drawdown in July led to discussions of margin, deleveraging, and liquidity. At the same time, he continued to distinguish supplier earnings, customer qualification, mass-production delays, and financing arrangements. The August 27 position review gave a clear reallocation. Previously heavily exposed to multiple memory names, he then trimmed some already-revalued names, retained long-term exposure to Samsung and SK Hynix, and increased photonics. The latest memory interest shifted to older products such as DDR2 and DDR3.
4. The Internal Structure of the System: Physics, Capital, and Time
1. Physical Dependency Map: From "Who Is Most Famous" to "Without Whom It Cannot Be Done"
A control point does not mean a company is the world's only supplier under all conditions. According to his expression on Sivers, it is first a dependency position within a specific customer product and specific architecture. A certain laser design has been adopted. Replacing it requires redesign, requalification, or reordering the roadmap. Compared with the comparison that all lasers are interchangeable, he focuses on whether a product can truly be substituted in the same system, not which power number is larger on a spec sheet.
This can be understood with a network diagram. End projects A, B, and C respectively pass through optical modules or optical engines, enter a photonics foundry platform, and then converge on a matched-architecture laser design, a certified foundry allocation, and substrate and epitaxy materials. But "cut point" is only a metaphor, not a mathematical proof the author ever gave. An upstream supplier may simultaneously connect to multiple optical-engine companies, and through them enter different cloud-provider projects. Even without knowing which system vendor ultimately wins, the upstream may benefit from multiple routes. Conversely, a single clue only proves cooperation, not automatically that all orders pass through that supplier. On August 30, his Sivers list already distinguished confirmed, likely, and potential, showing that these edges have different evidence strengths.
The research focus is not drawing all the lines. It is asking edge by edge: who confirmed each edge? Can it be replaced? How long would replacement take?
2. Bottleneck Map: Not Just Who Has a Factory, but Who Controls Sellable Output
Factory ownership and control over sellable output are not the same thing. On May 24, he used the relationship between Sivers and Win Semiconductors to explain. Win is the physical bottleneck for manufacturing expansion. But if Sivers has locked up future allocations, other customers are competing for Sivers' sellable finished lasers. Sivers is then in a position of scarce allocation. He used Sandisk and Kioxia as an analogy to emphasize allocation rights, not to say that fabless companies have no supply constraints.
This distinction also explains why he focuses on "merchant," which means supply sold externally rather than used internally. On August 13, when reading Coherent's earnings, the first thing he extracted was not whether revenue beat expectations. It was that the company said laser output would be consumed by its own optical-module business and would not be sold externally in the near term. Even if total industry capacity increases, the capacity available for independent downstream customers to purchase may decrease. An independent supplier not absorbed by internal business may be more valuable.
3. Capital Map: Real Demand and Common-Shareholder Benefit Are Two Questions
Among compute-service providers, he repeatedly distinguishes customer credit, prepayments, debt interest, equity issuance, and management stock-based compensation. In December 2025, he separated Oracle's customer-credit problem from the payment sources of other compute-service providers. In March 2026, IREN's large at-the-market offering plan triggered his questioning of the original investment logic. In August, when looking at CoreWeave, he pointed out that high adjusted earnings did not eliminate the erosion of free cash flow by high interest expenses.
An at-the-market offering is a financing arrangement that sells new shares at market prices. Stock-based compensation is equity compensation granted to management or employees. Their difference from customer prepayments and debt financing is not a purely accounting detail in his framework. For the same unit of capacity expansion, the equity retained by existing shareholders may differ. "The compute shortage is real" cannot directly lead to "all compute companies expanding capacity are equally worth owning."
4. Time Map: Revenue Inflection Points Along the Same Supply Chain Are Not Synchronized
He repeatedly uses the sequence development, qualification, ramp. Customer sampling or technical contact cannot be treated as a mass-production purchase order already placed. Equipment and testing segments may recognize revenue before devices and complete systems. On July 30, he extracted from FormFactor's earnings that CPO testing business was growing and explained it as an earlier signal of mass-production preparation. In August, he again emphasized that some Sivers customers still needed to complete qualification and could not skip the process to sign multi-year supply contracts directly.
Market debates about a company must first align on time. Judging a project still in qualification in 2026 with 2024 sales to estimate future mass-production ceilings would be misaligned. Treating 2028 nominal capacity as revenue already realized in 2026 is equally misaligned. His updates on LPKF and X-FAB provide a reverse test. Technical exposure was confirmed, but that did not prevent mass-production timing from being later than previously expected.
5. Price and Valuation: The Core Debate Is Often How Long It Lasts, Not Just Next Quarter's Earnings
Average selling price is the average price per unit sold. Total addressable market is the demand space a product can cover. His valuation thinking often includes both increased volume and improved price and product mix. On AXT, he opposed treating the material market size at old prices as an eternal ceiling. In photonics, he looks at demand added by different generations and architectures. On ESMT, the real debate is how long unusually high monthly profit can last.
In financial modeling, numerator and denominator must be answered separately. The numerator of the P/E ratio is the equity market cap corresponding to all common shares. The denominator is annual net profit on the same shareholder basis. Gross profit, operating profit, and year-end revenue run rate are not that denominator. Later we will see that some of his tweets explicitly calculate market cap divided by gross profit, while an adjacent reply jumps to a forward P/E. One should not fabricate a missing intermediate step for him.
6. Verification Method: Not Waiting for Brokers to Change Price Targets, but Seeing Whether Adjacent Nodes Behave as Expected
His strongest verification is usually behavioral. Downstream customers actively reserve capacity. They pay prepayments. Suppliers refuse new customers. Externally sold capacity is diverted to internal use. Qualification timing becomes clear. Customer projects begin mass production. On August 25, when explaining the source of conviction on Sivers, he listed third-party behaviors such as changes in Ayar's website display, Jabil's products, and GlobalFoundries' reference designs. Institutions later expressing the same view can be additional confirmation, but should not replace these more specific pieces of evidence.
5. Real Cases: How This System Operates Step by Step
1. Nebius and IREN: From Customer Validation to Financing Constraints
The starting point is not that more power is better. It is that the Microsoft contract changed Nebius' verifiability. The long post on September 20, 2025 revolved around the Microsoft contract, financing ability, growth, and affiliate assets. On September 23, he admitted he established the position only after the contract appeared. This starting point shows that he does not require entering before all uncertainty is removed, and is willing to study whether the market underestimates remaining growth after a major event.
Subsequently, he gradually broke compute services into different economic layers: owning sites and power, providing hardware capacity, managing compute clusters, and providing customer-facing software services. These cannot be valued by the same capacity number alone. On November 1, he explained his preference for Nebius using software and margins. On December 1, after finding that the geographic and equipment-standardization assumptions in the Microsoft contract comparison were wrong, he publicly admitted mixing cost estimates and charts. Research is not only getting the direction right. It also includes correcting comparability assumptions.
March 2026's IREN is a reverse test of this method. What he originally liked was the path of infrastructure cash flow supporting compute-business expansion. A large equity issuance plan meant growth might continually ask shareholders for money. On March 6, he also said that if Nebius did the same proportional issuance, he would leave too. This cross-holding consistency reveals the rule better than which stock he later preferred. Business-model growth and post-financing ownership must both hold.
The August update on Nebius continued the same indicators: customer prepayment coverage, signed commitments, future capacity that can be sold, cash, and margins. Quarterly revenue alone was not enough. For IREN, the July 30 one-share support position should not be misread as restoring the previous level of high-conviction heavy weighting. He acknowledged the software acquisition and capacity location, but still criticized the issuance and management compensation.
The transferable investigative action: when studying similar companies, first fill in the table with contract payers, contract terms, prepayments, and capex responsibility. Then compare capacity. Afterward connect the entire funding need to share count, interest, and future per-share cash flow. Ending research merely because of one large contract or having many gigawatts of power would skip the part he later valued most.
2. AXT: Along the Laser Upward, to Materials, Then to Bargaining Power
AXT's ticker is AXTI. In his research it represents the indium phosphide substrate node, not the entire optical-module product. In December 2025, he pushed upward along large compute projects, optical interconnect, and laser manufacturers, arguing that qualified supply here was concentrated. On December 26, he disclosed a position. On December 27, he further linked the system shift toward optical connections and material supply.
His early thought experiment is distinctive. If a component with a small cost share can determine whether an expensive system ships, the buyer may not stop the entire product because of a price increase. The bill of materials records the materials and parts needed to build a final product. He cares not only about how expensive a raw material is in the BOM, but about how much downstream revenue would be blocked if it were missing. This is reasoning where willingness to pay is determined by avoiding a shutdown. The extreme price increase in the original post is a hypothesis, not a realized price path.
He did not stop after finding the substrate. On December 29, he continued discussing bottlenecks within bottlenecks. In April 2026, he linked high-purity red phosphorus to a Japanese chemical company. This one-more-jump-up research action is recursive investigation of whose supply is also constrained, not finding one more company with an AI label. Each layer up may find more concentrated supply, but may also encounter smaller economic value or stronger external constraints.
By July 2026, he began tracking Lumentum's capacity reservation payments, Coherent's agreements, and AXT's expansion targets. The July 31 earnings note separated quarterly revenue, InP revenue, and capacity revenue targets for the end of 2026 and 2027. It emphasized that customer demand still exceeded deliverable supply. This formed a validation chain from technical dependency to purchasing behavior to financial data.
The most critical endpoint was instead the reserved judgment on August 30. He said the bottleneck and control point had been proven, but he did not know the specific long-term contract pricing with Lumentum and Coherent. Further re-rating required stronger price increases. Indispensable and how much can be charged were separated by him. The next research question was no longer whether there is AI demand. It was, through contracts, who actually captures the scarcity.
3. IQE: Not Buying a Bottleneck Cheaply, but Unlocking Equipment Trapped by an Old Business and Debt
On December 30, 2025, he had been cautious on IQE, worried that in asset disposal creditors would be prioritized and common shareholders might not get a good outcome. The long post on February 27, 2026 shifted to a trapped asset release logic. The depressed wireless business and liquidity pressure suppressed the company's valuation, but whether existing epitaxy equipment could serve new photonics demand was worth recalculating. The shift occurred after he reconstructed asset use and financing path, not because the price was cheap itself.
His engineering entry point was very specific. He compared the number of IQE and LandMark reaction tools, tracked equipment that could be used for different compound semiconductor materials, and estimated conversion cost and time. Metal-organic chemical vapor deposition and molecular beam epitaxy are the manufacturing processes discussed. The original post argued IQE had relatively large-scale equipment, and some of it might be converted from gallium arsenide use to indium phosphide. Equipment counts, conversion costs, and competitor valuations are inputs the author used at the time, not asset appraisals re-verified in this report.
Only then did he ask the financial unlock conditions. Could the Taiwan business sale clear debt? How much cash remained? Was significant additional issuance still needed? The post listed different disposal-price scenarios and explicitly stated possible severe shareholder dilution. He already held before the restructuring was complete, so the case cannot be summarized as wait until risk is removed, then buy. More accurately, he believed the potential economic value of existing equipment, relative to the debt that might need to be handled, formed a restructuring option worth taking.
On August 13, when reviewing IQE, he focused on Macom's supply agreement and capital support, Tower Semiconductor's agreement, bank debt elimination, and new projects. He still listed the conversion of idle capacity to data centers as an unfulfilled step. Research must separately verify that assets have not disappeared, that the financing problem has eased, that equipment conversion succeeds, and that customer mass production is realized. The first success cannot substitute for the latter three.
This type of method suits companies with real production assets, identifiable new uses, and an investigable transaction structure. It does not suit simply ignoring the funding chain because replacement cost is high. On January 19, his own screening note reminded that many critical suppliers have very poor fundamentals, and one cannot blindly buy every bottleneck. Some bottlenecks are also too small economically. The IQE analysis is an expansion of that sentence.
4. Soitec: Controlling the Intellectual Property Structure and When the Stock Price Reflects It Are Two Separate Judgments
Soitec's core clue is silicon-on-insulator materials and silicon photonics technology. In early March, he had already identified this structural position, but still discussed the issue that CPO would ramp later. On March 6, he thought delayed CPO might benefit existing pluggable optical modules but would hurt Soitec's near-term catalysts. Only on March 11 did he explicitly change his mind and establish a larger position. Identification of the technical position came before determination of the investment timing.
What prompted the turn was not an isolated valuation multiple. It was the combination of a depressed old handset business, low valuation, exposure to a new architecture, and an upcoming Nvidia industry conference. He also distinguished between nominally multiple material suppliers and core processes controlled by the same licensor. Adding a second manufacturing source does not necessarily mean the technology rent is fully competed away. This should be understood as the author's judgment about the licensing structure, not as this report treating monopoly as a legal conclusion without boundaries.
On August 31, he used new capacity reservations, more customers, and photonics revenue floor language as an update. The continuity of the method lies in the questions. In March, asking why a company valued in an old cycle could own a new use. In August, asking whether the new use had already produced capacity reservation behavior. The former is a structural judgment. The latter is commercialization evidence. Price increases themselves should not replace the latter.
5. Sivers: The Most Complete Relationship, Allocation, Qualification, and Valuation Case Chain
Step one: admit he did not yet understand it, then build a specific product hypothesis. On December 24, 2025, he still said he did not understand Sivers. By March 16, 2026, he began using the company's scale, laser architecture, partners, foundry, refinancing, and industry conferences to explain why he was long. This before-and-after comparison is more valuable than he knew it was important early. It reveals that research capability expanded along the prior photonics theme, rather than starting from a complete, flawless industry map.
At the product level, he distinguishes continuous-wave lasers from electro-absorption modulated lasers, and further focuses on distributed-feedback arrays. The argument is not that CW is always better than EML. It is that the design needs of next-generation silicon photonics and CPO will change which type of already-qualified device matters more. It is a choice about architecture migration, not a unified performance ranking of all laser manufacturers.
Step two: unfold customer relationships by evidence grade, rather than filling a diagram with lines. The early March argument included both announced partners and inferences via POET, Marvell, and ultimately cloud providers. By August, he had organized more detailed paths: Jabil's pluggable modules, GlobalFoundries' reference platform, Ayar's optical I/O, POET and O-Net's light-source paths, and several potential customers. In actual investigation, these qualifiers should be retained. A laser supply relationship being established does not mean it has already won all mass-production orders from a given end cloud provider.
Step three: shortage makes independent, available, design-matched allocations more important. On May 24, he explained that Sivers' design control point and Win's manufacturing bottleneck are different layers. Once there is pre-allocated manufacturing capacity, the two converge at finished-product allocation. When reading Applied Optoelectronics and Coherent earnings in August, he found these manufacturers prioritized their own optical-module demand, further narrowing the set of CPO-grade lasers that could be sold to external customers. Research is not broadly counting how many laser factories exist globally. It is finding qualified external-sale supply still available in the target year.
This reflects a counterintuitive operation. Large companies being capacity-constrained is not necessarily only good for the large companies. If large companies have no goods to sell, new demand may turn to small suppliers not yet locked up. At the same time, small suppliers must still pass qualification. Supply scarcity increases the chance of being contacted by customers, but cannot cancel technical and reliability thresholds. On August 28, he repeatedly emphasized this.
Step four: ask the few questions in earnings that can most change the model. The August 25 earnings preview post is very close to a research worksheet. The new information he wanted included new joint development and qualification, the timing of partners such as Jabil moving from development to mass production, additional foundry allocations, listing progress, and whether existing funds could support the transition. Quarterly revenue and one-time accounting changes were not at the same priority, because his positioning of the company was still the qualification stage.
On August 28, he extracted from the transcript six new pluggable partners, different evaluation stages, Jabil's initial order and ramp window, and the second foundry partner's now available capacity. The number of news items was not the most important thing. These items updated three different variables: customer set, progress, and supply. At the same time, he expressed reservations about the higher capex required for internal manufacturing expansion.
The same day, he also explicitly said that opportunity pipeline is not a reliable revenue forecast base. It is better used to observe whether customer quality and scale have changed relative to before. Better inputs are partners' qualification ramp timing and wafer capacity. Therefore, the billions of dollars in opportunity pipeline in the news cannot be directly copied into orders or future revenue.
Step five: write the capacity model completely, rather than jumping to a valuation multiple. Using the inputs in the September 3 post as a demonstration: the author wrote about a target of about 100 million CW DFB lasers per year, and a historical selling price of $50 to $100 for an array of 8 lasers. One laser is not one array. Each array contains 8 lasers. When converting laser count to array count, the numerator is 100 million lasers per year. The denominator is 8 lasers per array.
Nominal arrays per year = 100,000,000 lasers/year ÷ 8 lasers/array = 12,500,000 arrays/year.
Only then multiply sellable arrays per year by price per array. Low-price scenario revenue = 100,000,000 ÷ 8 × 50 = $625,000,000/year. High-price scenario revenue = 100,000,000 ÷ 8 × 100 = $1,250,000,000/year. Real research also needs a realization ratio: the proportion of nominal capacity that ultimately becomes corresponding sellable shipments. For example, with a 50% realization ratio and $75 per array, demonstration annual revenue = (100,000,000 ÷ 8) × 50% × 75 = $468,750,000.
This model exposes the biggest research questions. Not only the price range, but whether nominal capacity is built on time, whether the product definitions of lasers and arrays match, how many products are already qualified, and how much output customers actually absorb. The author's other model on July 16 used Win allocation, 65% yield, and array price to estimate revenue and then gross profit. The model definitions differ, and the two versions of capacity numbers cannot be directly added together.
Step six: new scale evidence can change the view of the same capex. On August 29, he disliked the company putting financing into internal manufacturing and thought it should prioritize M&A and a U.S. listing. On September 3, after seeing a larger capacity target, he explicitly said the new scale information changed his earlier negative view of the hybrid manufacturing model. This is a very specific update. Not interpreting every management action as correct, but recognizing that what was previously uneconomic use of funds may become economic at larger scale and earlier timing.
At the same time, he hopes Sivers will use M&A to expand downstream from lasers into optical engines, light-source modules, or complete optical modules, similar to the Lumentum path he observed. This is a shareholder's strategic idea, not a completed M&A return. The base model should first calculate only the existing business path. Product revenue added after successful M&A should be modeled separately, avoiding using one wish to raise both revenue and valuation multiple at once.
6. Applied Optoelectronics, Sivers, POET: Same Sector, Three Different Gaps
Applied Optoelectronics' ticker is AAOI. On August 13, the author gave a state machine with three extremely concise classifications. Sivers is waiting for revenue conversion. AAOI is waiting for capacity execution. POET is waiting for customers. This distinction can be seen as the most reusable company research framework in the entire archive. It first identifies what is currently missing, then decides what evidence to look for next.
For AAOI, he extracted capacity ramp and excess demand from the August 7 earnings, especially noting the difference between there is demand but we cannot make it and it has not been sold yet. But he was still dissatisfied with repeated issuance in August. On August 24, he said he still had a relatively large position, but did not agree with the financing size, timing, and method. Therefore, the demand judgment need not fully reverse because of financing problems, but the stock judgment needs to include the per-share impact of financing.
For POET, his small position logic on August 13 was not that it has scarce technology like Sivers. It was that cash was large relative to market cap, the supply chain was relatively prepared, and new customers could form a re-rating. He directly admitted weak demand visibility and technology defensibility inferior to upstream laser control points. This is an optionality position based mainly on assets and future customer catalysts, and should not be placed at the same evidence level as Sivers.
7. Korean Memory and EWY: Beyond Industry Judgment, There Is Securities-Packaging Judgment
EWY is an exchange-traded fund tracking the Korean stock market. In February 2026, he not only discussed Samsung and SK Hynix memory profits, but also investigated how the fund was exposed to them, how cross-shareholdings amplified correlation, and volatility in long-dated call option prices. On February 13, he thought the fund's options at about 32% implied volatility were low relative to his estimate of constituent volatility. He called it volatility arbitrage.
Implied volatility is the volatility parameter inferred from option market prices, not equal to future realized volatility. The author hoped to obtain both memory-stock upside and a price response from options to an upward repricing of the volatility parameter. Here one must distinguish his trade naming from the mechanism. High single-stock volatility does not arithmetically guarantee higher fund volatility. Correlations among constituents, fund weights, FX, and option tenor all affect the comparison. This is an expression with directional and pricing hypotheses, and should not be written as risk-free arbitrage.
This case shows that his system not only looks for bottlenecks in the physical supply chain, but also checks whether investment vehicles carry old-world statistical relationships into a new industry cycle. Its common point with AXT is that the old reference framework has not been updated. The difference is that here the value discrepancy occurs at the securities packaging and option parameter layer, not at some factory's supply layer.
8. ESMT and Multilayer Ceramic Capacitors: The Most Distinctive Shortage Transmitting Downward
Increased high-bandwidth memory demand and manufacturers shifting resources to higher-value products does not mean only the highest-end product profits. In August, the author turned to older generations of double data rate memory. DDR4 cost and supply pressure pushed some customers back to DDR3 and DDR2. At the same time, manufacturers originally producing older products were exiting. This combination of demand shifting to lower generations while supply continues to shrink was called cascading bottlenecks.
On August 27, he started from wanting exposure to DDR2 and DDR3 bottlenecks and found ESMT. He focused on the company's PSMC wafer allocation, monthly profit growth, cash, inventory, and customer demand. On August 30, he reread first-half sell-side models, compared prior expectations with subsequently realized price increases, and further studied whether wafer cost increases could be passed through. This is not first seeing a low P/E and then finding a story. The supply theme led to the company, and the company led to the valuation anomaly.
Using the units given in the August 27 post, the numerator is equity market cap of about 2.5 billion. The denominator is not published full-year profit, but annualized profit assuming July net profit of 109.5 million continues for 12 months. Conditional annualized net profit = 109.5 million/month × 12 months = 1.314 billion/year. Conditional earnings multiple = 2.5 billion ÷ 1.314 billion ≈ 1.90x. The next task is not to repeat this division, but to break down profit persistence. Why will old capacity not return? Why will customers not change designs? Can wafer cost increases be passed through? How much of the profit is inventory gains versus sustainable operating profit?
If future average monthly profit is only half of July, the full denominator becomes 109.5 million × 50% × 12, and the multiple is about 3.81x, not 1.90x. If only one quarter, about 7.61x. The sensitivity analysis converts the currently cheap argument into investigable conditions for profit persistence. It neither proves future profit nor rejects the idea because of a single month's data.
He also migrated the same mechanism to multilayer ceramic capacitors. AI server products crowding out manufacturing resources may tighten automotive and consumer products as well. On August 17, he linked industry reports from July and August by date to explain why Taiyo Yuden, despite not having the largest server share, might benefit. On August 18, he tracked extended lead times and postponed expansion. What is truly replicable is the test of whether capacity resources are shared and whether crowding-out has appeared, not mechanically saying the next industry will definitely replicate memory's rally.
9. LPKF and X-FAB: Technical Exposure Confirmed, Timing Still Possibly Too Early
On January 19, he had already listed LPKF's laser-induced deep etching as a glass-substrate clue. On April 21, he published a clearer position and valuation view. Notably, the post mentioned the proportion of a major customer's process validation using the equipment, while he himself emphasized that this proportion could be lower during actual ramp. Used for validation and mass-production share are not completely equal in the original argument.
By August 14, the author recorded reliability validation and mass-production delays for glass-substrate customers, arguing that revenue windows for equipment makers such as LPKF would also shift later. X-FAB received confirmation of CPO and 800V power conversion exposure on July 31, but photonics mass production pointed to 2028, later than his earlier preference for the second half of 2027. Both cases show that choosing the right industry position and choosing the right revenue year are two independent propositions.
This is also why the investigative process must record old timing, new timing, and reason for change. If only the latest thesis is saved, every delay will be rewritten as I was always looking long term. Saving the original window allows one to judge whether he is accepting genuine new evidence or simply pushing the test date back.
10. Raspberry Pi and Rubrik: Not Every Successful Idea Comes from a Physical Bottleneck
The February 16 Raspberry Pi research started from new agent use cases and cheap, independent devices. He did not argue that the heavy compute of a large model itself should be done on a small device. He focused on cheap, isolated, orchestration-capable nodes and calling external models through APIs. The February 18 reply further emphasized that the comparison should look at the cost per isolated node, not raw performance.
This research continues the principle of whether new demand is large enough relative to a small company. But whether product demand persists and whether users truly adopt the new use case matters more than upstream material scarcity. On March 31, he compared company growth updates with prior market expectations and treated it as validation. It shows the same incremental thinking can migrate, but evidence indicators must change with the business.
Rubrik on October 13, 2025 was not a hardware-shortage model at all. He focused on recurring revenue growth, high gross margin, sales and marketing expense ratio, customer stickiness, cash flow, and debt. He argued that current expense investment might mask operating leverage at maturity. In software he also studies how growth turns into profit, just no longer explained through wafers, allocations, and capacity. Writing that his system is unsuitable for software as an absolute conclusion would directly conflict with this case.
6. Industry Fit: Looking for Verifiable Constraints
From the real cases, this investigative method is easiest to apply under the following conditions. End demand has a clear payer. The product must pass through a drawable manufacturing and supply process. The set of qualified supply is not large. New capacity or alternative routes take time. Revenue can land on a few checkable units. Photonics, compound semiconductors, memory, and parts of advanced packaging are closest to these conditions. Fit here is induced from case mechanisms, not a guarantee that these industries will necessarily produce higher investment returns.
Highly fitting industries include optical interconnect, lasers, and photonics materials; memory and older-generation products; advanced packaging, testing, and substrates; passive components, power, and cooling; and compute services and hosted infrastructure. Their common point is that demand, capacity, qualification, price increases, and profit pass-through have observable data. The core questions can land on shortage persistence, cost pass-through, customer commitments, and per-share value.
Conditionally fitting are robotics, critical materials, and defense. In robotics, what most resembles his original strength is components and mass-production supply chains. Who supplies reducers, sensors, actuators? Which components are hard to replace? Do adoption relationships span multiple complete-machine projects? But complete-machine investment also requires answering real scenarios, task value, and commercialization progress. On August 19, when discussing Agility, he specifically separated warehouse-handling commercial use from display capabilities such as backflips. Performance demonstrations are not his only judgment of enterprise value.
Critical materials require adding geopolitical and ownership constraints. On April 23, when explaining his motivation for following European small caps, he explicitly included U.S. supply-chain security and not wanting key technologies controlled by adversaries. This is both a research filter and a value preference. It may lead him to notice unremarkable upstream assets earlier, but it cannot automatically prove these assets will receive government funding, maintain pricing power, or be acquired at a high price. Policy intent and shareholder returns still require contracts, funding, and execution evidence.
Defense themes also have real failure records. On March 26, he admitted AeroVironment and Draganfly were relatively large loss sources. He mentioned event changes and specific project losses before stopping out, and rotated funds into photonics. One cannot simply conclude that when war happens, all drone companies benefit. The companies actually winning contracts, project types, budget flows, and event duration are what must be verified.
Areas that cannot be transplanted as-is are also clear. Software is not outside his circle of competence. The Rubrik original post shows he studies software using customer stickiness, recurring revenue, customer acquisition spending, and operating leverage. The Reddit original post responds to worries about AI search citations reducing using ad monetization, earnings growth, and destination-style user relationships. These are another set of testable business mechanisms and cannot be hard-translated into wafer shortages or physical control points. What is suitable to migrate is finding increments ignored by old valuation frameworks, not calling every moat a bottleneck.
The boundary in biotech is more direct. On October 7, 2025, he said fintech, crypto, and AI were areas he understood, while biotech, construction, real estate, and agriculture were not. In August 2026, he again said he could not build conviction in biotech themes he did not understand. But he also did low-float biotech trades, explaining that it was trade structure, not domain expertise. The accurate distinction is lacking sustained industry research grasp, not never touching the sector.
7. Investigating the Way He Does: Starting Point, Path, and Goal
Under this method, research does not start from a whole-market low-valuation ranking. It starts by identifying an evidence-backed exogenous change. Large customers increasing capex. A product generation changing its connection method. A group of suppliers locking up long-term capacity. Resources shifting from old products to new ones. On December 30, 2025, the author wrote about tracing the supply chain level by level. On August 16, 2026, he wrote about first knowing the CPO theme, then finding remaining suppliers. Both put what problem needs solving before which ticker to buy.
Abnormal valuation can also trigger his research, such as POET's cash-to-market-cap relationship. But even if starting from a price anomaly, the follow-up still must ask whether customers exist and how capacity becomes revenue. Two entry points are allowed. From demand change upward to find companies. From price anomaly backward to verify the real business. What is not allowed is skipping the evidence chain between the two entry points.
The investigative path can be broken into seven stages.
A. Demand anchor. Read actual payers' budgets, orders, and product plans. First distinguish spending plans, signed contracts, and delivered items. Deliver a demand proposition containing payer, use, and timing.
B. Architecture decomposition. Break the product into connection, material, manufacturing, and testing segments. Check whether each segment changes with the new generation. Deliver a dependency map with source and strength marked on each edge.
C. Supply set. Enumerate manufacturers that meet target specs and can supply in the target time. Distinguish internal use from external sale. Deliver a qualified supply table, not a broad competitor list.
D. Timing validation. Check customer and partner transcripts for qualification, sampling, and mass-production windows. Compare old guidance. Deliver a timeline and next verification point.
E. Economic conversion. Use capacity, yield, allocation, and price in the same units to calculate revenue. Then separately calculate gross profit and net profit. Deliver a conditional model and sensitivity, not a direct jump to stock price.
F. Capital and equity. Check cash, customer prepayments, debt, interest, issuance, and stock-based compensation. Deliver a funding bridge showing whether growth can reach existing shareholders.
G. Update and exit. Save the original hypothesis, counterevidence, and reasons for changes. Do not only update the price target. Deliver three columns: verified, still to be verified, and broken.
Each step should produce a limited conclusion. For example, the partner says mass production will begin in the second half of 2027 only updates timing, not automatically price. The second foundry now has capacity updates supply, not automatically proving all end customers will buy. A peer stopped external sales reduces competing supply, not automatically replacing one's own product qualification. The August Sivers earnings series is especially suitable for practicing this variable isolation.
Sivers can also be made into a one-page research card. Main thesis: next-generation photonics products need qualified continuous-wave lasers, and independent external-sale capacity may be scarcer. Confirmed intermediate relationships: Jabil, GlobalFoundries, Ayar, and other paths were confirmed in the author's list. Other paths remain likely or potential. New supply evidence: the second foundry partner already has available capacity, jointly forming a manufacturing source with the original Win supply. Revenue status: multiple qualifications and development efforts are still ongoing. The opportunity pipeline cannot be treated as orders. Nearest verification points: Jabil's initial production order and subsequent ramp window, plus stage progress of six new partners. Model inputs: allocation, output, array definition, price, sellable ratio. List capex and operating expenses separately. Core disproof: foundry allocation failure or qualification failure are logical break conditions explicitly raised by the author. Unconfirmed upside: downstream M&A, broader product coverage, and capital optionality from a U.S. listing can only be listed as separate scenarios.
The goal of this card is not to fill every question with a certain answer. It is to concentrate unknowns where they truly affect value. It also provides a condition for stopping the expansion of information scope. When existing materials are enough to explain who demand comes from, why supply cannot be quickly replaced, how timing connects, and how economics are calculated, the most important thing in the next hour may be verifying one price unit, not finding a tenth distant potential customer.
Finally, keep two ledgers: a research-status ledger and a position-implementation ledger. The research-status ledger records only propositions and evidence, such as qualification has not been delayed, capacity has increased, and price is unknown. The position-implementation ledger records the buy rationale, timing, financing cost, and volatility one can withstand. The two ledgers should be comparable but cannot replace each other. In July, during an industry decline, the author still thought demand had not changed, while admitting he reduced leverage. In August, he still held AAOI but disagreed with its issuance arrangement. Both examples show one need not wait until the industry judgment is completely wrong before adjusting the stock-level implementation.
8. How He Reads News, Earnings, and Sectors
For him, the same piece of news can be bad for the news subject but good for its suppliers. On July 23, responding to a discussion of Google's capex, he specifically said Google is the one spending money, and the market may dislike it spending too much. Upstream semiconductors are the ones receiving money, so the meaning is different. This is reading capital flow, not buying or selling based on the company named in the headline.
News types can be routed by which variable they change.
Budget or order increase. Who pays? What is bought? What is the spending year?
New architecture or technology optimization. Which connection changes? Which product is replaced? Does demand for other segments increase?
Shortage or capacity lock-up. Total capacity or external-sale capacity? Who is not yet locked up?
Qualification or mass-production news. Sampling, qualification, formal order, or high-volume production?
Delay. Which product, which generation, which supply layer is delayed?
Financing or M&A. How much growth is added? How many shares, debt, and expenses are added for it?
Price plunge or macro shock. Is there new operating fact? Is there a funding constraint that makes the stock-price shock feed back into the company?
Case one: Cableless does not mean all cable revenue disappears. On January 7, 2026, he wrote that Credo fell because of cableless wording and cable-color misreading, and he added. His research action was first to break down spatial positions. In-rack connections and rack-to-switch connections are not the same component set. Substitution of some internal connection does not automatically mean external products disappear too. He also acknowledged the long-term photonics substitution debate, so he did not permanently deny substitution. He thought the news subject, product position, and market reaction were not aligned.
Case two: using the wrong industry thermometer mixes different cycles. On October 17, 2025, he disagreed with using ASML alone to judge the entire AI expansion speed. He argued ASML is more an indicator of fab construction cycles, while TSMC more directly reflects then-current chip production demand. What is transferable here is not always look at TSMC, never ASML. It is first identifying what each earnings indicator measures. Equipment investment, wafer manufacturing, device shipments, system delivery, and cloud revenue are at different stages.
On July 18, 2026, he described Zhongji Innolight as a TSMC-like observation gateway in the photonics industry. He used its product volume, silicon photonics penetration, and price changes to infer demand for upstream CW lasers and SOI materials. What he prefers are industry measurement points readable across companies, not only reading the earnings of his own holdings.
Case three: after the earnings numbers, what matters is capacity language in the transcript. On August 27, he first organized Nvidia revenue and guidance, then emphasized that greater research value lay in architecture and supply chain. On August 12, reading Lumentum, he put CPO shipment windows, continuous-wave price increases, capacity lagging demand, and substrate supply ahead. These items may not occupy the first line of earnings headlines, but they directly change upstream companies' model inputs.
His typical reading can be summarized as a two-pass read. The first pass judges whether total demand has changed. The second pass looks sentence by sentence for qualifiers: capacity limits, internal consumption, fully reserved, still qualifying, initial production orders, price not yet determined. The August AAOI and Coherent transcripts mattered because we cannot make enough and we are temporarily not selling externally would change his view on Sivers, not just change those two companies' own revenue forecasts.
Case four: break delay into route and timing, not an emotional word. On March 6, discussing CPO, he thought a short-term delay might extend the lifecycle of pluggable optical modules, with opposite near-term implications for AAOI and Soitec. In July, when the market debated CPO delays, he did informal checks at an AMD industry event and explicitly said he did not get direct confirmation from a confidential supplier. By August, with LPKF, he accepted a specific customer's reliability-validation delay. He does not in principle reject all delay information. He distinguishes information scope and evidence source.
Case five: read account drawdowns and company changes separately. He often thinks the market mistakes price changes for fundamental changes. On August 18, he said memory, capacitor, or InP bottlenecks would not automatically disappear because the corresponding stocks fell. On August 9, he used the same companies at different stock prices to show that demand, contracts, and supply had not necessarily worsened in sync. At the research level, this requires returning to original variables, rather than letting daily price become the only information. But his own margin drawdown shows price changes can also be a real constraint. It affects whether positions can be retained, and at what price companies dependent on capital-market financing can raise money. A complete investigation cannot only write fundamentals unchanged. It must also check whether the price shock feeds back into future per-share earnings through financing channels.
9. Weak Links: How to Make Hypotheses Face Testing
First, many correlations do not equal many truly exclusive routes. Cooperation, joint exhibitions, being cited in papers, customer website displays, and formal mass-production supply each prove different things. Sivers' early multi-hop mapping and the August SK Hynix route research both contain explicit speculation. The author's later more detailed list also retained confirmed, likely, and potential. These qualifiers cannot be deleted and turned into already supplying all large cloud providers. When replicating his research style, the relationship map must have evidence labels. Otherwise, the more lines there are, the greater the false certainty.
Second, a bottleneck being validated does not mean equity returns have been validated. The unknown long-term contract price at AXT is the clearest economic gap. IREN's issuance and AAOI's financing timing are growth-allocation gaps. IQE's old assets and debt are asset-ownership gaps. None of these three can end valuation merely because the industry needs it. A closed argument must go from necessity through contracts, price, cost, and financing, and finally back to existing shareholders' equity.
Third, financial layers cannot be skipped. Gross profit, net profit, and revenue run rate are not the same denominator. On July 16, the main Sivers post explicitly used gross margin to calculate gross profit, then divided market cap by gross profit. A nearby reply described similar capacity assumptions as about five times forward P/E. The main post alone is insufficient to derive that net-profit definition. It still needs operating expenses, depreciation, interest, taxes, and share count. This report does not fill in what may have been assumed by default. It writes clearly how far one can replicate. Similarly, AAOI's monthly capacity revenue multiplied by twelve gives annualized capacity revenue, not realized full-year sales. ESMT's single-month net profit multiplied by twelve gives a scenario assuming that level persists, not full-year achieved earnings. Using these numbers is not wrong. The mistake is deleting the conditional clause.
Fourth, a correct technology direction also has holding costs. Mass-production windows must be version-recorded. LPKF and X-FAB show that something may be structurally important yet still be later than expected in reliability validation, customer projects, or factory execution. The author explicitly admitted these delays. The March drone losses also show that event-driven demand may not match the company originally chosen. Research reviews should record each forecast window, rather than only keeping the eventually realized timing after the fact.
Fifth, strong public conviction may simultaneously produce useful persistence and overdefense. His willingness to track controversial companies for a long time is why so many supply-chain details accumulated. But the fierce criticism of media, short sellers, and local capital markets on Sivers also shows he had taken on a strong public identity. On August 29, he discussed six partners and capacity while imposing strong normative demands on management communication, listing speed, and M&A strategy. Researchers should separate new operating facts from how one hopes management will act. They cannot give the latter the same evidence weight just because the expression is confident.
Sixth, multiple stocks do not equal multiple independent sources of demand. On December 30, 2025, he already admitted these AI companies all ride the same capex wave and could fall together if spending slows. His own high concentration, margin, and large drawdown in July turned this common factor from an abstract risk into actual investment history. So-called diversification across materials, photonics, memory, and robotics may not sufficiently diversify customer budgets, liquidity, and the market's valuation approach to forward growth.
The final operating standard worth keeping is a research card that can be checked at any time. Who ultimately pays? Which architectural segment changes? Who controls qualified supply? When does it convert to revenue? How does revenue convert to per-share value? What evidence would invalidate the original hypothesis? These six items correspond to his most specific Nebius, Sivers, AXT, IQE, ESMT, and delay-correction cases. It preserves the investor's learnable investigative process more completely than copying a hot ticker, a price target, or a screenshot of high returns.
Conclusion
The most valuable thing about this snapshot of 6,566 tweets is not that it provides an answer bank. It demonstrates a question generator. He repeatedly translates market narratives into supply-chain language. Who pays? Which architectural segment must change? Who has qualified supply? Who controls sellable output? How far has qualification progressed? When does revenue appear? Who finances growth? Who ultimately owns it? Then he changes one edge based on new evidence, rather than only changing the price target.
This method is not mysterious, but it is hard to sustain. It requires the researcher to read qualifiers in earnings transcripts, track customer websites and reference designs, distinguish total capacity from external-sale capacity, multiply nominal capacity by a realization ratio, recalculate per-share value in the face of financing and dilution, and admit that the technology direction is right but the timing judgment was too early. It also reminds people that being right on the industry does not mean a position can be infinitely concentrated. A research process can be copied. Leverage and drawdowns cannot be copied as-is.
What is worth learning is not what he bought. It is how he turns an industry change into an investigable hypothesis on the supply chain, how he judges who owns scarcity, and how he converts scarcity into time, profit, and equity value. As for returns, the material boundary must be stated clearly. The uploaded snapshot has 6,566 unique post IDs, while the repository's current description says 6,568. The two are not the same frozen version. The four X long-form articles listed by the repository have only tables of contents and derived summaries. The actual body pages return 403, so they are used only as clues that the articles exist and their themes. The core argument is independently supported by visible original posts. Some long tweets in the snapshot are truncated previews, and later text does not fill in endings that do not appear. Semantic classification, dictionary hits, and the author's self-reported returns are labeled separately and do not substitute for one another. Self-reported returns lack fund flows, tick-by-tick trades, and a unified net-value basis, so audited returns, win rates, or risk-adjusted returns cannot be calculated.
This is not investment advice, nor a recommendation of any security. It is a research map. Start from end-demand spending. Move upstream along architectural changes. At each node, ask about evidence, timing, capital, and equity. A map does not tell you where the endpoint is. It tells you what to ask next.
About the Creator
Jin
Writer of reamstories
https://reamstories.com/jin
Enjoyed the story? Support the Creator.
Subscribe for free to receive all their stories in your feed. You could also become a paid subscriber, letting them know you appreciate their work.
Comments
There are no comments for this story
Be the first to respond and start the conversation.