
I Called the Top Three Times. Now I’m Calling the Rebound a Trap.
The earnings are out, the bull case is thinning, and the next bounce may be your exit window, not your second chance.
This piece will not be popular.
With the market down like this, saying “there will be a rebound” invites anger. So first, the disclaimers. This is not a buy signal. I am not calling a reversal. I am not asking anyone to chase a bounce. I am trying to lay out the script that tends to play out late in a bull market, especially after a cyclical growth sector tops out. You can disagree. Finish reading first.
On July 2, I wrote the first version of the “STAR Market Escape Guide” and said that was a stage high. It played out. On July 16, when the STAR Market rallied, I wrote that it was a bull trap and published version 2.0. That also played out. Later, when the STAR Market rebounded to around 1700, I wrote version 3.0 and said 1500 was the lifeline for escaping the STAR Market. These calls do not make me a prophet. The tape, sentiment, and cycle position were simply what they were.
I can also say this plainly: in May and June, advertisers offered me money, and I held back. I did not take commercial promotions, and I did not leave readers stranded at the top. That is the premise for everything below. Friends who know me know I cleared my STAR Market and optical module positions long ago. I have locked in the profits from this bull market. I am not writing this to get people to take over my bags, and I am not writing it to prove my bearish call was right. I want readers who still hold positions to see the board more clearly.
1. Why optical modules and the STAR Market keep falling
Many people blame rumors, external bad news, or a collapse in sentiment. Those are triggers. They are not the main cause.
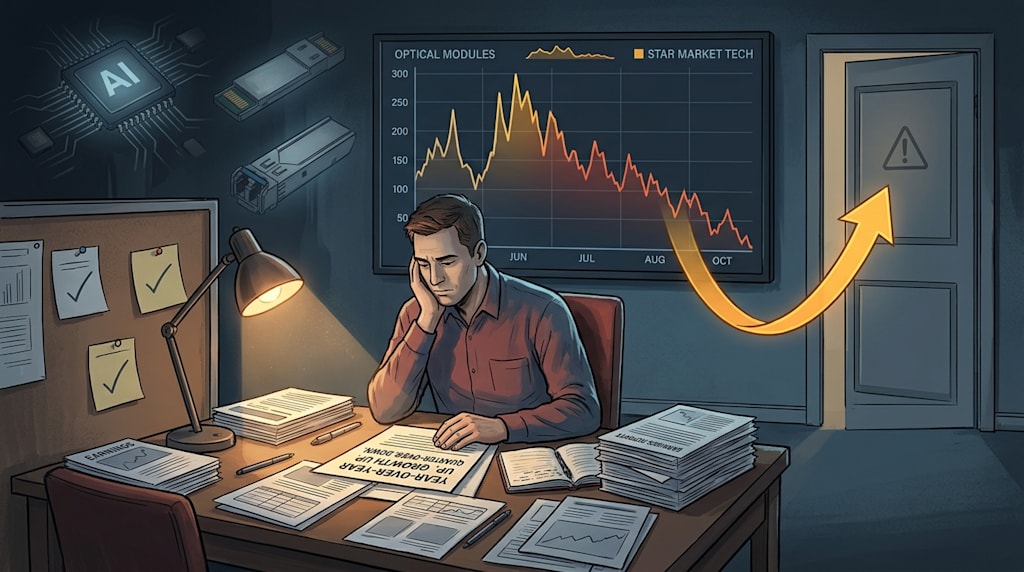
The main cause is this: for optical modules and the STAR Market growth theme, the cyclical top is already fairly visible in quarter-over-quarter trends and in the trading structure.
I am not saying the theme will never work again. I am not saying AI computing has no long-term logic. I am saying that, as a market-leading theme, its quarter-over-quarter earnings momentum, valuation expansion space, and chip structure have passed their most comfortable phase. The most dangerous moment for cyclical growth stocks is often not when earnings are at their worst. It is when earnings are at their best and everyone is calculating next year’s space.
Look at the third-quarter reports already disclosed. On the surface, the numbers still look acceptable. Leading optical module makers generally show 30% to 50% year-over-year revenue growth, and net profit is still positive year over year. In cyclical stocks, year-over-year numbers can mislead. Last year’s base was low, order recognition lags, and product mix is still upgrading, so year-over-year can look good. The core of a cyclical stock is not year-over-year. It is quarter-over-quarter.
Using leading samples, the second quarter was very likely the peak of this earnings cycle. Single-quarter revenue and net profit hit record highs. By the third quarter, revenue began to decline quarter over quarter, and net profit fell more. Revenue held up, but profit broke first. That is a typical signal of a cyclical top. Profit breaks first because price competition, product mix changes, inventory write-downs, and rigid expenses show up first in gross margin and net margin.
History offers a useful rule for cyclical stocks. It is not a mathematical law, but it appears often: stock prices tend to peak when earnings look brightest, or earlier. Review the price action. The stock price highs for the STAR Market and optical modules basically appeared around June, when the second quarter ended. From July to August, interim reports were disclosed. The data was explosive. Everyone thought the boom could continue. The stocks began a slow grind lower from that point.
Why? Stock prices trade marginal change, not static glory. The market already knew second-quarter earnings were good. Forward-looking money had already begun to leave as third-quarter quarter-over-quarter growth weakened. By the time retail investors saw the “best interim report in history,” smart money was already asking, “What happens to next year’s year-over-year base? Can quarter-over-quarter still move up?”
2. Earnings reports are useful, but retail investors get them too late
Many retail investors think earnings reports are useless. They are useful. The timing problem is severe.
Under the rules, ChiNext interim reports must be fully disclosed by the end of August, and third-quarter reports by the end of October. You have to wait until October to fully confirm the third-quarter quarter-over-quarter decline. Institutional money does not wait for the earnings report.
A simple fact: frontline factory workers know whether next month’s orders are strong and how many shifts the production line will run. Distributors can get downstream pickup plans one or two months in advance. Many veteran individual investors on Xueqiu who trade cyclical stocks squat outside factories counting trucks, track executive schedules, and ask industry-chain friends about orders. That is already rudimentary research. Big capital that has invested billions or tens of billions in optical modules and the STAR Market cannot lack first-line information channels.
A company’s sales director and production line director know better than anyone what current-month orders and next-month production schedules look like. Institutions may have anticipated the third-quarter quarter-over-quarter weakening in May and June. By July and August, it was fully verified. In May and June, some funds may already have known that third-quarter earnings would decline. That is why they concentrated all the profit they could release into the interim report, created a “best in history” earnings report, coordinated with public opinion, and completed the first round of distribution at the June peak when market sentiment was hottest.
This is a common earnings-window game. I am not accusing any company of accounting fraud. Without evidence, you cannot state as fact that “they stuffed profits into the interim report.” The logic is still clear: earnings disclosure has a lag, industry information travels in sequence, and chip distribution needs sentiment. By the time you see the third-quarter report in October and finally react to the weakening boom, main funds have already run off with most of the goods.
3. Why rebounds often follow earnings landing
Third-quarter reports are basically all out now. Many people think that once earnings are falsified, the market will just keep falling. That is too simplistic.
In A-share history, no big bull stock and no major sector has finished distribution by simply grinding down all the way. After the first crash, if main funds want to sell their chips thoroughly to retail investors, falling alone is not enough. They must give people the hope that “it can’t fall anymore, a rebound is coming” so that people are willing to take over. After earnings are fully landed, a rebound often follows. This is a common script after a cyclical top. It is not identical every time. It is not necessarily 10% to 20%. It is not necessarily immediate.
Next, you may see a familiar script.
First, in public opinion, research reports and financial content will emphasize “year-over-year net profit growth” and avoid the sharp quarter-over-quarter decline. They will create the illusion among retail investors that “earnings are actually still okay,” and various experts will show up to endorse it.
Second, on the news front, listed companies will release good news in clusters: major shareholders increasing stakes, share buybacks and cancellation, new orders, new technologies. The good news is not necessarily fake, but you need to look at quality. Is the increase in holdings symbolic or real money? Is the buyback for cancellation or for equity incentives? Is the order a framework agreement or an executable contract? Is the new technology sampling or mass production?
Third, on the tape, they will pull out a 10% to 20% rebound, creating the fantasy that “it has bottomed and the second wave is starting,” attracting bottom-fishing funds and rebound-chasing funds. The purpose of this rebound is to use the sentiment repair after earnings land to distribute the remaining chips to the second batch of retail investors entering the market or preparing to bottom-fish.
A leading company in the robotics supply chain recently had this flavor. Before its worst earnings report came out, it first pulled a bull trap, then the sector had a rebound. In the end, it was the same script. This is not the conspiracy of some main force. It is the chip-distribution rule that has not changed in decades in the A-share market: if main funds want to sell chips thoroughly to retail investors, they must give people the hope that “it can’t fall anymore, a rebound is coming.”
The script is the same every time. The people who fall for it are different every time.
I cannot precisely predict when the rebound will come or how long it will last. External variables matter. Company A is in the process of listing, the Nasdaq tech sector may come under pressure, and our market will likely be dragged along for more grinding, or even probe lower again. The rebound may be late. It may not be absent. The more precise claim is this: history suggests an emotion-repair rebound after earnings land is common, but the timing and magnitude cannot be precisely predicted, and external conditions need to cooperate.
A sustained rebound will not appear in a pattern of violent spikes and plunges. Any move with extremely large single-day volatility usually has poor follow-through. In terms of timing, it may be after the middle of next month, or later. Do not interpret “there will be a rebound” as “it will rise tomorrow.”
4. How to tell whether this rebound is a loss-reduction window or a sustained reversal
Here are a few observation signals. They are not buy or sell advice. They are to keep you from being led around by emotion.
First, look at whether quarter-over-quarter performance is improving. A rebound can be emotional. A sustained reversal must rely on fundamentals. In the next earnings report, can single-quarter revenue and net profit stop falling and turn up quarter over quarter? Can gross margin stabilize? Can inventory be destocked? Are contract liabilities and cash flow improving? If quarter-over-quarter continues to decline, the rebound is just a rebound.
Second, look at whether leaders and the sector are moving in sync. A sustained reversal usually starts with leaders stabilizing, a tiered structure within the sector, and a moderate increase in turnover. If only small caps are flying around, leaders are not following, or leaders spike and fade, then it is most likely sentiment repair.
Third, look at the framing of research reports. If all research reports only talk about “high year-over-year growth” and do not mention “quarter-over-quarter decline, rising inventory, price competition,” the fundamental falsification has not been fully priced in. Be careful.
Fourth, look at the quality of company good news. When increases in holdings, buybacks, orders, and new technologies come out one after another, do not listen to stories. Look at verifiable things: order amount as a percentage of revenue, execution period, who the customer is, how much prepayment there is, and how much impact there is on gross margin.
Fifth, look at price and volume. If a rebound comes with heavy volume but stalls, spikes and fades, or dense upper shadows, someone is using liquidity to sell. Huge single-day spikes and plunges usually have poor follow-through.
Sixth, look at key levels. Earlier I said 1500 was the lifeline for escaping the STAR Market. A break below does not mean the end of the world. It means that after a break, former support becomes resistance, and when a rebound reaches that area, you need to watch whether it can stabilize. If it cannot stabilize, it is still a loss-reduction window.
5. What to do if you are holding positions versus empty-handed
The following is not investment advice. It is logical deduction.
If you still have positions and you can no longer hold them, and you want to leave early, that is completely fine. Do not force yourself to hold on just because I said “there will be a rebound.” A rebound is a probability, not a promise. If you are willing to wait for a rebound before leaving, set conditions in advance: what level the rebound needs to reach, what signal needs to appear, how much to reduce, and under what circumstances to give up waiting. Do not cling to the fantasy that “just wait a little longer, maybe it will make a new high.” Once the cycle turns, future earnings will only get worse wave after wave, unless there is an extreme event or sudden favorable news.
If you are empty-handed, do not chase just because “there will be a rebound.” Chasing rebounds requires high trading skill. Reading a long article does not give you that skill. Wait for right-side signals, wait for quarter-over-quarter improvement, wait for leaders to stabilize, wait for price-volume confirmation. Missing a segment is better than catching the last bag.
This rebound is a chance to cut losses and leave. It is not a chance to add positions and break even. That sentence is hard to hear and easy to verify. Many people lose money not because they failed to wait for a rebound, but because they mistook a rebound for a reversal and mistook a loss-reduction window for a break-even window.
I am not calling on everyone to bottom-fish or chase rebounds. I am not bullish on a reversal. I am explaining the underlying logic so that friends who still have positions can see the board more clearly. When the market is bad, everyone is in a bad mood. I understand. No matter how others evaluate me, I can say this: from refusing commercial orders in May and June to writing three consecutive escape guides in July, up to now, what I have been most worthy of is my family. I also hope the friends who follow me can lose a little less.
One last time: this article does not constitute any investment advice. For specific companies, look at orders, inventory, gross margin, cash flow, and valuation. Do not comfort yourself with year-over-year numbers. Do not mistake a rebound for a reversal.
Go easy on me.
About the Creator
Jin
Writer of reamstories
https://reamstories.com/jin
Enjoyed the story? Support the Creator.
Subscribe for free to receive all their stories in your feed. You could also become a paid subscriber, letting them know you appreciate their work.
Comments
There are no comments for this story
Be the first to respond and start the conversation.