
How To Use Support and Resistance in Trading
Want to trade like a pro? If you do, you will need to use support and resistance to achieve maximum profits.


There are a lot of different ways to trade like a professional stockbroker. You can learn the ways to invest like Warren Buffet by taking a look at the value of stocks and going through the long term approach. You could learn how to invest like Ray Dalio by using radical acceptance and hard research. Or, you could use support and resistance in trading techniques.
Support and resistance are two major terms that have helped guide tons of professional traders to wealth. They can help predict your stock outcomes, can help you figure out when to sell, and also are known for just being good guidelines. Most stock investors who have made the big leagues, including Buffett, have used these tools in the past.
Ready to learn about them? Here's what you need to know in order to trade in the stock market using these two unique terms.
First, let's talk about the definitions of support and resistance in trading.
When most of us think about support and resistance, we think of political or social things. If we support something, we're acknowledging that it's good and contributing to it. If we're resisting something, we are trying to push it down or ultimately reject it.
The use of support and resistance in trading is a bit different. They are basic terms used in technical analysis—also known as using charts and big numbers to figure out what's going on in the stock market.
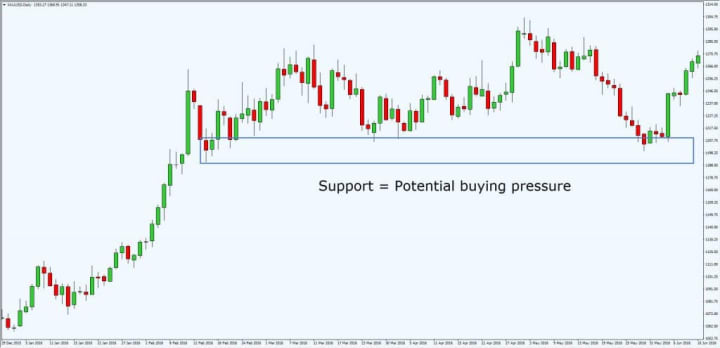
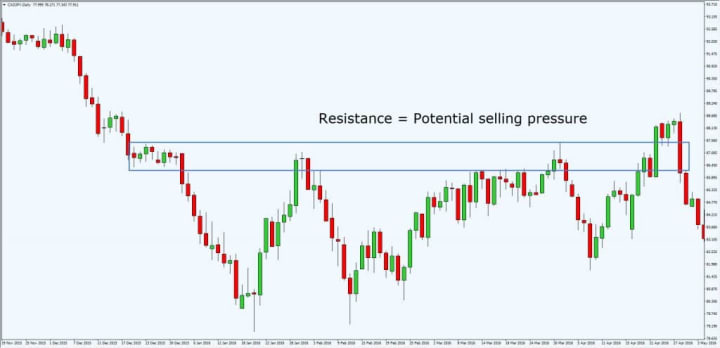
The best way to define support is the low-end average value of a stock. Resistance can be described as the "glass ceiling" of a stock's price. In other words, it's the stock price level that your pick never seems to exceed.
This is a way of seeing which way the price moves in the long and short term, plain and simple.
How do people see support and resistance in trading?
Support and resistance are generally charted as two lines. The support level is the bottom line which stocks don't dip beneath. The resistance level is the top line, which stocks don't ever seem to rise above.
Finding out where the resistance and support lines, though, can be tricky. Usually, technical analysts use charting software to find out where these lines are.
However, you can "eyeball" it by drawing lines where the stock price tends to dip at its lowest, and lines at which the stock price never seems to exceed. You can use any frame of time to find out where the support and the resistance lines are.
Generally speaking, longer time frames are more reliable than shorter ones—unless you're trying to day trade. It's also worth noting that support and resistance lines both change gradually over time, so if you notice a slight slant, that's okay.
That being said, there are a lot of different types of support and resistance in trading.
When you're talking about these two lines, it's really not just two lines. More advanced traders actually break it down into a variety of different measurements.
Along with support lines and resistance, a lot of technical analysts will mark the points where breakouts happen—as well as where plateaus can happen. These are typically called swing points, and they tend to highlight where people should take action.
That being said, it's a bit advanced for what we're doing here. We're just offering an intro, okay?
The cool thing about using support and resistance in trading is that it's not just a tool for stocks.
Using this kind of chart data is great for people who want to trade FOREX, cryptocurrencies, and just about anything else that gets put on an exchange.
If you've been trying to learn how to trade commodities or other typically "extreme" types of investments, it's best to learn how to use support and resistance before you start.
This is actually one of the most common ways stock market fans tend to use these tools. If you buy close to the support line and sell close to the resistance line, you'll always profit. A lot of traders actually do this repeatedly to get a constant, steady stream of profit.
It's a beginner strategy, sure, but it can take a little help to get the hang of it. Using the Start Trading Stocks Using Technical Analysis course from Udemy can be a huge help if you're really feeling shaky. It's one of the top 10 online courses for mastering the stock market.
You can also tell whether a stock is going to be an okay long-term investment from its resistance and support lines.
Visual learners who love trading on trends will find this one of the easiest ways to use support and resistance in trading strategies. You can do this by drawing both lines on a variety of charts. A lot of traders get their lines from a short length of time (a month or so), a middle length of time (six months), and a long length of time (one to three years).
If the stock climbs long term, but dipped short term, it is probably a good purchase. Generally speaking, then longer you see an upward trend, the more likely it is that it's going to be a good stock to buy.
Once in a blue moon, stocks will suddenly break through resistance levels and skyrocket. This is called a "breakout" and it can become insanely profitable for the right investor. (Of course, it could also be a spoof.)
When a breakout occurs and is sustained, the resistance line typically becomes the support line. A little extra volatility during this time means that you can often get stocks at a bargain price, too. As a result, a lot of traders will watch for a breakout like a hawk, and swoop down to snag stocks as things adjust.
That being said, false breakouts can occur and the future price of a stock is never guaranteed. So, you will still have to take your own risk on that end.
Figuring out when the breakout occurs and whether it's predictive is tough. Nrupen Masam's Stock Trading course on Udemy can help you learn more about the technicals of technical analysis, if you feel the need.
Just like you can use support and resistance in trading for breakouts, you can also use them to cut losses.
Breakouts are clearly profitable, but what happens if the bottom falls out from your support? Should this happen, old school stock knowledge will suggest that your new support becomes the resistance... and that also means you should sell.
Resistance is in the eye of the beholder (sort of?).
A lot of the ways to use support and resistance in trading seem pretty straightforward, but they're not. Plenty of factors can change the information that you get from the lines you graph.
Things like the volume of the stock you're charting can reinforce what you are seeing. On the other hand, time frames can weaken or reinforce what you see—or give it an entirely new connotation altogether.
It's up to you to interpret the data you get from your charts. Though there are good rules of thumb to follow, it's up to you to determine if the stock you're seeing is a special case.
Overall, you should use support and resistance in trading as a tool—not a commander.
There are plenty of tools you can use to invest wisely in the stock market. You can use software that shows you where to invest. You could use one of the best robo-advisor apps to let them do the work for you.
Or, if you want to get hands on, support and resistance lines can offer the insight you need to determine what the right shot for you is. At the end of the day, you're the one in charge of the trading decision, and that's what matters.
About the Creator
Ossiana Tepfenhart
Ossiana Tepfenhart is a writer based out of New Jersey. This is her work account. She loves gifts and tips, so if you like something, tip her!
Enjoyed the story? Support the Creator.
Subscribe for free to receive all their stories in your feed. You could also pledge your support or give them a one-off tip, letting them know you appreciate their work.
Keep reading
More stories from Ossiana Tepfenhart and writers in Trader and other communities.
Things You Must Realize in Order to Make Your First Million Before 30 Years Old
Being a millionaire by 30 is something almost every young person has dreamed of. After all, money is way more fun when you're young enough to enjoy it in its entirety. Thousands of people reach their first million dollar net worth every day—and there's really nothing that says that you can't be one of them eventually.
By Ossiana Tepfenhart6 years ago in Trader
How to Choose the Right Mascara for Dramatic Results?
Choosing the right mascara can transform your look from ordinary to extraordinary. It can give you the dramatic lashes you desire. With countless options on the market, finding the perfect mascara can be overwhelming. However, understanding the key features and knowing what to look for can simplify the process.
By Beauty Bliss5 days ago in Trader
Top 10 Compliance Challenges in 2024
In 2024, businesses continue to navigate an increasingly complex regulatory landscape, presenting numerous compliance challenges. Addressing these challenges effectively requires robust compliance management services. This article explores the top ten compliance challenges in 2024, providing insights into how organisations can adapt and maintain compliance in this evolving environment.
By Office Compliance Management3 days ago in Trader


Comments
There are no comments for this story
Be the first to respond and start the conversation.