
How to Use Moving Average to Define an Area of Value in Trending Markets
Understanding Moving Averages

Introduction
Welcome to our comprehensive guide on how to effectively use moving averages to define areas of value in trending markets. In this article, we'll delve into the concept of using moving averages to identify potential buying or selling opportunities in trending markets. We'll cover various types of moving averages, the significance of testing, and how to time your entries for maximum effectiveness.
Understanding Moving Averages
In trending markets, a moving average can act as an essential tool to identify areas of value. A moving average smooths out price data over a specified period and presents it as a line on the chart, helping traders discern the overall direction of the trend. When combined with other technical indicators like support and resistance, moving averages can significantly enhance your decision-making process.
Choosing the Right Moving Average
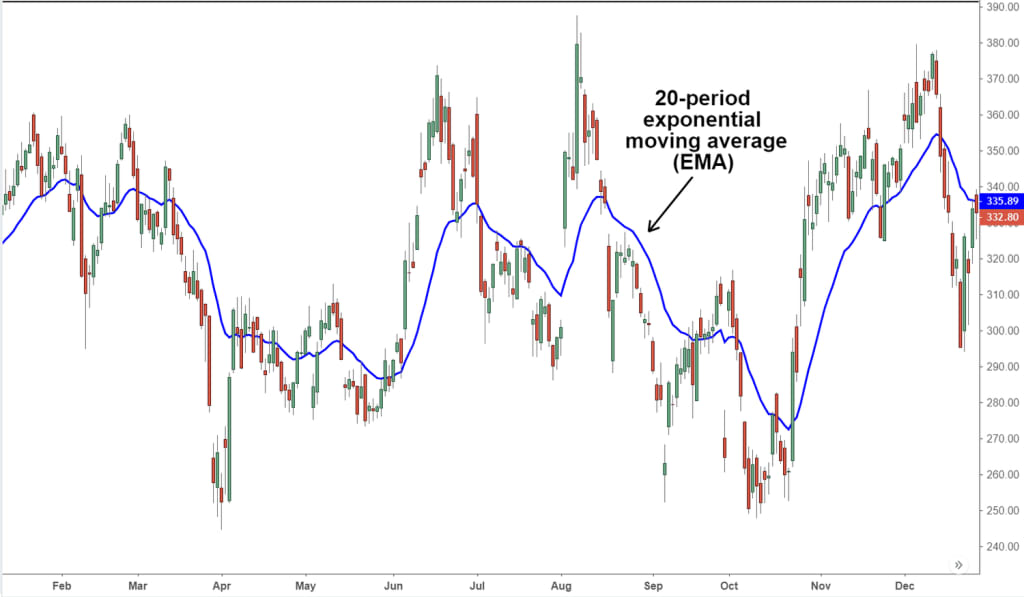
Deciding which moving average to use can be pivotal in your trading strategy. For many traders, the 50-period moving average is a popular choice. It tends to provide a clear and healthy representation of trends. However, traders have the flexibility to choose different moving averages based on their preferences and trading style. Shallower pullbacks can be identified using a 20-period moving average, while a 100-period moving average may be suitable for traders seeking deeper pullbacks.
Confirming the Moving Average as an Area of Value
Before relying on a moving average as an area of value, it's essential to ensure that the price respects it consistently. Two tests are usually required to confirm this. For example, if the market is in an uptrend and pulls back twice, testing the moving average, it signifies the potential area of value. The more times the price bounces off the moving average, the stronger the indication of an area of value.
Practical Application with Charts
Let's explore some real-world examples using charts to better understand how moving averages can be applied in different markets:
Example 1: Brent Crude Oil
In the Brent Crude Oil chart, we observe three tests where the price bounces off the 50-period moving average. This confirms that the moving average is acting as an area of value, providing opportunities for buying when the price pulls back towards it.
Example 2: USD/JPY
The USD/JPY chart shows a similar pattern with three tests, indicating the 50-period moving average as an area of value. Traders can look for buying opportunities when the price retests the moving average after a pullback.
Example 3: AUD/JPY
The AUD/JPY chart demonstrates how the 20-period moving average can serve as an area of value. Although it provides shallow pullbacks, it gives traders less time to plan their entry compared to the 50-period moving average.
Example 4: USD/CNH
In this chart, the 20-period moving average again serves as an area of value. However, the depth of the pullbacks is considerably deeper, giving traders more time to make decisions.
Recap and Entry Trigger
By understanding areas of value through moving averages, traders can make informed decisions on when and where to enter trades. The process involves first analyzing the market structure, then identifying areas of value with moving averages, and finally triggering the entry at the right moment.
Frequently Asked Questions (FAQs)
1. What is the significance of an area of value?
An area of value helps traders identify potential buying or selling opportunities on a chart. It acts as a level where the price tends to react or reverse due to market forces.
2. Can moving averages be used in conjunction with other technical indicators?
Yes, traders often use moving averages in combination with other indicators such as support and resistance to enhance their analysis and decision-making.
3. Which moving average is best for defining areas of value?
The choice of moving average depends on individual preferences and trading styles. While many traders prefer the 50-period moving average, others may opt for shallower or deeper pullbacks using different periods.
4. How many tests are required to confirm an area of value?
At least two tests are typically required to confirm an area of value. The more times the price bounces off the moving average, the stronger the indication of its significance.
5. Can moving averages be used in non-trending markets?
Moving averages are most effective in trending markets, where they help identify areas of value. In non-trending markets, other indicators may be more suitable.
6. Are there any risks associated with using moving averages?
While moving averages can provide valuable insights, they are not foolproof and should be used in conjunction with other technical and fundamental analysis.
Conclusion
In conclusion, utilizing moving averages to define areas of value in trending markets can be a game-changer for traders. By understanding market structure, selecting the appropriate moving average, and confirming the area of value through multiple tests, traders can improve their entry timing and make more informed decisions. Remember to combine moving averages with other technical indicators for a well-rounded analysis. Happy trading!
About the Creator
Jeewan Goswami
Hi Iam Jeewan Goswami
Keep reading
More stories from Jeewan Goswami and writers in Trader and other communities.
How to Stay Grounded in a Volatile Market: A Trader's Guide
As a trader, you are likely no stranger to the ups and downs of the market. Volatile conditions can be both enticing and intimidating, offering the potential for significant gains but also posing the risk of substantial losses. In this article, we will delve into the world of volatile markets and explore how you can navigate them while maintaining your financial security and trading success.
By Jeewan Goswami10 months ago in Trader
The best refrigerators to buy dice now!
In our modern homes, refrigerators are more than just appliances. They have become the guardians of our food, ensuring its freshness and safety. Over the decades, these devices have undergone remarkable evolution, both in terms of functionality and design, to meet the changing needs of consumers and technological advances. Today, we are witnessing the emergence of innovative refrigerators, such as the «GEDTECH High Freezer Refrigerator - GE217DPSL Silver - capacity 217L - Class E [Energy Class E]» offering generous capacity and optimized energy efficiency, the “CHIQ CBM159LEBD Low Frost 157 Litre (109 + 48) Freezer Refrigerator, Low Noise, Fast Cooling, Small Footprint. [Energy Class D]”, which stands out for its low noise level and small footprint, as well as the «FRIGELUX Fridge freezer low RC168BE» combining simplicity and performance. These examples illustrate the diversity and innovation that characterizes the refrigerator market today, while highlighting the growing emphasis on energy efficiency and practicality. In this article, we will explore the evolution, different typologies, recent innovations and environmental issues of refrigerators, while taking a look at the future of this essential technology in our homes
By Alicia Lhotellier5 days ago in Trader
Integrated marketing
Integrated Marketing Dispatches( IMC) is a strategic approach that ensures all marketing dispatches are cohesive, harmonious, and work together to support a brand's communication across colorful channels. In moment's dynamic and connected business, where consumers are bombarded with information from multiple sources, IMC has come essential for companies to effectively reach their target followership and achieve their marketing objects. At its core, IMC involves the integration of colorful communication tools, similar as advertising, public relations, direct marketing, deals creation, and digital marketing, to deliver a unified communication to consumers. By coordinating these rudiments, companies can produce a flawless brand experience that resonates with consumers and drives engagement and fidelity. One of the crucial benefits of IMC is that it allows companies to maximize the impact of their marketing sweats by using the strengths of each communication tool. For illustration, while advertising helps make brand mindfulness on a large scale, public relations can enhance credibility and trust by securing positive media content. Meanwhile, direct marketing enables substantiated communication with individual guests, while digital marketing offers precise targeting and real- time engagement openings. also, IMC enables companies to maintain thickness in their messaging across different channels, which is pivotal for erecting brand identity and recognition. harmonious branding helps consumers develop a clear understanding of what a brand stands for and fosters trust and fidelity over time. Whether a consumer encounters a brand's communication on social media, TV, or in- store, they should admit a harmonious communication that reflects the brand's values and positioning. Another advantage of IMC is its capability to produce community among colorful marketing channels, performing in a accretive effect that amplifies the overall impact of the crusade. When different communication tools are strategically integrated, they support each other, creating a more important and memorable brand experience for consumers. For illustration, a company may launch a TV announcement crusade to make mindfulness, rounded by social media elevations to encourage engagement and drive business to the website. By coordinating these sweats, the company can induce lesser brand visibility and engagement than if each channel were used singly. In addition to enhancing brand mindfulness and engagement, IMC also facilitates better dimension and evaluation of marketing effectiveness. By integrating different communication tools, companies can track the performance of each channel and assess how they contribute to overall crusade objects. This allows marketers to optimize their strategies in real- time, allocating coffers to the most effective channels and refining messaging to more reverberate with their target followership. still, enforcing IMC effectively requires careful planning, collaboration, and collaboration across different departments and stakeholders within an association. It involves aligning marketing objects, messaging, and creative means across colorful channels while icing thickness in brand positioning and identity. This frequently requires breaking down silos between departments similar as marketing, advertising, public relations, and deals to foster collaboration and integration. also, with the rapid-fire elaboration of technology and the proliferation of new communication channels, the geography of IMC is constantly evolving. Companies must stay nimble and acclimatize their strategies to influence arising trends and technologies to stay applicable and competitive. From social media and influencer marketing to immersive gests and stoked reality, there are endless openings for brands to engage with consumers in innovative ways and produce memorable brand gests . In conclusion, Integrated Marketing Dispatches is a strategic approach that integrates colorful communication tools to deliver a cohesive and harmonious brand communication across multiple channels. By coordinating sweats across advertising, public relations, direct marketing, deals creation, and digital marketing, companies can maximize the impact of their marketing sweats, enhance brand mindfulness and engagement, and drive business results. still, successful perpetration requires careful planning, collaboration, and adaption to evolving consumer trends and technologies.
By vinoth kumar4 days ago in Trader
Doing it for the troops
The others dropped like flies around me. We fought and struggled to get to this point. I'm the only one left now. The objective is right there. A mere two hundred feet away. The last of my team got a bullet to the head right next to me, but I couldn't do anything. I was able to locate and neutralise the sniper as he shot my friend, so his death was at least not in vain.
By Mohammed Darasi6 days ago in Fiction


Comments
There are no comments for this story
Be the first to respond and start the conversation.