
How to Start Learning Candlestick Charts for Forex Trading
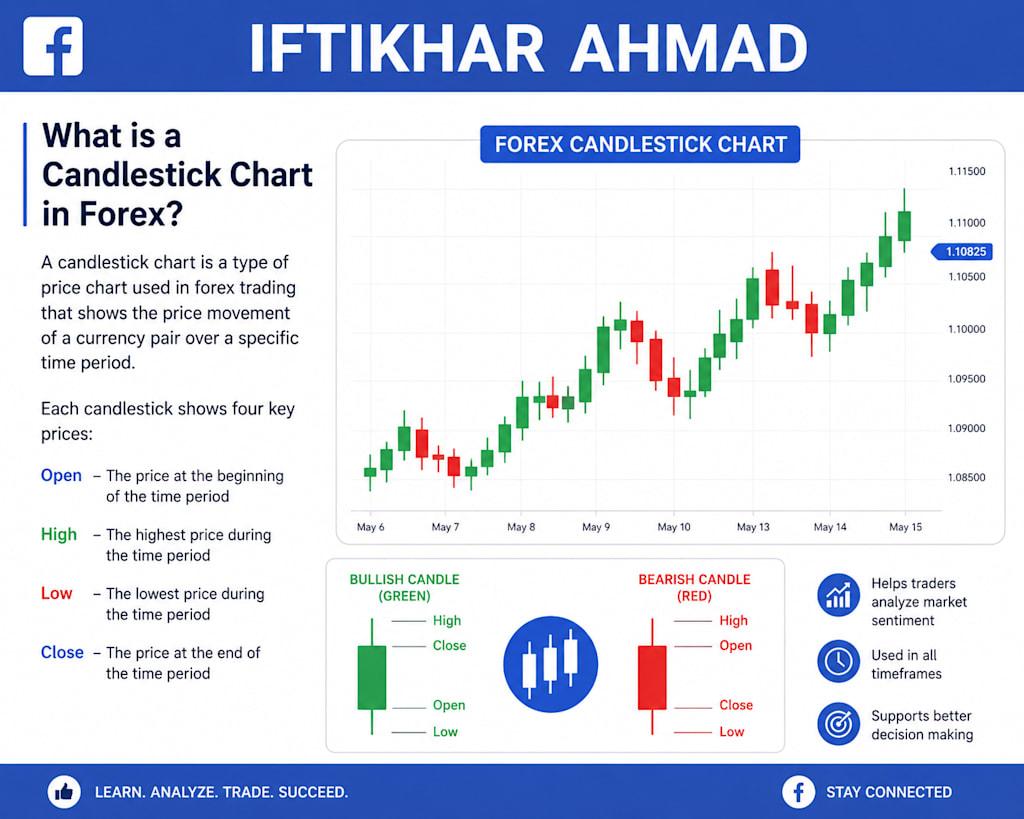
What is a candlestick chart in forex?

How to Start Learning Candlestick Charts for Forex Trading
Candlestick charts are one of the most powerful tools in the forex trading world. Every successful forex trader understands the importance of reading candlestick patterns because they help traders analyze market movements, predict possible trends, and make better trading decisions. If you are new to forex trading, learning candlestick charts is one of the best first steps you can take.
Forex trading is not only about buying and selling currencies. It is about understanding market psychology, price action, and trend behavior. Candlestick charts make this process easier because they visually show the battle between buyers and sellers in the market.
Special Note About Forex Earnings
Forex trading can create opportunities for online income, but it is important to understand that earnings in forex are never guaranteed. Many beginners think forex is a quick-money system, but professional traders know that success comes from education, patience, risk management, and discipline. Learning candlestick charts is a skill-building process that may help traders improve their market understanding over time. Always trade responsibly and avoid investing money you cannot afford to lose.
What Are Candlestick Charts?
Candlestick charts are graphical representations of price movements in financial markets. They were originally developed by Japanese rice traders hundreds of years ago and are now widely used in forex, stocks, crypto, and commodity trading.
Each candlestick represents price action during a specific time period. This could be:
1 minute
5 minutes
15 minutes
1 hour
4 hours
Daily
Weekly
Candlesticks help traders quickly understand:
Opening price
Closing price
Highest price
Lowest price
Understanding the Structure of a Candlestick
A candlestick has two main parts:
1. The Body
The body shows the opening and closing prices.
If the price closes higher than it opened, the candle is bullish.
If the price closes lower than it opened, the candle is bearish.
2. The Wick or Shadow
The wick shows the highest and lowest prices reached during that time period.
Upper wick = highest price
Lower wick = lowest price
Bullish vs Bearish Candles
Bullish Candle
A bullish candle means buyers are stronger than sellers.
Common colors:
Green
White
This shows upward momentum.
Bearish Candle
A bearish candle means sellers are stronger than buyers.
Common colors:
Red
Black
This shows downward momentum.
Why Candlestick Charts Are Important in Forex
Candlestick charts are important because they help traders:
Understand market sentiment
Identify trend reversals
Spot buying and selling pressure
Improve entry and exit timing
Analyze price action clearly
Most professional forex traders use candlestick analysis because it gives fast and visual market information.
Best Way to Start Learning Candlestick Charts
1. Learn Basic Candle Types
Start with simple candle structures:
Bullish candle
Bearish candle
Doji candle
Hammer candle
Shooting star
Mastering these basics creates a strong foundation.
2. Study Popular Candlestick Patterns
Some important candlestick patterns include:
Bullish Patterns
Hammer
Bullish engulfing
Morning star
Piercing line
Bearish Patterns
Shooting star
Bearish engulfing
Evening star
Dark cloud cover
These patterns help traders identify possible market reversals.
3. Practice on Demo Accounts
Never start with real money immediately.
Use demo trading accounts to:
Test strategies
Understand candle behavior
Build confidence
Reduce emotional mistakes
Practice is the fastest way to improve chart-reading skills.
4. Understand Market Trends
Candlestick patterns work better when combined with trends.
Uptrend
Higher highs and higher lows.
Downtrend
Lower highs and lower lows.
Sideways Market
Price moves within a range.
Always identify the trend before taking trades.
5. Learn Support and Resistance
Candlestick patterns become more powerful near support and resistance zones.
Support
A price area where buyers may enter.
Resistance
A price area where sellers may enter.
Combining candlestick analysis with support and resistance improves trading accuracy.
Most Powerful Candlestick Patterns for Beginners
Hammer Pattern
The hammer has:
Small body
Long lower wick
It usually appears after a downtrend and may signal a bullish reversal.
Shooting Star
The shooting star has:
Small body
Long upper wick
It often appears after an uptrend and may signal a bearish reversal.
Doji Candle
A doji forms when opening and closing prices are nearly equal.
It represents market indecision.
Engulfing Pattern
Bullish Engulfing
A large bullish candle fully covers the previous bearish candle.
Bearish Engulfing
A large bearish candle fully covers the previous bullish candle.
These patterns can indicate strong reversals.
Common Mistakes Beginners Make
Trading Without Practice
Many beginners rush into live trading without learning chart analysis.
Ignoring Risk Management
Never risk too much on one trade.
Depending on One Pattern
Candlestick patterns should be combined with:
Trend analysis
Support and resistance
Risk management
Emotional Trading
Fear and greed destroy trading discipline.
Best Timeframes for Learning Candlestick Charts
Beginners often learn faster using:
1-hour charts
4-hour charts
Daily charts
These timeframes reduce market noise and create clearer patterns.
How Long Does It Take to Learn Candlestick Trading?
Learning basics may take:
A few weeks for beginners
Mastering price action trading may take:
Several months
Consistent practice
Real market observation
Trading is a long-term skill.
Tools That Help You Learn Faster
Useful tools include:
TradingView
MetaTrader 4
MetaTrader 5
Forex demo accounts
Trading journals
Educational YouTube channels
These tools help traders study charts daily.
Benefits of Learning Candlestick Charts
Better Market Understanding
You learn how buyers and sellers behave.
Improved Entry Timing
Candlestick patterns help identify stronger trade setups.
Better Risk Management
You can place stop losses more effectively.
Increased Trading Confidence
Knowledge reduces emotional trading decisions.
Can You Earn Money Using Candlestick Analysis?
Yes, many traders use candlestick analysis to improve trading strategies. However, success depends on:
Skill
Discipline
Risk management
Experience
Emotional control
There is no guaranteed profit in forex trading.
Daily Routine for Learning Candlestick Charts
A beginner can follow this routine:
Study one pattern daily
Analyze historical charts
Practice on demo accounts
Keep trading notes
Review mistakes
Watch market behavior regularly
Consistency is more important than speed.
20 Frequently Asked Questions (FAQs)
1. What is a candlestick chart in forex?
A candlestick chart visually represents price movements in the forex market.
2. Why are candlestick charts important?
They help traders analyze market trends and price behavior.
3. Are candlestick patterns accurate?
They can be useful but are not 100% accurate.
4. Which candlestick pattern is best for beginners?
Hammer and engulfing patterns are popular beginner patterns.
5. Can I learn candlestick charts for free?
Yes, many free resources are available online.
6. How long does it take to master candlestick trading?
It may take months or even years of practice.
7. What is a bullish candle?
A bullish candle shows buyers controlled the market.
8. What is a bearish candle?
A bearish candle shows sellers controlled the market.
9. What is a doji candle?
A doji indicates market indecision.
10. Which timeframe is best for beginners?
1-hour and 4-hour charts are often easier for beginners.
11. Can candlestick charts predict the future?
No, they only help analyze probability and market behavior.
12. What platform is best for chart analysis?
TradingView and MetaTrader are popular choices.
13. Do professional traders use candlestick charts?
Yes, many professional traders use them daily.
14. Can I trade forex using only candlestick patterns?
It is better to combine them with other analysis methods.
15. What is price action trading?
Price action trading focuses on market movement without many indicators.
16. Are candlestick charts good for scalping?
Yes, many scalpers use candlestick analysis.
17. Is forex trading risky?
Yes, forex trading involves significant financial risk.
18. Can beginners learn forex trading?
Yes, with patience and consistent practice.
19. What is support and resistance?
These are key market price levels where reversals may occur.
20. What is the best way to improve trading skills?
Practice regularly and study market behavior daily.
Final Thoughts
Learning candlestick charts is one of the most important skills for anyone entering the forex trading world. Candlestick analysis helps traders understand market emotions, identify trends, and make smarter trading decisions. While mastering candlestick patterns takes time, consistent learning and practice can gradually improve your trading confidence and technical analysis skills.
Remember that forex trading is not a shortcut to instant wealth. Many successful traders spent years studying charts, controlling emotions, and building strong risk management habits. Candlestick charts are powerful tools, but they work best when combined with patience, discipline, and continuous learning.
If you truly want to grow in forex trading, focus on education first, practice on demo accounts, and develop a long-term mindset. Small daily improvements in chart analysis can eventually lead to better trading decisions and a deeper understanding of how financial markets move.
About the Creator
IFTIKHAR AHMAD
Passionate about Forex trading, digital marketing, and online business growth. I help people learn smart trading strategies, market trends, and ways to grow income online. Sharing valuable tips on FX trading, finance, entrepreneurship,
Enjoyed the story? Support the Creator.
Subscribe for free to receive all their stories in your feed.
Comments
There are no comments for this story
Be the first to respond and start the conversation.