
Candlesticks pattern & how to use its types of candlesticks & chart pattern
About trading candlesticks pattern & how to use it's where to find it & types of candlesticks & chart pattern

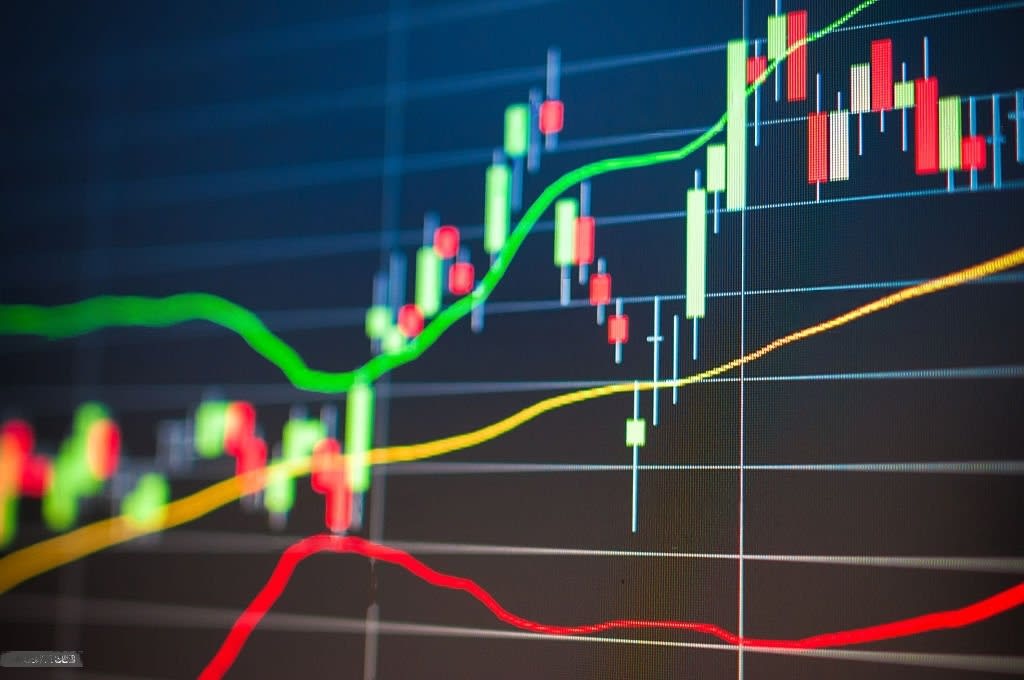
Candlestick patterns are graphical representations of price movements in financial markets, used by traders to make informed trading decisions. The patterns are created using "candlesticks," which consist of four price components: the opening price, the closing price, the highest price, and the lowest price.
To use candlestick patterns, traders look for specific formations that indicate potential trend reversals or continuation. Some common patterns include the "Doji," "Hammer," "Shooting Star," and "Engulfing Pattern."
Candlestick patterns can be found on various financial charts and can be used in combination with other technical analysis tools, such as trend lines and moving averages.
There are two main types of candlesticks: bull candlesticks and bear candlesticks. Bull candlesticks indicate bullish sentiment, while bear candlesticks indicate bearish sentiment.
In conclusion, candlestick patterns are a useful tool for traders, but it's important to use them in conjunction with other analysis methods and not rely solely on them.
It's also important to keep in mind that while candlestick patterns can be helpful in identifying potential trade setups, they are not a guarantee of future price movements. Traders should always consider other factors, such as market news and economic data, before making a trade.
It's also crucial to understand the context of the market when analyzing candlestick patterns. For example, a hammer pattern in a downtrend may indicate a potential bottom, but in an uptrend, it could be a warning of a potential top.
Additionally, different traders may interpret the same pattern differently, so it's important to develop a clear understanding of the pattern and how it fits into the larger market context.
There are many websites and charting platforms that offer candlestick charting, including TradingView, MetaTrader, and thinkorswim, to name a few. Some also offer real-time news and analysis to help traders stay up-to-date on market developments.
candlestick patterns can be a useful tool for traders, but it's important to understand how to use them and to always consider them in the context of the larger market.
How to determined chart pattern:
To determine trading chart patterns, traders typically use technical analysis tools, such as trend lines, support and resistance levels, and various chart formations (such as head and shoulders, double/triple tops and bottoms, etc.).
These patterns can help traders identify potential buying and selling opportunities in the market. However, it's important to note that chart patterns are not a guarantee of future market behavior, and multiple factors such as news events and economic data releases can impact market movements.
Traders use chart patterns in combination with other technical analysis tools, such as indicators and oscillators, to confirm their findings. Additionally, it's common for traders to use different time frames (such as 5-minute, hourly, daily, and weekly charts) to get a more comprehensive view of market trends and patterns.
When analyzing chart patterns, traders look for certain characteristics, such as:
Volume: An increase in volume during a pattern formation can indicate stronger market conviction and add credibility to the pattern.
Breakout: A decisive move above or below a key support/resistance level is known as a breakout and can signal a potential trend reversal.
Trend: The direction of the trend leading up to the pattern formation can provide important context and help traders gauge the potential for a sustained move in the direction of the breakout.
It's important to remember that chart patterns are just one of many tools used by traders in their analysis and decision-making process. Traders should also consider other factors such as fundamental data, market sentiment, and macroeconomic events to make informed trading decisions.
About the Creator
Emmanuel Andrew
"I am a blogger and researcher who loves to write content about adventurous experiences and knowledge to share with readers. With a passion for writing and a love of travel, I seek out fascinating new perspectives."
Keep reading
More stories from Emmanuel Andrew and writers in Trader and other communities.
All about The Wall Street Journal
Wall Street is one of the most iconic streets in the world, known for its bustling financial center and the global hub of capitalism. It is located in the heart of the Financial District in Lower Manhattan, New York City, and is home to some of the most influential financial institutions in the world. It is an eight-block-long street that runs from Broadway to South Street, and it is a symbol of the American economy and the global financial system.
By Emmanuel Andrewabout a year ago in Trader
All about the iphone 13 (128GB) — Midnight
In the changing world of technology few announcements create much buzz and excitement as the reveal of a new iPhone. Every year Apples top tier smartphone captures attention with its design, cutting edge features and user friendly interface. The debut of the iPhone 13 has stirred up curiosity and speculation amidst expectations. Apples commitment, to pushing boundaries in innovation is evident in the promises of the iPhone 13 to redefine possibilities in technology. With improvements in design, performance and functionalities the iPhone 13 is set to impress consumers and establish benchmarks for excellence in the smartphone market. Lets explore what sets the iPhone 13 apart and dive into the features that have sparked enthusiasm among both tech enthusiasts and everyday users.
By The Article On "purchases & services"5 days ago in Trader
Europeans reject Chinese cars.
China's car industry has changed over the course of the last ten years, from delivering fundamental western clones to making vehicles that equivalent the world's ideal. As the assembling force to be reckoned with of the world, China is likewise creating them in enormous volumes.
By Phumlani Mdlalose7 days ago in Trader
A Minute's Difference
It was a Tuesday, 2:58...59 in the afternoon. My friend Andy was white-knuckled gripping the edge of his school desk, staring desperately at the second hand of the clock slooowly circling round, while our teacher droned on and on. A girl behind me cracked her gum. Another classmate was fervently scribbling notes. I was trying to look just awake enough not to get called on. Wrapped in my grey hoodie, eyes drooping behind uncut bangs, head leaning on folded arms, I appeared the cliche of a bored teenage boy, on the verge of daydreaming his way into a more exciting life.
By Ellen Stedfeld5 days ago in Fiction


Comments
There are no comments for this story
Be the first to respond and start the conversation.