
Best Non-Repaint TradingView Strategy for Consistent Profits
I wasted three years chasing 'perfect' signals that vanished as soon as I hit buy. This is the raw truth about non-repaint strategies and the exact setup that finally stopped the bleeding.

The Death of the Repaint: My No-BS TradingView Strategy for Sanity and Real Profits
I wasted three years chasing 'perfect' signals that vanished as soon as I hit buy. This is the raw truth about non-repaint strategies and the exact setup that finally stopped the bleeding.
The Lying Eyes of Repainting Indicators
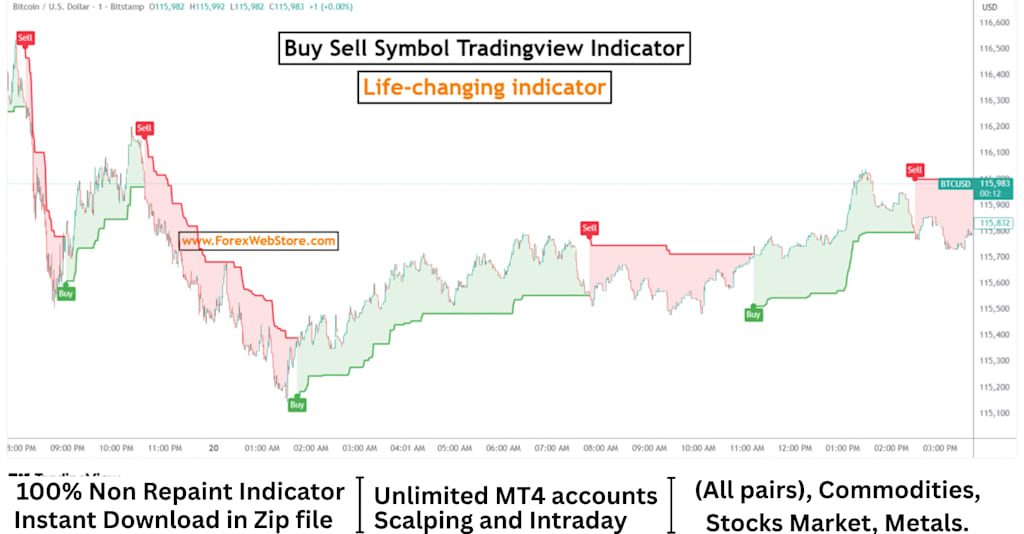
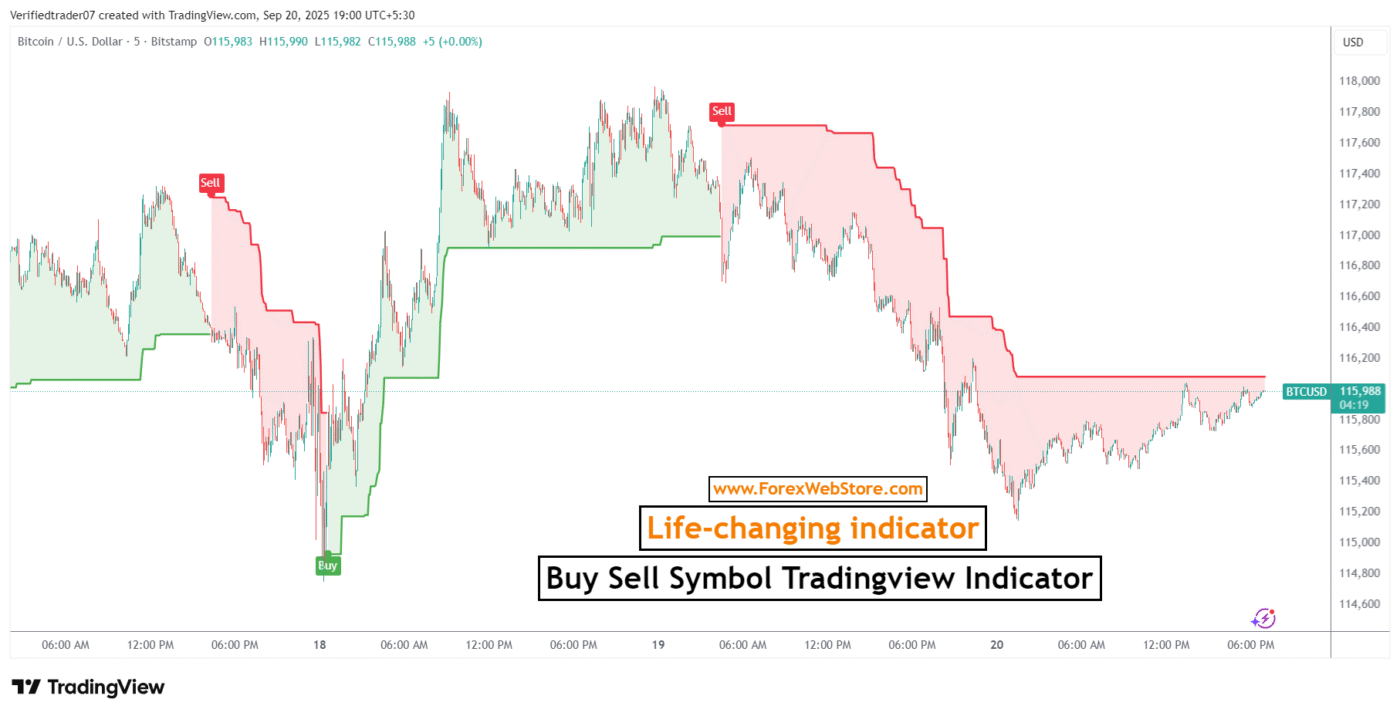
It was 10:00 AM. I was staring at a chart that looked like a neon Christmas tree. Green arrows, red circles, and golden crosses everywhere. On the historical chart, it looked like I had found the holy grail. Every signal was perfect. Every entry led to a massive moon-shot. I felt like a genius. I felt rich. But then I started trading it live. That beautiful green arrow that appeared at the bottom of a candle? As soon as the price dropped another ten pips, it just… vanished. It was a ghost. A lie. This is the soul-crushing reality of repainting indicators. They look back at history and rewrite their own failures to make themselves look profitable. They are the marketing department of the trading world—all flash, no substance. If you’ve ever felt like the market was specifically hunting your stop loss, you aren't crazy. You’re just using tools that lie to your face.
Why the Past Always Looks Better Than the Future
Think about it. Most of these 'magic' indicators recalculate based on future price action. Of course they look 100% accurate on a static chart! But you can’t trade the past. You can only trade the hard, cold 'now.' To find consistent profits, you need indicators that commit. Once a candle closes, the signal must stay there, whether it was right or wrong. That’s where the real journey begins. No more smoke and mirrors. Just data.
The Foundation: Price Action Meets the VWMA
The first thing I did to fix my PnL was strip everything off my chart. I went back to naked candles. It was terrifying. But then I added one specific tool: the Volume-Weighted Moving Average (VWMA). Unlike a standard moving average, the VWMA gives more weight to candles with high volume. It tells you where the 'big money' is actually fighting. If the price is above a 20-period VWMA and volume is surging, that’s a real trend, not a retail trap. Price action is the signal; volume is the confirmation. Forget the flashy 10-indicator overlays. You need to see the struggle between buyers and sellers.
Building the No-Repaint Framework
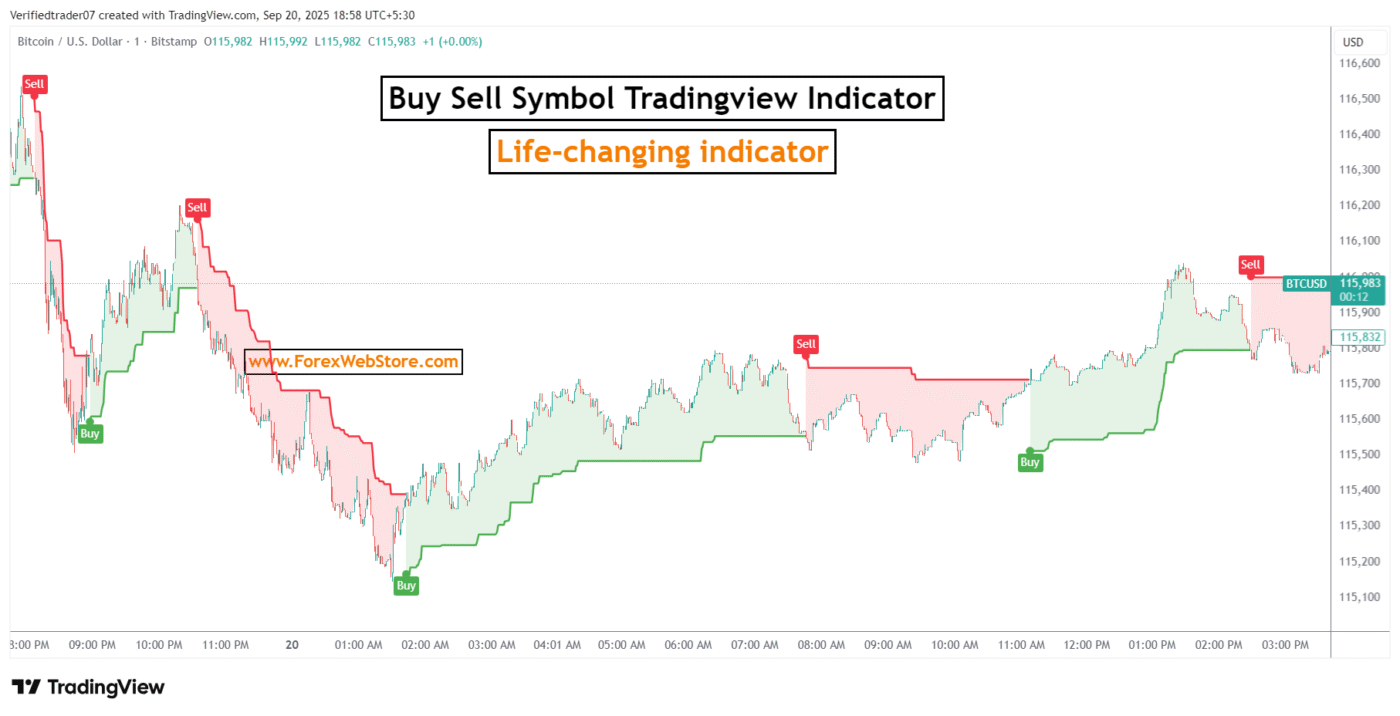
Here is the kicker: a strategy isn't just one indicator. It’s a filter. I use a combination of the VWMA (20) and a high-period RSI (14) set with strict boundaries. We aren't looking for 'oversold' or 'overbought' in the traditional sense—that’s a trap that’ll get you liquidated in a strong trend. We are looking for RSI Divergence. When the price makes a lower low but the RSI makes a higher low, and this happens while the price is reclaiming the VWMA? That’s a high-probability setup that won't disappear when you look away. This is how you build a non-repaint trading strategy that actually survives a live market.
Stop Chasing the 'Perfect' Entry
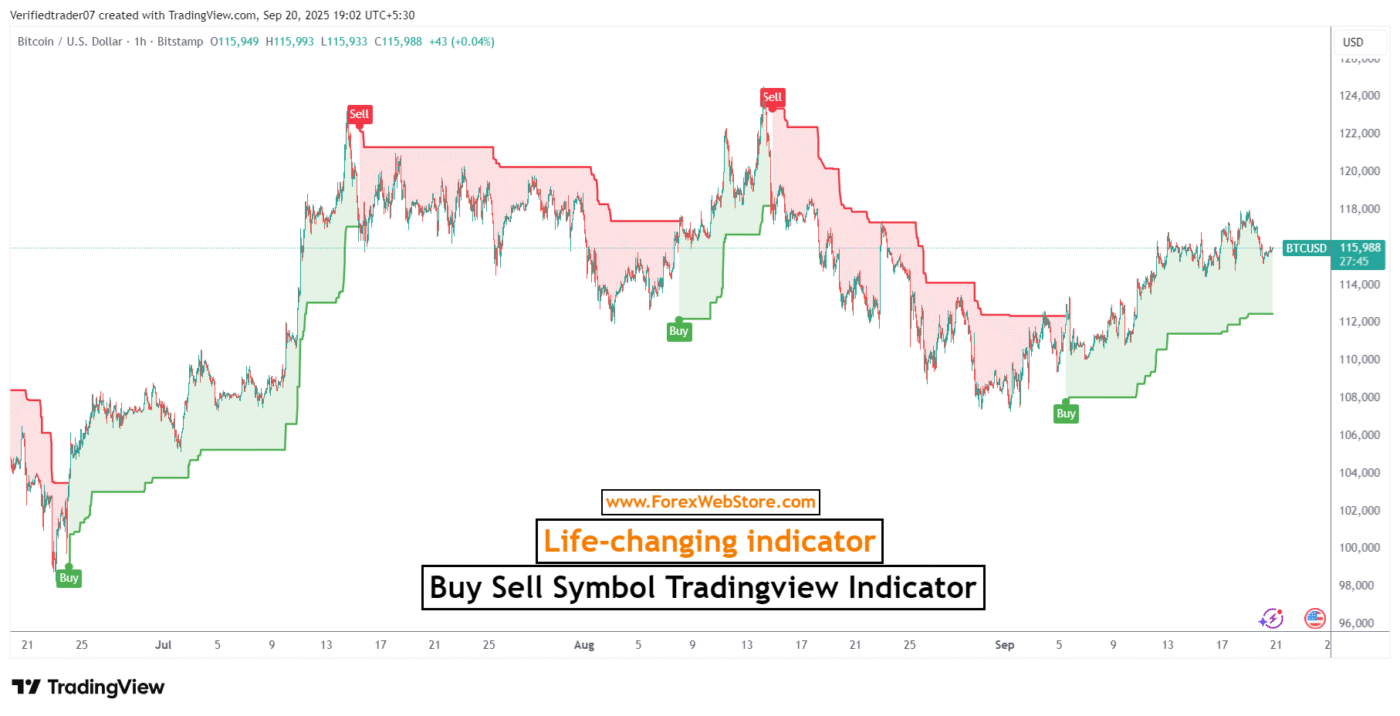
Here is a bitter pill to swallow: the entry is probably the least important part of your trade. I know, it sounds insane. We spend hours hunting for the 'perfect' pixel-perfect entry. But risk management is what keeps you in the game. I’ve seen traders with 40% win rates become millionaires, and I’ve seen traders with 90% win rates blow their accounts in a single afternoon. Why? Because they didn't know how to lose. Trading is a game of probability, not certainty. When you use a non-repaint strategy, you will have losing signals. The difference is that you can actually trust your backtesting data because the signals didn't cheat.
The 2% Rule and Mental Fortitude
I never risk more than 1.5% to 2% of my total account on a single trade. If my TradingView strategy gives me a signal, I take it, I set my stop, and I walk away. Watching the 1-minute chart is a recipe for a mental breakdown. You’ll start seeing ghosts. You’ll start second-guessing the non-repaint signals. You’ll exit too early or move your stop. The market is a giant machine designed to separate you from your money by exploiting your emotions. The only way to win is to become as cold as the machine itself. Use your technical analysis to set the trap, then let the market walk into it.
The Setup: Step-by-Step Integration
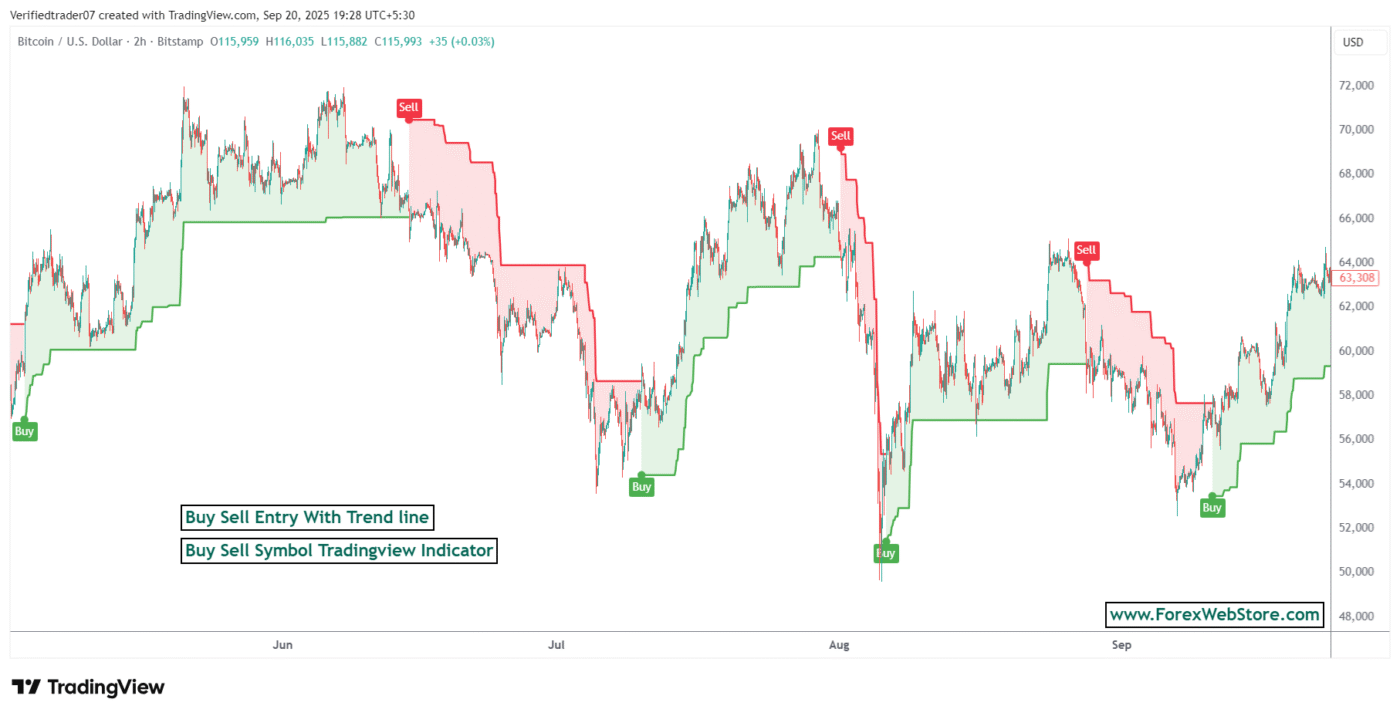
Let’s get tactical. Open TradingView. Clear your chart. Add the Volume-Weighted Moving Average. Then, add a standard Relative Strength Index. But here is the secret sauce: look for 'confluence.' A signal is only valid when the price is bouncing off a structural level (support/resistance) AND the VWMA is trending AND the RSI is showing strength. If you only have one of those, you don't have a trade. You have a gamble. Profitable day trading is about waiting for the stars to align, not forcing a trade because you’re bored or desperate.
Backtesting: Your Only Real Friend
Don't take my word for it. Don't take any 'guru’s' word for it. Use the 'Bar Replay' tool on TradingView. Go back six months. Click through candle by candle. Every time your criteria are met, record the result in a spreadsheet. This is how you build conviction. When you hit a three-trade losing streak—and you will—the only thing that will stop you from abandoning your system is the data sitting in that spreadsheet. It tells you that over 100 trades, this system makes money. That’s the difference between a gambler and a professional.
Conclusion: The Path to Freedom
There is no such thing as a 100% win-rate strategy. If someone sells you one, run the other way. The best TradingView indicators are the ones that give you an edge over a large sample size. This isn't a get-rich-quick scheme; it’s a business. It requires discipline, a lack of ego, and the ability to accept that you will be wrong sometimes. But when you stop using tools that lie and start using a non-repaint methodology, the fog clears. You stop trading with hope and start trading with math. And that, my friend, is where the consistent profits live. It’s not about being right; it’s about being profitable. Take the leap, clean up your charts, and start treating this like the profession it is.
About the Creator
Alex John
Today I will share with you how to trade option trading. Although this indicator is made for Stock Market, Forex Market if you work in other pairs then you can use it. Like:- Nifty, Banknifty, XAUUSD, EURUSD, USDCAD, EURCHF, GBPUSD,etc.
Enjoyed the story? Support the Creator.
Subscribe for free to receive all their stories in your feed.
Comments
There are no comments for this story
Be the first to respond and start the conversation.