
All about the trader's candlestick types & usage
a candlestick are used to determine possible price movement based on past patterns in technical analysis

Trading candlesticks, also known as Japanese candlesticks, are a type of charting tool used in technical analysis to track and analyze price movements of financial instruments such as stocks, currencies, and commodities. The use of candlestick charts originated in Japan in the 18th century and have since become a popular tool among traders and investors worldwide.
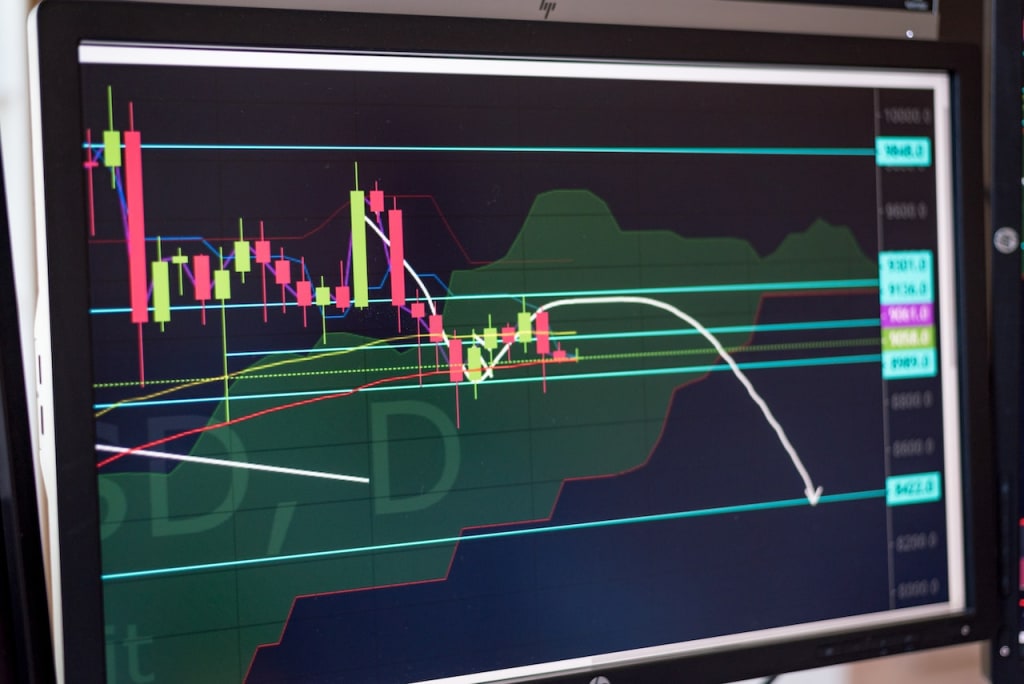
Candlestick charts provide a visual representation of price movements and are based on the open, high, low, and close (OHLC) prices of a financial instrument over a specified period of time. Each candlestick represents a unit of time, such as one day, one hour, or one minute, depending on the trader's preference. The candlestick is made up of two main parts: the body and the wick or shadow.
The body of the candlestick represents the difference between the opening and closing prices of the financial instrument over the given time period.
If the closing price is higher than the opening price, the body is typically colored green or white, indicating a bullish or positive trend. If the closing price is lower than the opening price, the body is typically colored red or black, indicating a bearish or negative trend.
The wick or shadow of the candlestick represents the highest and lowest prices reached during the specified time period. The length of the wick can indicate the level of volatility or uncertainty in the market during that time period. If the wick is long, it can suggest that traders are uncertain about the direction of the market or that there is a lot of volatility. If the wick is short, it can suggest that there is a clear trend and that the market is stable.
There are several types of candlestick patterns that traders use to identify potential market trends and make trading decisions. Here are some of the most common types:
Hammer: A hammer candlestick pattern is formed when the opening and closing prices are close to each other, but the low of the candle is significantly lower than the opening and closing prices. This pattern can suggest that the market is potentially reversing from a downtrend to an uptrend.
Doji: A Doji candlestick pattern is formed when the opening and closing prices are almost the same, resulting in a small or non-existent body. This pattern can suggest that the market is uncertain about the direction and may potentially reverse.
Engulfing: An engulfing candlestick pattern is formed when one candlestick engulfs the previous candlestick. This pattern can suggest a potential reversal in the market direction.
Dark cloud cover: A dark cloud cover candlestick pattern is formed when a bullish candle is followed by a bearish candle that opens above the previous candle's high and closes below the previous candle's midpoint. This pattern can suggest a potential reversal in the market direction.
To use candlesticks in trading, traders first need to identify the time period they want to analyze, such as a day, an hour, or a minute. Once the time period is identified, traders can start looking for patterns in the candlestick chart to make trading decisions.
For example, if a trader sees a hammer candlestick pattern forming after a period of downtrend, they may interpret it as a potential signal that the market is reversing and start looking for buying opportunities. Similarly, if a trader sees an engulfing pattern forming after a period of uptrend, they may interpret it as a potential signal that the market is reversing and start looking for selling opportunities.
It is important to note that candlestick patterns are not 100% accurate and should be used in combination with other technical analysis tools and risk management strategies. Traders should also be aware of market trends, news events, and other external factors that can affect the price of the financial instrument being traded.
In conclusion, trading candlesticks are a popular and useful
About the Creator
Emmanuel Andrew
"I am a blogger and researcher who loves to write content about adventurous experiences and knowledge to share with readers. With a passion for writing and a love of travel, I seek out fascinating new perspectives."
Keep reading
More stories from Emmanuel Andrew and writers in Trader and other communities.
The Rollercoaster Ride of a Trader's Career
Unveiling the Drama and Humor Behind the Trading World Wanted: Adventurous souls with nerves of steel, a passion for numbers, and a flair for risk-taking. Does this sound like you? Welcome to the chaotic and exhilarating world of trading. Strap yourself in for a wild ride filled with highs and lows, thrills and spills, wins and losses. In this article, we'll delve into the heart-pounding journey of a trader's career, where drama and humor mingle in a dance of chaos and order. Hold on tight as we explore what it truly means to embark on a path where fortunes are made and lost in the blink of an eye.
By Max Gachet6 days ago in Trader
Faedaze
Daisy leaned back against the wall of the window bench, the dress she was embroidering on falling to her lap, all but forgotten. Her gaze rested on the trees just beyond the edge of her garden, watching with dreamlike expression on her face, waiting for something others doubted would ever come.
By Kelsey Clarey5 days ago in Fiction


Comments
There are no comments for this story
Be the first to respond and start the conversation.