
7 Proven VWAP Trading Strategies That Absolutely Crush the Market.
Unlock the secret weapon of institutional traders. This guide covers everything you need to know about VWAP trading, from basic setups to advanced strategies that generate real alpha.
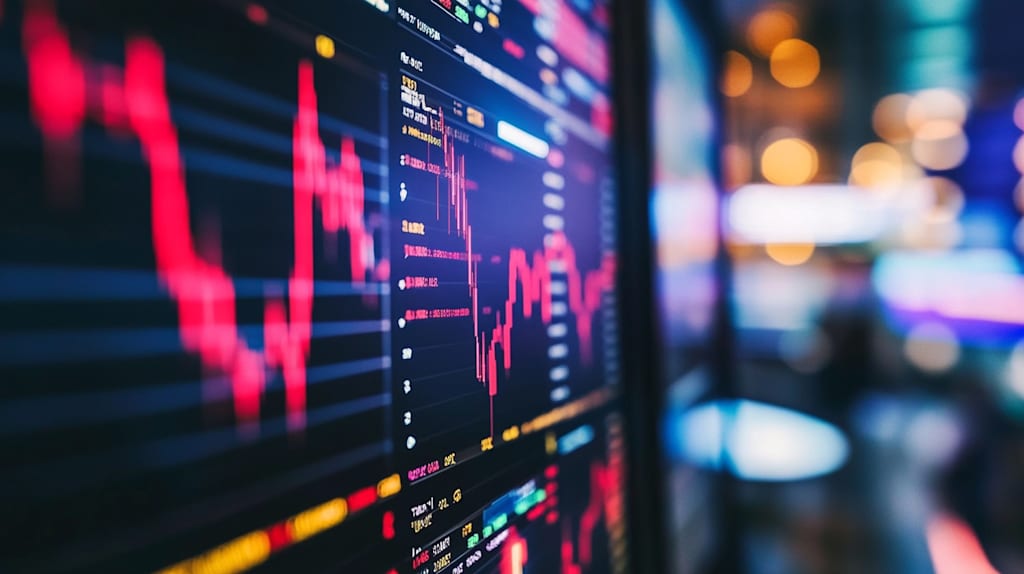
You’re sitting at your desk, coffee in hand, watching the charts. The candles are wiggling left and right. You see a breakout, you buy... and then it immediately dumps. You see a dip, you short... and it rips higher. Sound familiar?
Most retail traders are flying blind. They’re looking at patterns, maybe an RSI or a Moving Average, but they’re missing the one line that matters more than any other. It’s the line that hedge funds, algorithms, and market makers use to judge every single trade.
That line is VWAP.
VWAP trading isn’t just a fancy acronym; it’s the difference between guessing and knowing where the "fair value" of a stock really is. If you aren’t using it, you’re leaving money on the table. Period.
In this guide, we’re going to strip away the complex math and turn VWAP into your new best friend. By the end, you’ll have 7 strategies you can use tomorrow morning—whether you trade stocks, crypto, or futures.
What is VWAP Trading?
Let’s start simple. VWAP stands for Volume Weighted Average Price.
Forget the textbook definition for a second. Think of it like this: If you bought 1 share of Apple at $150 and 1,000 shares at $152, your average price isn't $151. It’s much closer to $152, right? Because that’s where you put the most money.
That’s VWAP. It’s the average price of a stock, weighted by how much volume happened at each price level.
Unlike a standard moving average that just cares about time, VWAP cares about activity. It tells you the true average price that everyone has paid for the stock throughout the day. When the price is above VWAP, the buyers are winning. When it’s below, the sellers are winning. It’s that simple.
Why Every Serious Trader Needs to Know VWAP
Imagine you’re a mutual fund manager. You need to buy 5 million shares of Tesla. If you just slam a market buy order, the price will skyrocket, and you’ll get a terrible entry. You’d be moving the market against yourself.
So, what do you do? You break the order into tiny pieces. You buy a little here, a little there. Your goal? To buy below the VWAP for the day. If you can get your average fill price below the day’s VWAP, you know you got a good deal. You beat the market average.
This is why VWAP trading is so powerful. You’re essentially piggybacking on the algorithms of the biggest players. When price pulls back to VWAP, algorithms often step in to buy because it’s considered "fair value." You’re not fighting the trend; you’re joining the institutions.
The VWAP Formula Explained (Without the Headache)
Okay, I promised no math class, but you need to see this once so you trust it.
VWAP = (Typical Price × Volume) / Total Volume
There are two parts here:
Typical Price (TP): (High + Low + Close) / 3
Volume: The number of shares traded.
For every single candle, the computer takes the Typical Price, multiplies it by the volume, and keeps a running total. Then it divides by the total volume of the day.
Coach’s Note: You never have to calculate this by hand. But understanding that volume is the engine here is key. No volume = VWAP doesn't move.
Typical Price: The Hidden Gem
Why do we use (High + Low + Close) / 3 instead of just the Closing price?
Because the close is just one moment in time. The High and Low tell the story of the battle that happened during the candle. By averaging all three, you get a much more honest picture of what the price actually did during that period. It smooths out the noise.
VWAP vs. Simple Moving Average (SMA)
This is where most people get confused. "Isn't VWAP just a moving average?"
No. And the difference is massive.
Feature Simple Moving Average (SMA) VWAP
Calculation Averages closing prices over X periods. Averages price weighted by volume.
Lag Very Laggy. Reacts slow. Fast. Reacts to volume spikes.
Reset Continuous (rolls over). Resets every single day.
Best For Long-term trend direction. Intraday entry/exit.
Why Your 20 EMA is Lying to You
I love the 20 EMA. But here’s the problem: It treats a candle with 100 shares of volume the exact same as a candle with 1 million shares.
That’s stupid.
A move on low volume means nothing. A move on high volume means everything. VWAP ignores the low-volume noise and focuses only on where the big money is trading. If price crosses your 20 EMA on low volume, it’s probably a trap. If it crosses VWAP on high volume? That’s the real deal.
How to Add VWAP to Your Charts
Enough theory. Let’s get you set up.
On TradingView
Open a chart.
Click "Indicators" at the top.
Type "VWAP".
Click it. Done.
On Thinkorswim (TOS)
Go to the "Studies" tab.
Search for "VWAP".
Double-click it.
Pro Tip: In the settings gear, you can change the color to something bright like Cyan so you don’t miss it.
Standard Settings: Do You Need to Change Them?
No.
Leave it alone. The standard setting is 1 period (which really means "since the open").
The only time you change this is if you use "Anchored VWAP," which we’ll talk about later. For day trading, the default daily VWAP is perfect. It resets every morning at 9:30 AM ET, giving you a fresh slate.
The Trend Confirmation Strategy
This is the easiest way to start. It keeps you on the right side of the market and stops you from trying to catch falling knives.
The Rule:
If Price > VWAP = Only Look for Longs
If Price < VWAP = Only Look for Shorts
That’s it. It’s your trend filter.
The "Morning Range" Breakout
The first 30 minutes of trading (9:30 - 10:00 AM ET) is chaos. Algorithms are fighting for position. Let them fight.
Wait for the range to set.
If the price breaks above the morning high and is holding above VWAP, go long.
If the price breaks below the morning low and is holding below VWAP, go short.
Why it works: The breakout shows intent. VWAP confirms the trend is healthy.
The Mean Reversion "Rubber Band" Play
This is my personal favorite. It’s lower risk and has a higher win rate. We are betting that price acts like a rubber band—it stretches away from VWAP, but eventually snaps back.
The Setup:
Identify a strong trend (e.g., price is making higher highs).
Wait patiently for the price to pull back and touch the VWAP.
Look for a bullish candle (green hammer, engulfing) right on the line.
BUY.
You are buying a dip to the "fair value" in a strong uptrend. The institutions who missed the first leg up are waiting here to buy. You’re joining the party late, but right when the music gets good again.
Identifying True Pullbacks vs. Trend Reversals
How do you know if the touch will hold? Volume.
Good Pullback: Price touches VWAP on low volume. Sellers are exhausted.
Bad Pullback (Reversal): Price touches VWAP on massive volume. Big sellers are dumping. Run away.
The VWAP Divergence Signal
This is a bit more advanced, but pure gold. Divergence happens when the price does one thing, but the indicator does another.
Bullish Divergence Setup:
Price makes a Lower Low.
VWAP makes a Higher Low.
What this means: Even though the price dropped, the average price paid by everyone went up. This shows hidden buying pressure. The sellers are losing power. This often signals a massive reversal back up toward the VWAP.
Institutional Algorithms and VWAP Targeting
You need to understand why VWAP acts as support and resistance. It’s not magic. It’s math.
Big banks have execution algorithms (like Goldman Sachs’ "Guerrilla") that are programmed to buy when the price dips below VWAP and sell when it pops above.
They do this to ensure their average price is close to the day's VWAP. If they buy too high, their fund underperforms. If they buy too low, they look like heroes.
So, when you see price hit VWAP and bounce, it’s often not retail traders. It’s a wall of institutional buy orders sitting right there. You’re surfing their wave.
The "Fair Value" Magnet Effect
Think of VWAP as a magnet. If price gets too far away (overextended), the magnet pulls it back.
Extension Rule of Thumb: If the price is 2-3% away from VWAP (depending on the stock's volatility), it’s extended. Don’t chase it. Wait for the pullback.
Combining VWAP with Other Indicators
VWAP is great, but it’s better with a co-pilot. Never use just one indicator.
VWAP + RSI
Long Setup: Price pulls back to VWAP + RSI is Oversold (<30).
Short Setup: Price rallies to VWAP + RSI is Overbought (>70).
This is a high-probability confluence.
VWAP + VWAP Band
Some platforms let you add "Bands" to VWAP (usually 1 or 2 standard deviations).
The Play: If price touches the lower VWAP band, it’s statistically extremely cheap. A long bounce is highly likely.
The #1 Mistake Traders Make with VWAP
I see this kill accounts every week.
The Mistake: Thinking VWAP is a magic forcefield.
Traders see price hit VWAP and blindly buy. But what if the whole market is crashing? What if the company just released terrible earnings?
VWAP does not work in a vacuum.
If the overall market (SPY) is down 2% and breaking support, VWAP support on your individual stock will fail. Context is King. VWAP is just the Queen.
Why VWAP Fails in Choppy Markets
If a stock is trading sideways in a tight range with no volume, VWAP will flatten out and weave through the candles. It becomes useless.
VWAP only works when there is VOLUME and DIRECTION. If the line is flat and price is hugging it, walk away. There’s no trade there.
Stop Loss Placement: The ATR Method
Okay, you got your entry at VWAP. Where do you put your stop loss?
Don't use a fixed number like "$0.10." That’s amateur hour. Use ATR (Average True Range).
Add the ATR indicator to your chart (14 period).
Look at the ATR value. Let's say it's $0.50.
Place your stop loss 1.5x ATR behind VWAP.
Example: $0.50 x 1.5 = $0.75 stop.
This adjusts your risk to the stock's volatility. A volatile stock gets a wider stop; a boring stock gets a tighter stop. Smart risk management.
Anchored VWAP (AVWAP): The Pro Secret
This is the cheat code.
Standard VWAP resets every day. But what if you want to see the average price since the start of the uptrend last Tuesday?
You can "Anchor" the VWAP.
How to do it (TradingView):
Add VWAP.
Go to settings (gear icon).
Check the box "Anchored VWAP".
Click on the chart where the trend started (e.g., the swing low).
Now, the VWAP line calculates from that specific point. It becomes a massive support/resistance level for weeks, not just one day. Swing traders live off this.
Backtesting Your VWAP Strategy
Don't bet real money yet. Go back in time on your chart.
Scroll back 100 days.
Mark every time price touched VWAP in a trend.
Did it bounce? Did it crash through?
Write it down.
If you see that it bounces 60% of the time in an uptrend, you have an edge. Now you can trade it live with confidence.
The Self-Fulfilling Prophecy of VWAP
Why does VWAP work? Because we all believe it works.
It’s a classic self-fulfilling prophecy. Thousands of traders are watching that line. When it gets hit, they all click "Buy" at the same time. That buying pressure causes the bounce.
It doesn’t matter if it’s "real" support. If enough people trade it, it becomes real support. And right now, VWAP is one of the most watched lines on Wall Street.
Frequently Asked Questions
Is VWAP good for crypto trading?
Absolutely. Crypto trades 24/7, so the standard daily VWAP (9:30-4:00 ET) is less relevant. Instead, use Anchored VWAP from the start of a major swing, or use a 24-hour rolling VWAP if your platform allows it.
Which time frame is best for VWAP trading?
The 1-minute, 2-minute, and 5-minute charts are the sweet spot. VWAP is an intraday indicator. Don't use it on the daily or weekly chart; it will just look like a normal moving average.
Does VWAP work on forex?
It’s tricky because forex is decentralized—there is no "official" volume data. Most forex VWAP indicators use tick volume (number of price changes), which is a decent proxy but not perfect. It’s better for futures or stocks.
Should I sell when price crosses below VWAP?
Not necessarily. If you’re in a long trade, a cross below is a warning sign to tighten your stop loss. Wait for a candle to close below VWAP before considering an exit. Wicks can fake you out.
What is the difference between VWAP and MVWAP?
MVWAP is the "Moving Volume Weighted Average Price." It’s basically an average of VWAP values over a few days. It’s much smoother and used by long-term funds, not day traders. Stick to standard VWAP for now.
Why is my VWAP line different on Robinhood vs TradingView?
This is rare, but can happen if the data feed calculates volume slightly differently. TradingView is generally the gold standard for charting accuracy.
Is VWAP Trading Right for You?
Let’s be honest. Trading is hard. 90% of people lose money.
But VWAP trading levels the playing field. It takes the emotion out of "is this price too high?" The math gives you the answer.
If you’re tired of buying tops and selling bottoms...
If you want to trade with the institutions instead of against them...
If you’re willing to be patient and only take the A+ setups...
Then yes. VWAP is for you.
Start with the Trend Confirmation strategy tomorrow. Just watch. See how price respects the line. Then, try one "Rubber Band" bounce trade with a small size.
Master this one indicator, and you’ll be ahead of 90% of the traders staring at lagging RSI and MACD crosses. The big money is waiting on the line. Go join them.
About the Creator
Pressura360
I am the creator of the pressura360.com web app.
I am a passionate writer for the health and wellness.
Enjoyed the story? Support the Creator.
Subscribe for free to receive all their stories in your feed.
Comments
There are no comments for this story
Be the first to respond and start the conversation.