
How to Forecast Sales for a Biotech Company?
Forecasting sales for biotech is not as direct as other businesses


Biotech firms develop drugs and medicines using live organisms. It is different from pharma which produces drugs from chemical-based materials. Big companies, such as Pfizer, Johnson & Johnson, and Ely Lilly, engage in both. Especially this pandemic, both biotech and pharma companies have a huge surge in sales due to the production of COVID-19 vaccines.
Large pharma and biotech businesses can withstand heavy losses even if the research & development (R&D) of a certain product fails since they already have product portfolios bringing sales for the company. However, if you are a start-up and have no portfolio of products yet, you might not withstand such great losses. That’s why it is crucial to do thorough financial planning before starting your pharma or biotech investment. It is to know whether you stand a chance when you compete with big companies and start a pharma or biotech company.
There are critical points to account for and ensure accurate projections when computing for pharma or biotech sales. We will present below all these key factors which is better captured in pharma or biotech financial modeling.
Projecting Sales
a. Biotech Companies are selling through Sales Channels
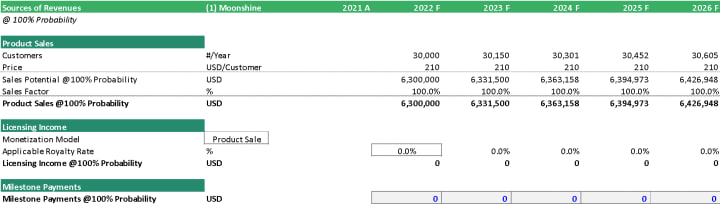
Sales for biotech companies may come in various forms. You can earn through product sales, licensing, and milestone payments. We will discuss each one in detail below.
● Product Sales – product distribution has the highest possible profit margins. However, you should also set up distribution lines by hiring staff, doing promotions, and arranging logistics in place.
● Licensing – if you plan to earn through licensing, the partner companies do the distribution for you. You then charge a certain percentage for licensing fee. You may not incur any costs for the distribution.
● Milestone payments – are pre-determined fees commonly provided by larger pharma or biotech companies for the development or discovery of products. After the agreed milestone is achieved, a percentage of the agreed amount is released. Payments are smaller at earlier milestones, and it increases until paid in full when the products are ready for distribution. Show in the table below is a sample presentation per sales channel.
b. A Product Portfolio hedges the Risk
The business will be at most risk when only focused on one or very few products. As much as possible, you should add a list of products to your product portfolio to diversify the risk. Even when a few products fail, you still have other products out in the market for distribution and provide earnings for the firm.
The table below is a sample list of vaccines with their corresponding phases of development, success probability, and on/off mechanism for consolidation. We will discuss success probability and on/off mechanism for consolidation in the next subtopics.
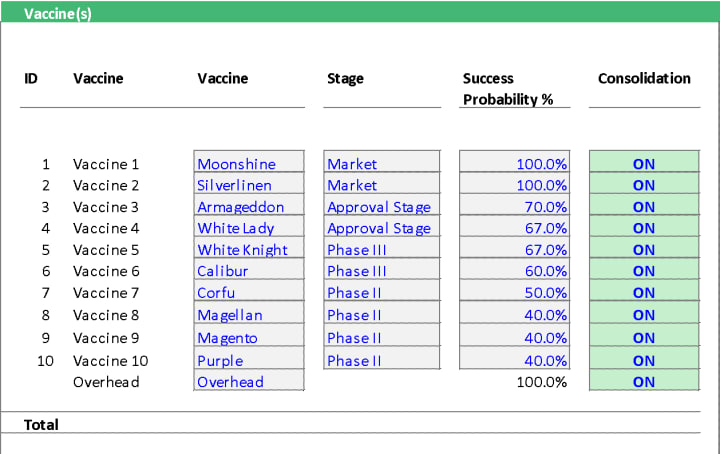
c. Every Product has its own Success Probability
Product discovery and development is a risky endeavor. There is no assurance that a product will be a success. Putting a success probability rate depending on the production phase will determine the percentage of a product's total revenue—the earliest the product is in the development stage, the lower the success probability rate. A probability rate of 20% means only 20% of the total revenue for that product will be accounted for when computing for sales.
d. Scenario Simulations lead to different Valuations
Utilizing a pharma or biotech financial modeling will aid in a better forecast of the company’s sales. This model here has an on/off mechanism in which you can “turn on” a product you want to include in the projection then “turn off” if you want it to be excluded. It is a helpful mechanism when evaluating sales and overall viability for different product combinations.
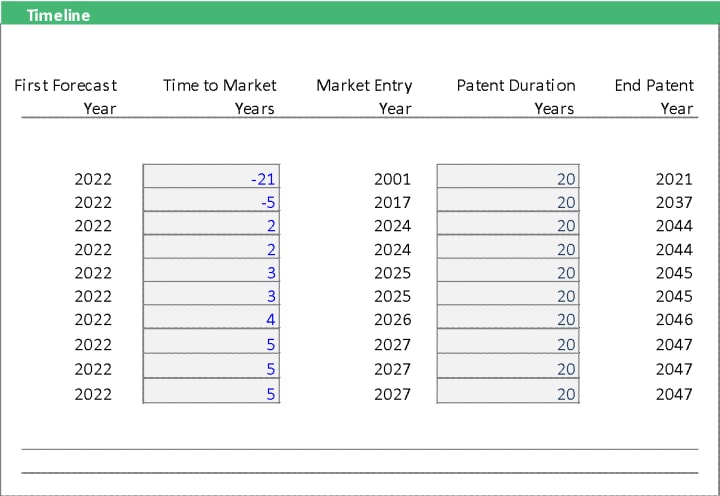
e. The Patent Period normally secures higher profits
Patent products are exclusively produced by the innovator company and command higher prices than generic drugs. Patent years usually are 20 years. Once the patent expires, prices will generally drop. Other companies can then produce similar products after approval from Food and Drug Administration (FDA). Patent years are a privilege for the innovator for the costs they incur for the research and development. Once it expires, it is not renewable.
f. Estimating the Timelines from R&D to Market Launch
In the timeline section of your pharma or biotech project analysis, you can input the number of years when some products are already out in the market and the projected year of products in development phases. The timeline also shows the patent duration and when it will expire. It will help you assess the timing and project the decrease in prices and production volumes once the patent expires.
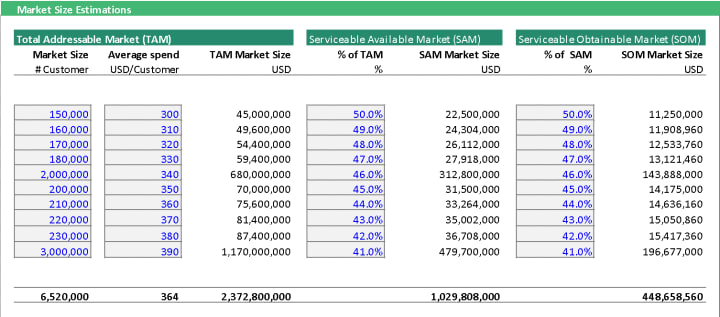
g. The Market Size Estimation defines the Potential of the Product
Identify your target market – the demographics you cater to, location, and needs of your prospective customers. You can then multiply the number of target customers by the average spend per customer to get the Total Addressable Market (TAM). Out of the Total Addressable Market, you can project a certain percentage based on your research and assumptions to derive the Serviceable Available Market (SAM). SAM is further classified into Serviceable Obtainable Market (SOM). SOM is the basis when projecting pharma or biotech sales. Shown below is the table for the market size estimation sample.
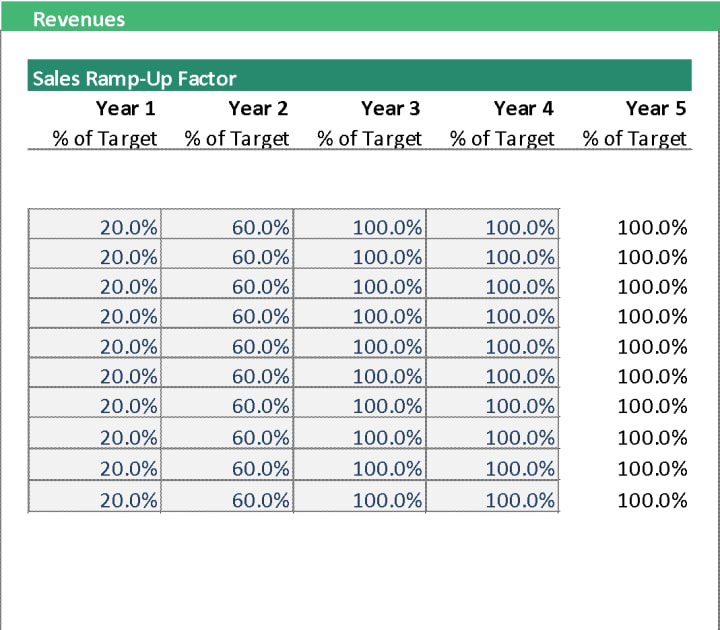
h. Sales are going to Ramp-up upon Launch
It is a vital mechanism to capture the year-on-year sales increase per product until it reaches 100%. Sales ramp-up is lesser in the first year and will increase in the succeeding years as you already establish your brand.
i. Revenues can be different between Patent and Post Patent Period
The table below shows the revenue estimations during patent and post-patent years. Post-patent has Customer Adjusted Percentage and Price Adjusted Percentage to capture the expected decrease in the number of customers and prices after the patent expires.

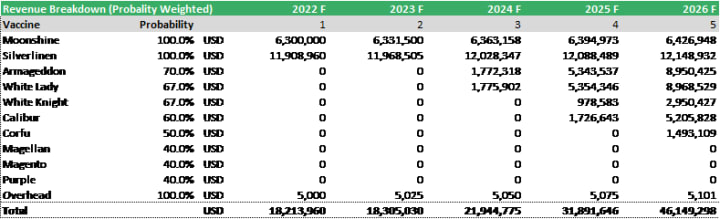
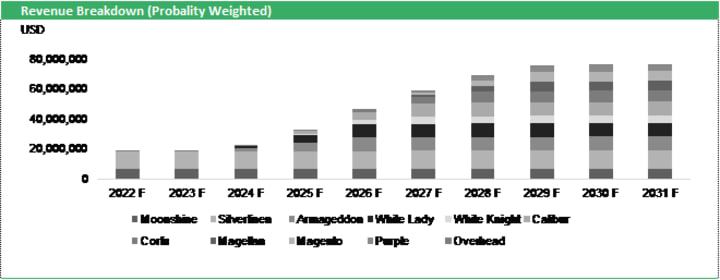
j. Revenue Breakdown is Probability Weighted per product to capture risk
As you can see in the table below, per product revenue is probability weighted. It captures the risk per product depending on their phases. Since revenues are breakdown per product probability, the projection is more accurate and reliable.
Fast track your sales forecasting and financial planning using a financial model template!
Forecasting sales for pharma or biotech companies are not simple as quantity multiplied by price. There are various critical points to consider to ensure accurate projection, and all variables are taken into account. To help in your sales forecasting, a financial model template for a biotech company is a helpful financial planning tool. Aside from sales forecasting, financial models are equipped with critical metrics and analysis necessary to evaluate the overall feasibility of your project.
About the Creator
Lellith Garcia
Lellith Garcia is the Marketing Manager of eFinancialModels.com, which provides a rich inventory of industry-specific financial model templates in form of Excel spreadsheets.
Keep reading
More stories from Lellith Garcia and writers in Journal and other communities.
How to do a Feasibility Study for your Grocery Store?
Products sold in grocery stores are primarily fast-moving consumer goods. Mark-up is low, but items are sold in bulk. Also, starting a grocery store does not need significant initial investment. However, the barrier to entry is low, making this industry a competitive one.
By Lellith Garcia3 years ago in Journal
Another Factor That Separates Sages From Masters
Read to the End to Help "Change The World" with our Earth Week Impact Launch Initiative! --- In my article The 8 Stages to a Quality Career, I detailed each of the steps one must go through to advance to the highest levels in any Industry.
By Cody Dakota Wooten, C.B.C.a day ago in Journal
Alekos Panayi aka Alex - A Businessman in the Retail Industry From South Africa
Alekos Panayi aka Alex is an renowned businessman in the retail industry who is admired for his strategic talent and his endeavors. Actually he is the one who put his efforts into starting a business in retail. He is very innovative and has leadership qualities. Having innovative natures is the reason that he came up with the results which make him famous in the Food Lovers Market. With his endeavors, he has established his number one position as the preeminent franchise in South Africa.
By Angel Dipti2 days ago in Journal


Comments
There are no comments for this story
Be the first to respond and start the conversation.