
5 BIG reasons how data visualization improves business decision making
How data visualization improves

Leaders need to make critical business decisions every day. And data visualization is a great supporting tool in this process. But, how data visualization improve decision making?
For that, you first need to understand what data visualization is.
Data visualization
Data visualization is a pictorial representation of data. It is the process of collating data from various sources, organizing it, analyzing it, and presenting it through charts and graphs. Thus, helping end-users to decipher complex data more quickly and accurately.
Let us see in detail how data visualization improves decision making.
Another way data visualisation helps firms make better decisions is by allowing them to create personalised reports and gain actionable insights.
These customisable reports allow you to connect with the data in a more personalised way. Furthermore, users can add or remove data fields to suit their needs.
Another significant advantage of employing visual data representation is that it is easily understood by all resources and parties concerned.
5 BIG reasons how data visualization improves business decision making
Fastens the decision making process
Around 65% of people are visual learners. When data is presented to us in the forms of graphs and charts, it becomes easily decipherable and has a longer-lasting impact on our minds. Thus, making it easier for decision-makers to understand the data and take action promptly.
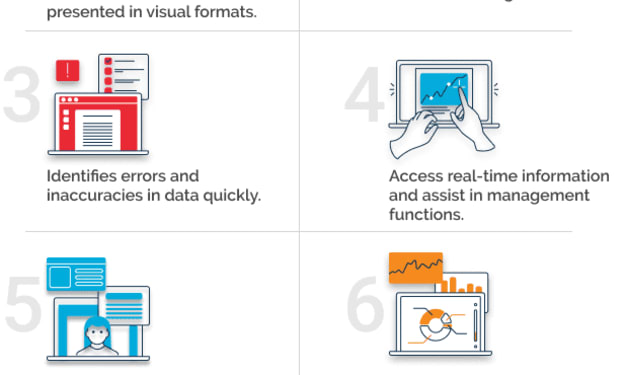
Improves accuracy
Data analysts collate data from different sources, verify the same, analyze it and then present it. So, when a top-level manager reviews the same, he needn't spend time on authenticating the data source or analyzing the numbers. Instead, DataViz serves information on a platter in the form of dashboards and reports.
Real-time reports
We generate more than 2.5 quintillion bytes of data every day. So, it hardly takes time for data to become obsolete. But, to make relevant decisions that are in sync with market trends, decision-makers need access to real-time data. And data visualization precisely does that – it empowers the users with real-time data accessible from any device and location.
Personalized communications
Gone are those days when decision-makers had to go through 10 charts and graphs to see exactly what they needed. The modern DataViz tools have enhanced the users' experience of decision-making. Not only is data presented in a more interactive form, but different filters and slicers make the reports highly customized. Thus, users can interact with only relevant and specific data.
All-inclusive decision
Since BI tools can collate data from scattered locations and present it in a compiled dashboard, it becomes easier for business leaders to make holistic decisions. For example, which one would you prefer more – getting the sales data from all your channels in one place or going through individual reports and then trying to draw your marketing strategy? In short, data visualization helps in making more data-driven decisions. The traditional representation of data and the visual display of data are vastly different.
The crucial information is not highlighted in traditional data. To hand-pick important data, you must literally dig into the entire data set. Visuals, on the other hand, choose and accentuate the most significant metrics.
The ability to manipulate real-time data is one of the most important aspects of data visualisation. Advanced visualisations including as charts, graphs, bars, and more are used in actionable dashboards and reports. Business executives can use real-time information by leveraging crucial KPIs. They'll also be able to adapt and respond to market changes in order to stay ahead of the competition.
To Conclude
Great-decision making is the backbone of any business. Prompt, accurate, real-time, and holistic decisions always benefit businesses. So, don’t you want to try out and see how data visualization improves your decision making?
About the Creator
Keep reading
More stories from SRanalytics and writers in Journal and other communities.
What is data visualization: The practical guide for SME business owners?
Data visualization is going to be the future of data analysis. Starting from small businesses to large organizations – none will be able to do without it. The reason being - if a business doesn’t analyze the massive amount of data being churned, it won't be able to survive in the market. This article has shared all that an SME needs to know before venturing into data visualization. So let's start with what is data visualization and its importance.
By SRanalytics3 years ago in Journal
When the Robots Took My Job
This is for RM Stockton's Write Club prompt for the month of April: AI Please allow me to vent. For "college," I went to a scam school that is now closed. We were promised internships that were never spoken of again after admissions, and we were promised help finding jobs. The first time I went to the career counselor's office, she was completely frazzled. She had no idea what to do with us, the film majors. The second time I visited her office, I let her know that I'd found myself a job, and she was visibly relieved.
By Rebekah Conard12 days ago in Journal
Give Users Assured Data Quality and Concise Data Insight
There are many business issues surrounding the use of data to make decisions. One such issue is the inability of an organization to gather and analyze data. These enterprises will typically focus on building a team of data scientists or business analysts to help with this task OR they might take on an augmented analytics initiative to provide access to data and analytics for their business users. This is where businesses will often face a second issue; namely that the analytics solution they choose is not designed to easily and quickly provide insight into data and to ensure data quality.
By Kartik Patel4 days ago in Journal
The Abominable No-Meatman
So, I had an idea. I was wondering if Pennywise the dancing clown went vegan because he wanted to befriend humanity, what would he eat? Would there be food options for him, or would he have to starve just to be put in a better light with us humans. So I’ve created a special restaurant and menu just for him. This way, if Pennywise were to become vegan, he wouldn’t have to get creative with his dietary choices, I’ve done it for him. I’ve taken the work out of going vegan on his behalf! Here is a special restaurant and menu I made just for our friend, Pennywise!
By Alex H Mittelman 6 days ago in Fiction


Comments
There are no comments for this story
Be the first to respond and start the conversation.