
What is data visualization: The practical guide for SME business owners?
Data visualization
Data visualization is going to be the future of data analysis. Starting from small businesses to large organizations – none will be able to do without it. The reason being - if a business doesn’t analyze the massive amount of data being churned, it won't be able to survive in the market. This article has shared all that an SME needs to know before venturing into data visualization. So let's start with what is data visualization and its importance.
What is data visualization?
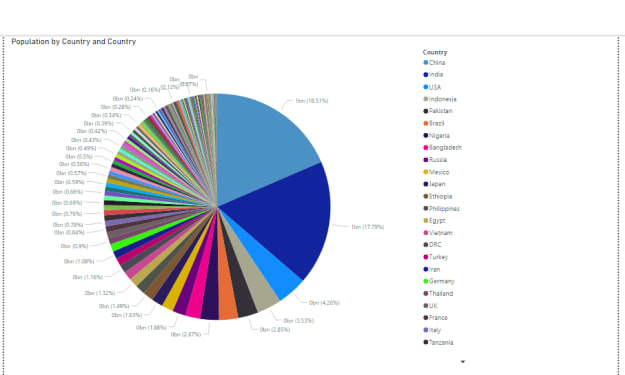
Data visualization is the process of presenting data through visuals like maps, graphs, and charts. Thus, it helps you understand your business’s trend, market patterns and find out the outliers.
Why is data visualization important?
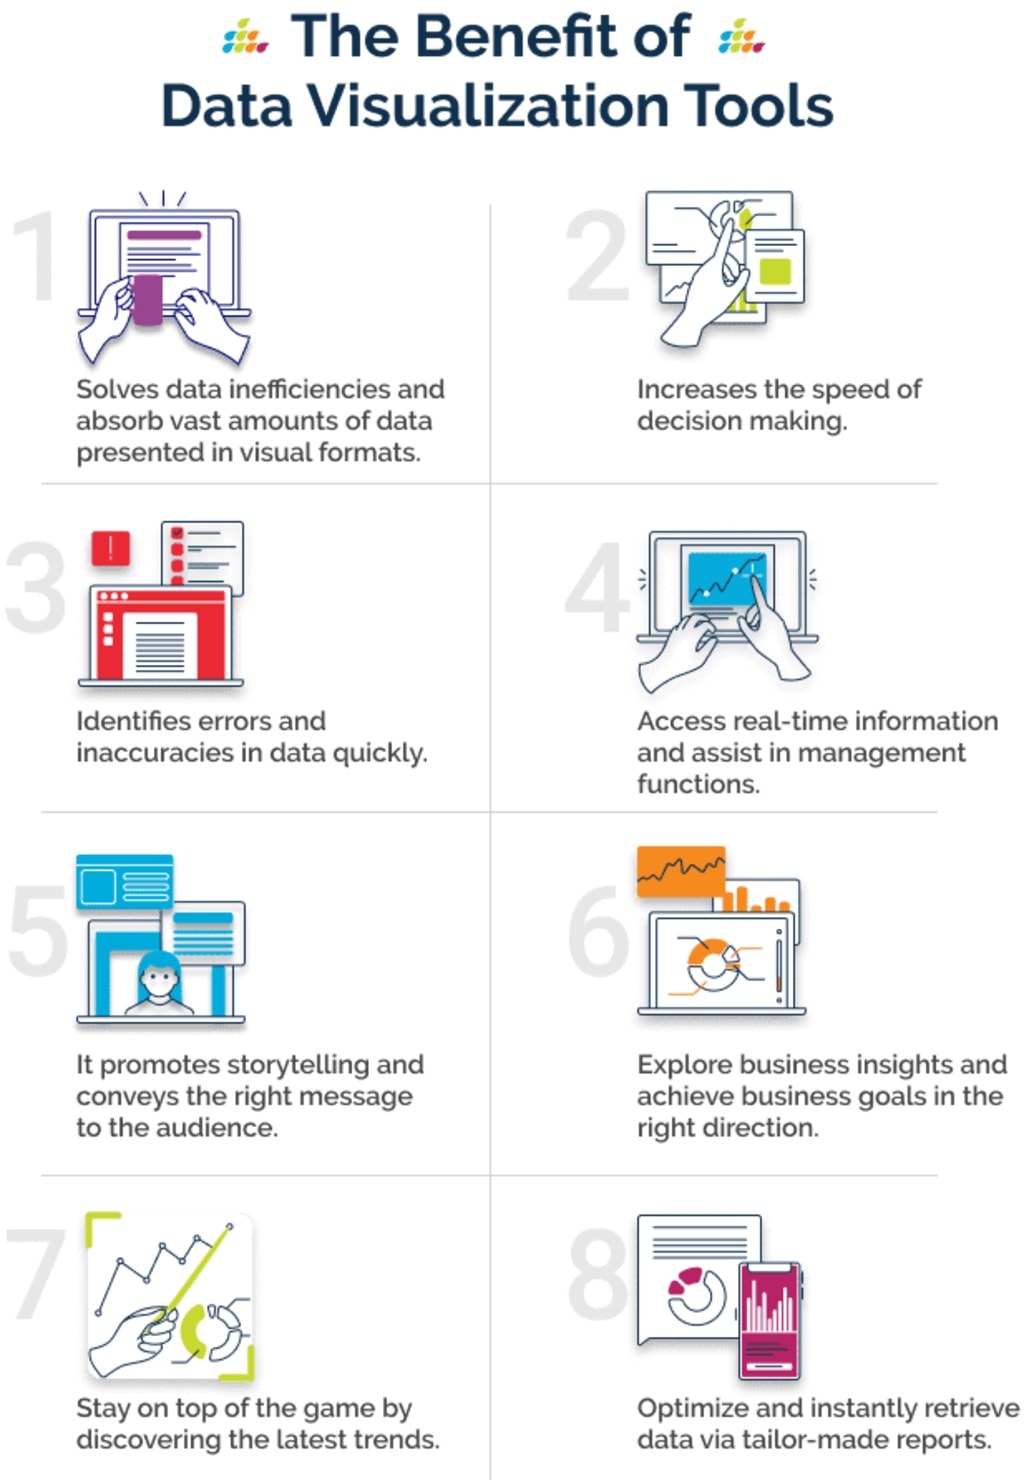
Some primary advantages and benefits of using data visualization are:
- Through visuals and infographics, DataViz provides information very clearly. Thus, helping business leaders construe and make informed decisions more rapidly. It also helps in grabbing stakeholder's attention for a longer span.
- Analysis present through interactive visuals helps in encapsulating intricate information. Thus, making complex data easy to read.
- It helps in drawing a correlation between different market factors and business functions. So, leaders can take holistic business decisions.
- The web is full of customer information. All you need to do is collect them. And analyze them correctly to connect with your customers.
- Using DataViz to monitor KPIs (Key Performing Indicators), you can promptly understand market trends and spot shifts. In turn, it'll also help you to make quick, informed decisions.
The future of data visualization
Data visualization in sync with AI and Machine learning is slowly transforming the way leaders make business decisions. Under the current scenario, when digitalization is crucial for a business’s survival, DataViz has a promising future. So, implementing it in your business is sure to benefit you significantly.
How data visualization helps business
Now that we know what is data visualization and its importance let us check out how it helps businesses.
- A business study by Wharton School of Business found that using DataViz in business meetings can shorten them by 24%.
- Managers who use BI dashboards have an 86% chance of finding the information more timely, i.e., 28% more likely than their colleagues using traditional reports and dashboards.
- A BI tool with data visualization competencies offers a Return on Investment of USD 13.01 on each dollar spent.
- Improves employee efficiency because when people get instructions with illustrations, they follow it 323% better than when instruction is in text only.
Top data visualization tools/software, best practices, and poor examples
Top four data visualization tools/software
Microsoft Power BI
Using Power BI, you can connect to a wide range of data sources to gather information and analyze your data. You can access real-time dashboards from anywhere. Furthermore, using Natural language processing, you can get explore data using standard texts. Very suitable for SMEs.
Pricing: 9.99$ per user, per month.
Tableau
Tableau is more suitable for large organizations with massive databases and a sufficient budget for BI. It also works on the drag-and-drop feature. Thus, making it ideal for non-tech users.
Pricing: Starts at 35$ per user per month.
Google Data Studio
Since Google Data Studio is free, it's ideal for small businesses with minimum funds for BI. It's a web-based tool using which you can prepare your dashboards with ease. Moreover, sharing these dashboards is as smooth as sharing Google Docs.
Looker
Looker is a perfect BI tool for large organizations dealing with Big Data. It also works on drag-and-drop features and has a browser-based interface.
Pricing: Looker’s pricing depends on various factors like business’s size, number of users, etc. So, you can contact them to get tailored pricing.
Data visualization best practices
- Understand your target audience. So, your dashboards will be syn with their culture and requirement.
- Have a thorough knowledge of your data.
- Maintain the data-ink ratio.
- Keep consistency throughout your reports.
- Stick to the standard reporting and presentation principles.
- Make dashboards simple and easy to understand.
- Keep dashboards minimalistic.
Poor data visualization examples
- Not using standard y-axis
- Using irrelevant graphs
- Not using titles, and labels
- Giving too much color, images, and lengthy texts
- Putting too much information in a visual or a page
After knowing what is data visualization, its uses, the best tools, etc., it's now time to make decisions. Let us help you through it.
Working with a data visualization company
While non-tech users can also use the modern BI tools for data analysis, these tools have high-end analytics features. So, to use them optimally for your business, it’s best to partner with a BI consultancy firm.
Benefits of working with a data visualization consultant
- They have relevant experience and expertise. Thus, it can give a better insight into your data.
- Instead of hiring a team, when you work with a consultancy firm, it helps in building the competency gap.
- Good data visualization firms have data analysts who know high-end statistical analysis.
To Conclude
Starting from what is data visualization to how to select a BI consultancy firm, we have shared all the necessary detail that an SME might need to start working on a BI tool.
But should SMEs opt for data visualization?
Yes, if you want to enjoy a competitive edge, you must invest in data visualization from the initial days of your business. Start with the free versions and upgrade yourself as your business grows.
About the Creator
Keep reading
More stories from SRanalytics and writers in Journal and other communities.
Bad Data Visualization Examples - Don't make these mistakes!
Data analysis is now possible for professionals with limited or no technical skill sets. However, while it has broadened data visualization's scope, it has also given birth to many challenges. This article elaborates some of the critical bad data visualization examples you should look out for and ensure your reports do not have them.
By SRanalytics3 years ago in Journal
Another Factor That Separates Sages From Masters
Read to the End to Help "Change The World" with our Earth Week Impact Launch Initiative! --- In my article The 8 Stages to a Quality Career, I detailed each of the steps one must go through to advance to the highest levels in any Industry.
By Cody Dakota Wooten, C.B.C.11 days ago in Journal
When You Don't Have To Get Up and The Coconut Connection
Introduction This is a Seven Days In Post from Sunday 21 January 2018 and if nothing else illustrates some of my tangential thoughts with some amazingly mad music which I think you might just enjoy.
By Mike Singleton - Mikeydred7 days ago in Journal
And the Sun Came Up Tremendous
In memory of the 12 girls who were among the first victims of the atomic age. The screen on Mara's smartphone screamed beams of blue light into her eyes as she doom scrolled through social media. It was 4:13am, and she was still laying on her side in her bed unable to let go of the news headlines whipping past.
By Amanda Starks4 days ago in Fiction


Comments
There are no comments for this story
Be the first to respond and start the conversation.