
Is the U.S. Economy Experiencing Stagflation?
Non-Partisan Analysis


While some market observers have begun to warn about the risks of stagflation, others have started to ask if we are already there. At a recent in-person presentation I delivered on the West Coast, one participant asked me if I thought we were suffering from stagflation because more people were starting to worry that it was a real risk factor for the U.S. economy.
What is Stagflation?
The answer reminds me of the late U.S. Supreme Court Justice Potter Stewart (1915 to 1981), who was once asked how he defined obscenity. His famous response was, “I know it when I see it!” It was a witty quote, even though it was later revealed that his law clerk gave him that memorable quip.
From an economic perspective, stagflation occurs when the economy experiences low or negative economic growth (e.g., a recession) while inflation rises or remains at elevated levels. In the chart below, the shaded bars represent recessions (identified by the National Bureau of Economic Research) versus the yearly Consumer Price Index (CPI). Using this economic definition of stagflation, market watchers have concluded that stagflation was observed in the United States in the mid-1970s and early 1980s.
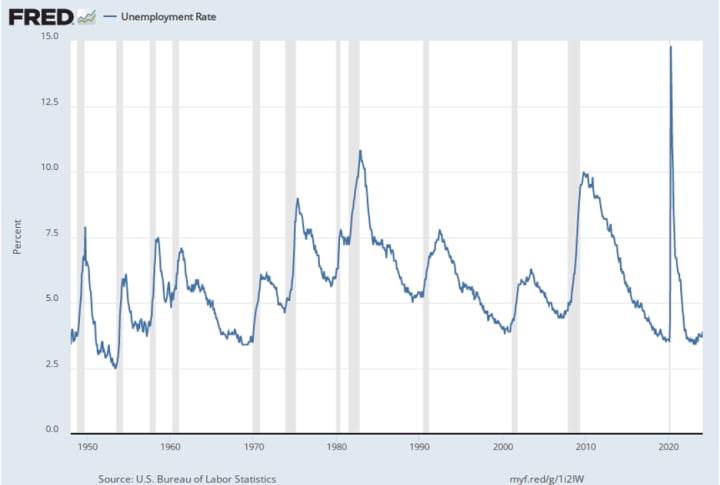
Both periods were mired in recessions, as the yearly CPI peaked at +12.2% (Nov. 1974) and +14.6% (March 1980) after the U.S. economy suffered two separate oil price shocks, which sharply raised the cost of oil. The unemployment rate also rose to 6.6% in Nov. 1974 and 6.3% in March 1980, epitomizing what conventional wisdom has historically defined as genuine instances of stagflation!
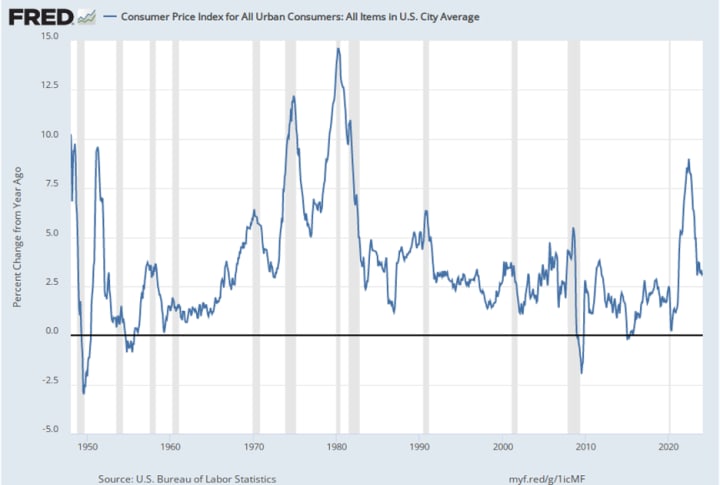
Given these observations, the question is whether today’s CPI and unemployment rate statistics depict another period of stagflation. With an unemployment rate of 3.9% and a yearly CPI of 3.2%, it would be hard to argue that we are experiencing anything close to what the U.S. economy suffered during the mid-1970s or early 1980s!
Financial markets seem to get spooked each time the CPI comes in 0.1% higher than expected. Still, to be consistent with prior stagflation episodes, we may need an extra +9.0 to +10.0% increase in the CPI (not +0.1%) and a +2.5% increase in the national unemployment rate from current levels!
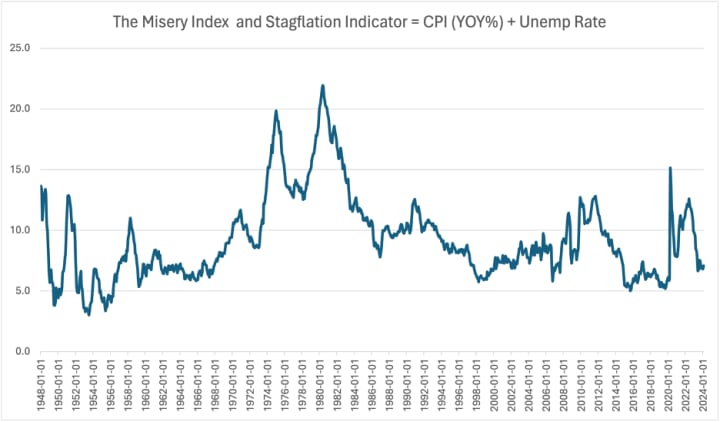
To highlight these trends, we utilized the Misery Index (the sum of the yearly CPI plus the National Unemployment Rate) invented by the late Arthur Okun (1928-1980). Although this index captures the economy's malaise, it is also a great metric of stagflation. The higher the reading, the more likely an economy may be suffering from stagflation. Relative to the mid-1970s or the early 1980s, the Misery Index is not signaling anything close to stagflation.
What Other Factors Play a Role in Measuring Consumer Discomfort?
If anyone is interested in taking this analysis to the next level, Professor Steve Hanke added interest rates and per capita GDP to the Misery Index. While the positive effects of per capita GDP may offset some of these three negatives: inflation, unemployment, and interest rates, the surge in interest rates may explain why political polls suggest consumers remain unhappy with the economy's performance! In prior work, we cited research that finds that polarization among consumers explains part of the discomfort among consumers. Sadly, this factor plays a role in both main political parties.
What About Future Stagflation?
One major limitation of the traditional Misery Index is its inability to predict whether the economy is about to enter or avoid a future bout of stagflation. For this endeavor, we will need to rely on leading economic indicators of inflation and unemployment, which help define whether the economy will experience a period of stagflation.
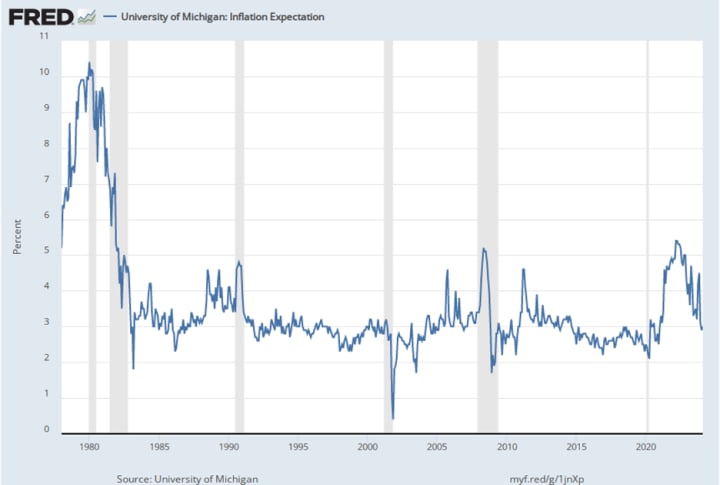
The University of Michigan’s 12-month ahead metric of inflation expectations is the most closely watched economic indicator of future inflation. That index moved lower to 2.9% in March 2024 from 3.0% the prior month, revealing little evidence that consumers expect an inflation resurgence within the next twelve months. Without a spike in inflation, it will be challenging to experience stagflation.
On the other hand, slower economic growth marked by a rise in the unemployment rate is needed to legitimize stagflation. With the University of Michigan’s Consumer Sentiment reaching its highest reading since July 2021, it is difficult to predict that consumers (who account for two-thirds of economic activity) will stop spending and push the economy into a recession!
What Conditions Are Needed to Produce a Future Bout of Stagflation?
Slower economic growth and a rise in the unemployment rate are needed to define another period of stagflation. The University of Michigan’s Consumer Sentiment reached its highest reading in March 2024 (since July 2021), making it difficult to fathom that consumers (who account for two-thirds of economic activity) will suddenly stop spending and push the economy into a recession!
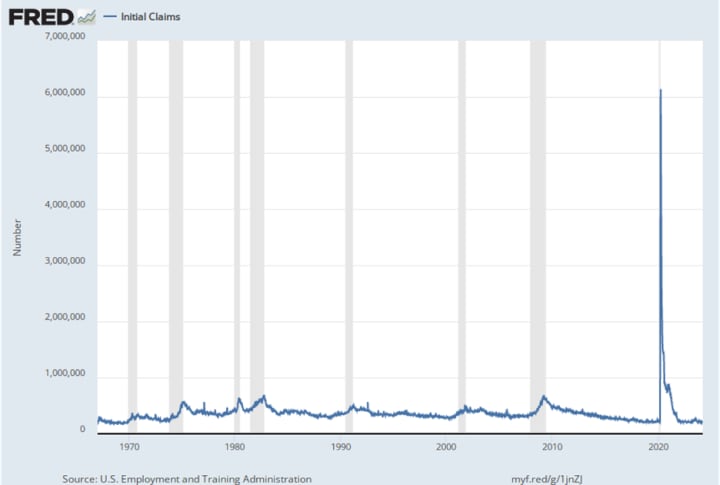
Tracking the number of individuals applying for unemployment benefits often signals whether the unemployment rate is likely to rise, stay the same, or decrease. The latest reading was a paltry 210k, sharply below the 474k reading (which signaled higher future unemployment rates) observed in the last week of November 1974 or 475k at the end of March 1980, associated with periods of stagflation. In an article I published in Barrons in June 2023, I argued that initial unemployment claims were not signaling a recession. Nothing has changed on this front since that article was published.
Some labor market observers have noted that with more individuals holding multiple jobs, the odds of filing for initial unemployment claims benefits are lower. Individuals qualify for unemployment benefits only if they aren’t employed at any job! That is a severe limitation, but on the bright side, consumers may be less likely to stop spending and push the economy into a recession if they have other jobs.
Finally, to satisfy the curiosity of our politically minded readers, we decided to examine the Misery Index on a non-partisan basis across the tenure of prior occupants in the White House. As always, we generate the results and let our readers reach their partisan conclusions. And for those keeping tabs, President Trump’s average reading was below President Biden's. But eight other Presidents averaged a Misery Index reading equal to or above his average reading.
Hopefully, these non-biased results will allow our readers to spin these nonpartisan results in favor of their favorite political party. Still, the primary undisputed outcome from our analysis is that using a historical lens, the latest readings do not appear to show any signs of stagflation!
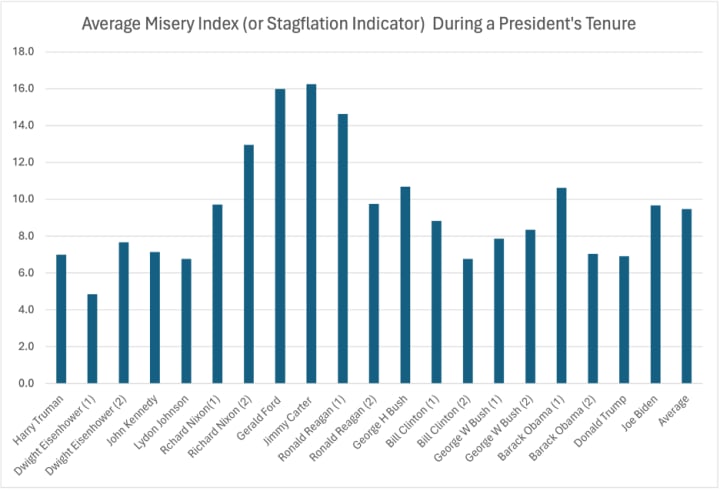
For those keeping tabs, President Trump’s stagflation readings were lower than those observed during President Biden’s term, and they were slightly above the average during our sample period (1948 to present). Still, we invite our readers to pair the stagflation indicator readings with past U.S. Presidents. When doing so, you should find that both political parties have experienced high and low readings.
The highest Stagflation indicator readings were generated under President Carter when inflation peaked. Those high readings continued into President Reagan’s first term but were sharply reduced during his second term.
In contrast, the lowest Stagflation readings were registered under President Eisenhower, who enjoyed low unemployment and inflation during his tenure in office. President Nixon's disastrous wage and price controls delivered high stagflation readings that extended into President Ford’s tenure in office.
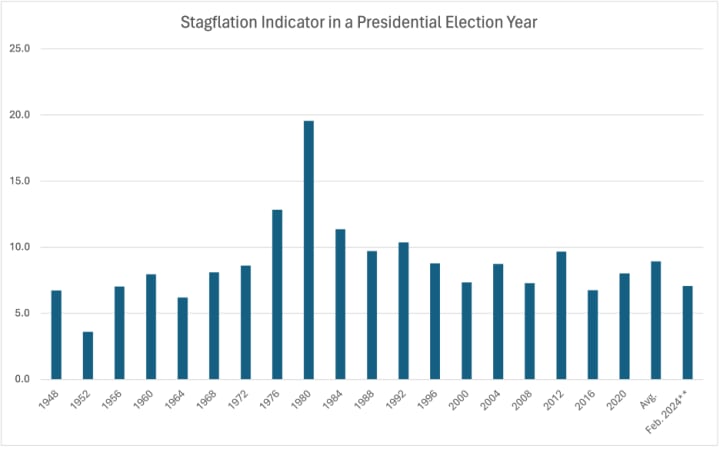
Finally, since perceptions matter, we took another look at our Stagflation Indictor/Misery Index during the years of a Presidential Election. The only non-partisan caveat we offer is that the metric reading for President Biden only has the first two months of the current election year and requires 10 additional months of data to make them comparable with our other results.
Summary and Concluding Thoughts
While some economy watchers suggest that we are either suffering from a bout of stagflation or about to enter one, our results strongly suggest that we are not experiencing anything resembling a historical stagflation period. While we will refrain from opining on the projections of many political pundits predicting a future episode of stagflation, our contribution is to arm our readers with historical facts.
To achieve the mid-1970s and early 1980s style of stagflation, the yearly CPI must accelerate by 9 to 10% from current levels and not just come in at 0.1% above market expectations. On the unemployment front, the unemployment rate must rise by 2 to 2.5% from current levels.
These two developments are necessary for a future stagflation episode. We will respect all the outstanding forecasts, but we wanted to provide our readers with the underlying assumptions needed to support them.
About the Creator
Anthony Chan
Chan Economics LLC, Public Speaker
Chief Global Economist & Public Speaker JPM Chase ('94-'19).
Senior Economist Barclays ('91-'94)
Economist, NY Federal Reserve ('89-'91)
Econ. Prof. (Univ. of Dayton, '86-'89)
Ph.D. Economics
Keep reading
More stories from Anthony Chan and writers in FYI and other communities.
One of the Crazy Things Rich People Do That's Scary To Think About
They impress us, and sometimes they scare us, but the ultra-rich are always interesting. Some of their famous activities include buying yachts too big to move through channels, buying ridiculously priced cars that could feed the homeless of New York for weeks, and their expensive tastes in sex workers.
By Jason Ray Morton 2 days ago in FYI
Getting lost in the forest helps ghosts
On a day like any other day, I went into the forest to find medicine. I only had a knife and a gun for self-defense because I was afraid of encountering wild animals. I planned to go home that afternoon. That's why I didn't bring any food with me, just a bottle of water and then I just went into the forest. The forest that I went to was not that I had never been to it, but that place I had been to many times and also called it I took some to eat because I was lost so I couldn't find my way back to the house until now. The old lady just told me that there were some boiled potatoes in the back of the house to eat, then the old lady entered the house again so I I went to the back of the house and saw a small room, so I went inside to look and there was a pot with five potatoes, so I boiled three of them to eat to satisfy my hunger, and then I saw that there was a girl under the trees. near that house, she bowed to me as if she wanted me to go there so she had something to tell me so I went to the tree where she was standing and asked if anything was wrong and she begged me to help her. She escaped this house so I thought she was the old lady's daughter so I asked her why she and her mother were in this forest and only had this small house. She replied. I'm not her child and she asked me to help her escape from this house and she ran over.quite familiar. The picture is there so just like that, I went from my house to that forest, probably about 5 km after I got there. Like every time I go looking for medicine, but this time I picked quite a bit, probably because I picked a lot before. That area was gone so I thought I could go deeper into the forest to find more to see if there was any.
By Phàng Văn Duy5 days ago in FYI
📢 Raise Your Voice Thread: 04/25/2024
Our “Raise Your Voice Threads” are hosted every other Thursday at 12PM ET to offer creators more avenues to uncover exceptional stories on Vocal. As we are continuously searching for fresh creators and inspiring stories, this thread provides an opportunity to exchange and discuss the stories that have moved and motivated us on Vocal.
By Raise Your Voice by Vocal6 days ago in Resources


Comments
There are no comments for this story
Be the first to respond and start the conversation.