
Nonparametric Statistical Tests using Python
An Introductory Tutorial to Nonparametric Statistical Tests using Python


This is a beginner-friendly introductory tutorial on nonparametric statistical tests using Python. Nonparametric tests in statistics are methods of statistical analysis that do not require the data to be normally distributed. Due to this reason, these types of tests are sometimes called distribution-free tests. Note that in this tutorial we are not going to discuss the theoretical details of these nonparametric statistical tests. Rather, we will discuss when and how to use these tests using Python. In addition, this tutorial assumes that the readers have a working knowledge of Python programming language. In this tutorial, we will use the SciPy (pronounced “Sigh Pie”) Python package used for mathematics, science, and engineering applications. SciPy is open-source.
In this tutorial, we discuss four nonparametric statistical tests. They are as follows:
- Mann-Whitney U Test,
- Wilcoxon Signed-Rank Test,
- Kruskal-Wallis H Test and
- Friedman Test.
To know more about the author of this tutorial, please visit the link below.
1. Mann-Whitney U Test
This test is used to check whether the distributions of two independent samples are equal or not. This test is also known as the Mann-Whitney U rank test which is applicable to two independent samples.
We can apply Mann-Whitney U Test if and only if the following assumptions are followed by the sample data:
- observations in each sample are independent and identically distributed (iid),
- observations in each sample can be ranked.
This test checks the null hypothesis (H0) against the alternative hypothesis (H1), and they are as follows:
- H0: the distributions of both samples are equal,
- H1: the distributions of both samples are not equal.
Here, we use the Mann-Whitney U test in Python using the mannwhitneyu() SciPy function. The function takes the two data samples as arguments. It returns the test statistic and the p-value.
At first, we need to generate two independent samples. We can use NumPy’s random module for this.
We can generate two independent samples of size 50 in the following way:
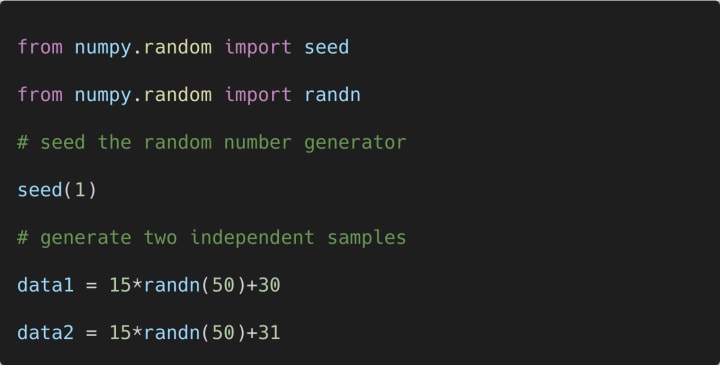
Note that we will use data1 and data2 throughout this tutorial to explain other nonparametric statistical tests using Python.
Now, we apply the Mann-Whitney U test to these two independent samples.
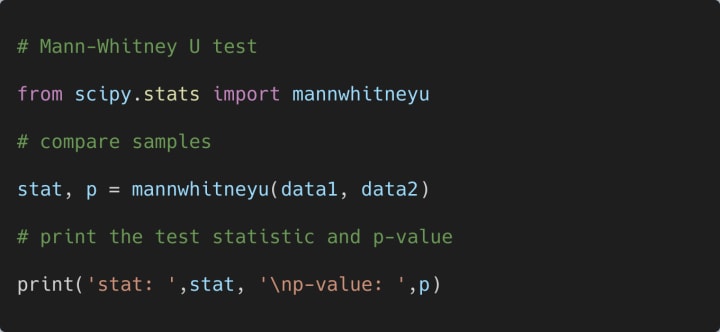
The output of the above print statement is shown below:
stat: 1062.0
p-value: 0.19615247557393267
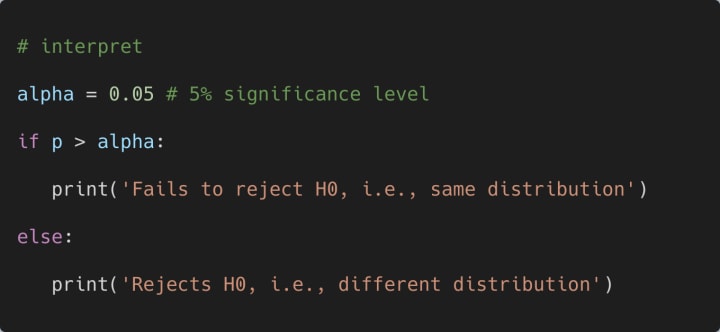
How do we interpret the results? Let us consider that we are performing this test at a 5% significance level. Then we can use the following code segment to interpret the obtained results as follows:

Since the obtained p-value is greater than alpha, the output of the above code segment will be as follows:
Fails to reject H0, i.e., same distribution
In short, if the obtained p-value is greater than the value of alpha (significance level), then we can conclude statistically that the two independent samples have the same distribution.
To read more tutorials from the author, please visit the link below.
2. Wilcoxon Signed-Rank Test
This test is used to check whether the distributions of two paired samples are equal or not. The Wilcoxon signed-rank test does not assume that the differences between paired samples are normally distributed.
We can apply the Wilcoxon signed-rank test if and only if the following assumptions are held by the two paired samples:
- observations in each sample are independent and identically distributed (iid),
- observations in each sample can be ranked,
- observations across each sample are paired.
This test checks the null hypothesis (H0) against the alternative hypothesis (H1), and they are as follows:
- H0: the distributions of both samples are equal,
- H1: the distributions of both samples are not equal.
In particular, the Wilcoxon signed-rank test checks whether the distribution of the differences between two samples is symmetric about zero or not. Note that it is a non-parametric version of the paired T-test.
Here, we use the Wilcoxon Signed-Rank Test in Python using the wilcoxon() SciPy function. The function takes the two data samples as arguments. It returns the test statistic and the p-value.
Now, we will see how to use wilcoxon() SciPy function using a simple example described below. We use the same data generated above using NumPy’s random module.
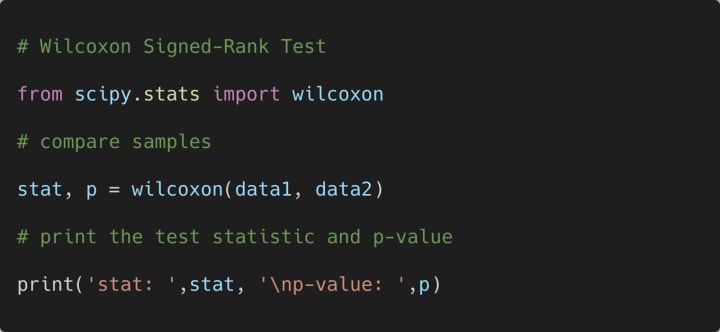
The output of the above print statement is shown below:
stat: 506.0
p-value: 0.20429624539024516
How do we interpret the results? Let us consider that we are performing this test at a 5% significance level. Then we can use the following code segment to interpret the obtained results as follows:
Since the obtained p-value is greater than alpha, the output of the above code segment will be as follows:
Fails to reject H0, i.e., same distribution
In short, if the obtained p-value is greater than the value of alpha (significance level), then we can conclude statistically that the two independent samples have the same distribution.
3. Kruskal-Wallis H Test
This test is used to check whether the distributions of two or more independent samples are equal or not. This test works on two or more independent samples, which may have different sizes.
We can apply the Kruskal-Wallis H Test test if and only if the following assumptions are held by the samples:
- observations in each sample are independent and identically distributed (iid),
- observations in each sample can be ranked.
This test checks the null hypothesis (H0) against the alternative hypothesis (H1), and they are as follows:
- H0: the distributions of all samples are equal,
- H1: the distributions of one or more samples are not equal.
The Kruskal-Wallis H-test tests the null hypothesis (H0) that the population median of all of the groups is equal. Note that it is a non-parametric version of ANOVA.
Here, we use the Kruskal-Wallis H-test in Python using the kruskal() SciPy function. The function takes the two data samples as arguments. It returns the test statistic and the p-value.
Now, we will see how to use kruskal() SciPy function using a simple example described below. We use the same data generated above using NumPy’s random module.
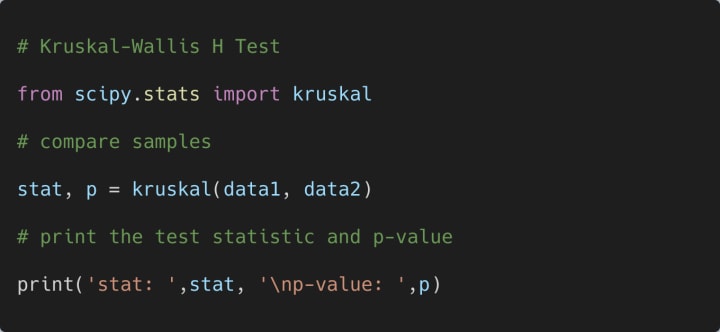
The output of the above print statement is shown below:
stat: 1.6797148514851301
p-value: 0.1949623463490322
How do we interpret the results? Let us consider that we are performing this test at a 5% significance level. Then we can use the following code segment to interpret the obtained results as follows:

The output of the above print statement is shown below:
Fails to reject H0, i.e., same distribution
In short, if the obtained p-value is greater than the value of alpha (significance level), then we can conclude statistically that the independent samples have the same distribution.
Note that in case of the rejection of the null hypothesis (H0), we do not know which of the groups differs. Then posthoc comparisons between groups are required to be performed.
4. Friedman Test
This test is used to check whether the distributions of two or more paired samples are equal or not.
We can apply the Friedman Test if and only if the following assumptions are held by the samples:
- observations in each sample are independent and identically distributed (iid),
- observations in each sample can be ranked,
- observations across each sample are paired.
The Friedman Test checks the null hypothesis (H0) against the alternative hypothesis (H1), and they are as follows:
Here, we use the Friedman Test in Python using the friedmanchisquare() SciPy function. The function takes at least three data samples as arguments. So, we create three independent samples as shown below:
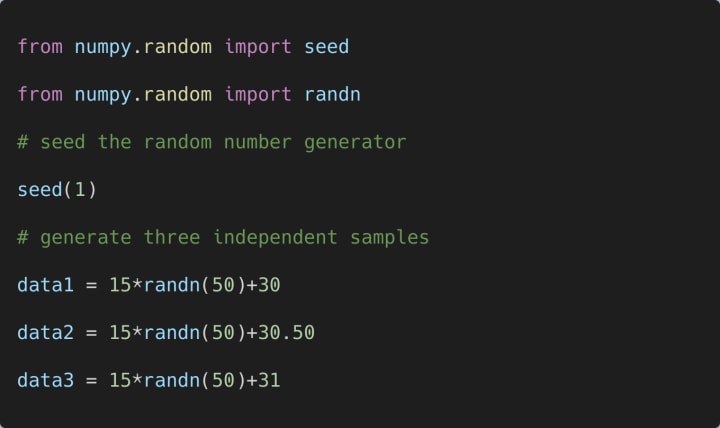
Each of the three samples generated above has 50 observations. The Friedman test returns the test statistic and the p-value.
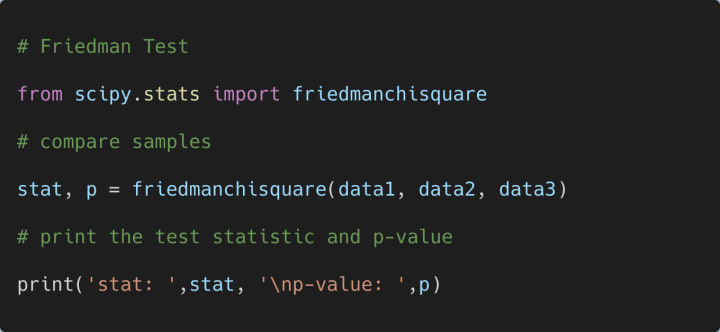
The output of the above print statement is shown below:
stat: 1.5600000000000591
p-value: 0.45840601130520997
How do we interpret the results? Let us consider that we are performing this test at a 5% significance level. Then we can use the following code segment to interpret the obtained results as follows:

The output of the above print statement is shown below:
Fails to reject H0, i.e., same distribution
In short, if the obtained p-value is greater than the value of alpha (significance level), then we can conclude statistically that the independent samples have the same distribution.
Subscribe to the YouTube channel of Dr. Soumen Atta, Ph.D.
This is the end of this tutorial.
About the Creator
Soumen Atta
Dr. Soumen Atta, Ph.D. is an Assistant Professor in the Center for Information Technologies and Applied Mathematics, School of Engineering and Management at the University of Nova Gorica, Vipava, Slovenia. https://www.soumenatta.com/
Enjoyed the story? Support the Creator.
Subscribe for free to receive all their stories in your feed. You could also pledge your support or give them a one-off tip, letting them know you appreciate their work.
Reader insights
Outstanding
Excellent work. Looking forward to reading more!
Top insights
Excellent storytelling
Original narrative & well developed characters
Expert insights and opinions
Arguments were carefully researched and presented
Eye opening
Niche topic & fresh perspectives
Heartfelt and relatable
The story invoked strong personal emotions
On-point and relevant
Writing reflected the title & theme
Keep reading
More stories from Soumen Atta and writers in 01 and other communities.
Pyomo for Solving Linear Programming Problems
This is a beginner-friendly introductory tutorial on Pyomo. Pyomo stands for Python Optimization Modeling Objects. In this tutorial, we learn how to solve linear programming problems (LPPs) using Pyomo which is an algebraic modeling language. It is a Python-based, open-source optimization modeling language. Although Pyomo has a diverse set of optimization capabilities, in this tutorial, we will discuss how to solve LPPs using Pyomo.
By Soumen Atta2 years ago in 01
The Art of Work: Valuing Time in the Age of AI
Artificial intelligence isn't going away. You might be excited about that. You might be anxious. Whatever you're feeling, though, AI has become a permanent fixture in our society. As long as there's profit to be made, advancements in AI will shape the next wave of technology.
By Addison Horner15 days ago in 01
How to Enhance Your Leadership Skills in the Workplace
Effective leadership is essential for the success of any organization. Whether you are in a managerial role or aspiring to be one, developing strong leadership skills can significantly impact your career and the overall productivity of your team.
By Sherif Saad7 days ago in 01


Comments
Soumen Atta is not accepting comments at the moment
Want to show your support? Send them a one-off tip.