
Zack Greinke and the Terrible, Horrible, No Good, Very Bad Year
Zack Greinke was really bad last season. What went wrong for one of the best pitchers in the NL?

Zack Greinke had one of the most dominating stretches in baseball history with the Dodgers. In his three-and-a-bit years with the Boys in Blue, Greinke went 51-15 (that’s a .773 W-L%!) with a 2.30 ERA, 2.97 FIP, and a 1.027 WHIP. In his 2015 season, he went 19–3 with a 1.66 ERA — the lowest in a single season since Greg Maddux pitched to a 1.63 ERA in 1995.
Thanks to his impeccable resume, Greinke signed a massive 6 year/$200+ million contract with the Arizona Diamondbacks in the 2015 offseason, and debuted with the D-backs in 2016 — and immediately proceeded to stink to high heaven.
Greinke gave up 7 earned runs in the Diamondbacks’ opener in only 4 innings, a rather disappointing start to his debut in Phoenix. But Greinke never seemed to recover — his ERA through May was 4.71, and he finished the season with a 4.37 ERA along with a 4.12 FIP.
There was plenty of talk about how OF Bryce Harper dropped off of a cliff in terms of production in 2016, going from 9.9 rWAR in 2015 to 1.6 rWAR in 2016, but Greinke saw a comparable fall-off — 9.3 rWAR to 2.3 rWAR. This begs the obvious question: What happened to Greinke?
Greinke wasn’t largely injured — or if he was, he didn’t show it. He was shut down at the end of the season due to shoulder stiffness, but there wasn’t any structural damage or any indication that the stiffness had persisted throughout the entire season.
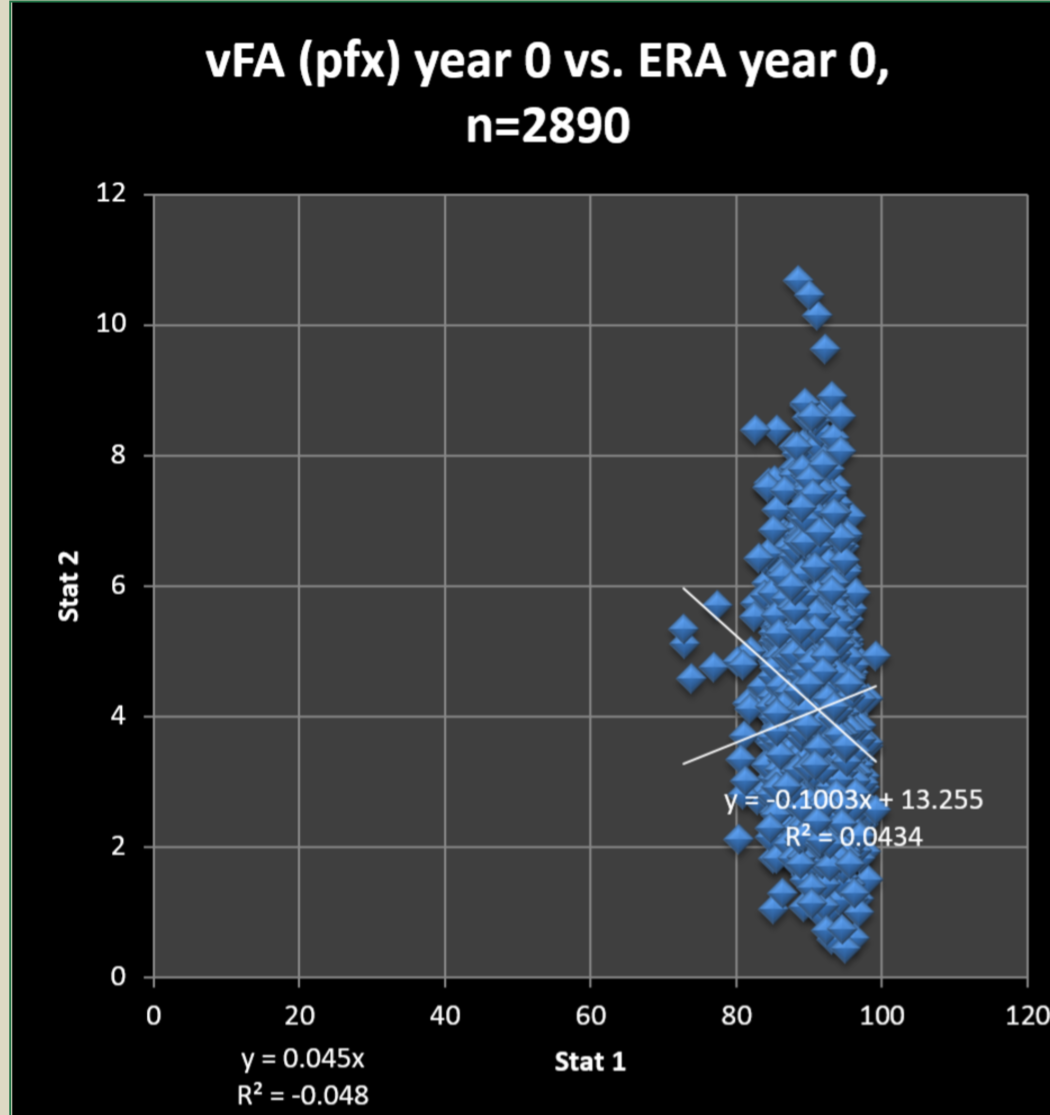
Velocity loss wasn’t the issue either. Greinke’s velocity figures from PITCHF/x indicate a slight decrease in FB velocity in 2016, but most of his other pitches hovered around his marks from 2015. And his ERA spike can’t possibly be attributed to that decrease in his FB velocity (more on this later).
It’s not BABIP — Greinke’s .294 figure was not out of line with his career .298 figure. It’s not walks — his 2.33 BB/9 was nothing out of the ordinary for him. There simply wasn’t much wrong with Greinke himself — he pitched about the same as he has throughout his career. However, his supporting cast changed — which may have contributed to his struggles.
With the 2015 Dodgers, Greinke had a team that averaged 1.0 UZR/150 taking the field behind him. They weren’t the greatest fielding team in the world, but it was still filled with capable defenders. However, the 2016 Diamondbacks, hampered by the loss of Gold-Glover AJ Pollock, were among the worst defensive teams in the league, averaging -6.1 UZR/150. Greinke went from having a league average defense behind him to one of the worst. As a result, his ERA rose.
This article suggests, however, that Greinke’s issues might also be attributed to his velocity — not necessarily to a loss in velocity, but to a lack of variance. Greinke’s fast pitches got slower and he threw his slower pitches faster, so hitters couldn’t be as easily fooled by an off-speed pitch. That, coupled with Greinke missing his mark with pitches, as Zachary Rymer on BR describes, might have lead to much of the right-hander’s struggles. With hitters getting better timing against him and more pitches in the zone, they made contact more frequently.
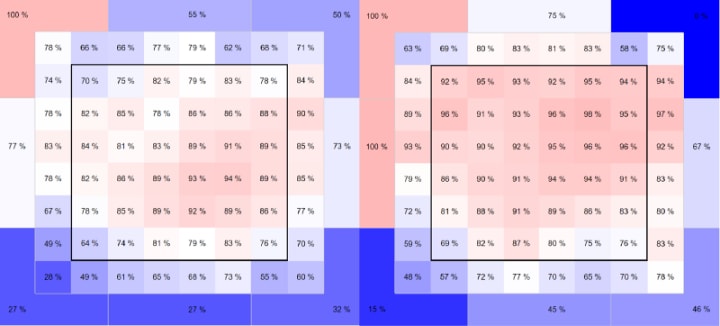
Via Fangraphs
Above, on the left, is Greinke’s 2015 heatmap. On the right, his 2016 heatmap. Notice that his contact is up across the board, especially up in the zone. Hitters made contact far more frequently on Greinke’s pitches — which as a strikeout pitcher with a sub-par defense on the field is something Greinke would have preferred to have avoided.
This all hurt Greinke, but the last nail in the coffin was home runs. Greinke gave up 23 home runs, the most of his career since his rookie season — despite pitching the fewest innings in his career since 2007.
Obviously, more batters making contact will lead to more home runs, but Greinke’s home runs were still anomalous: Greinke’s HR/FB ratio in 2016 was 13.9%. His hard-contact% was up from 2015 (increased from 26.8% to 30.7%), but Greinke pitched to a similar hard-contact% in 2013 and only had a HR/FB of 8.6 % that season. Overall, Greinke has pitched to a close-to-league-average figure of 9.5% HR/FB in his career, so it’s possible that Greinke was simply extraordinarily unlucky when it came to home runs in 2016.
He also had the misfortune of moving to Chase Field instead of spacious Dodger stadium. Chase Field is an extreme hitters park according to parkfactors.com, especially with regards to home runs. Dodgers Stadium, on the other hand, is far more neutral, which allowed Greinke less of a home-field disadvantage in his time with the Dodgers.
Aside from the park factors, mercifully, it doesn’t look like the rest of these issues will persist for Greinke into 2017. The return of Pollock will bolster the Diamondbacks’ defense, Greinke can focus on varying his pitch speeds, and bad luck is just plain flukey. If he can bounce back, Greinke can help the Diamondbacks to the season that 2016 was supposed to be.
About the Creator
John Edwards
Staff Writer for The Unbalanced, Contributor at Sporting News.
Keep reading
More stories from John Edwards and writers in Unbalanced and other communities.
Adam Eaton is Not a Centerfielder (Or a closer, for that matter)
This offseason, after their trade proposal for Chris Sale fell through, the Washington Nationals decided to pull the trigger on a different deal with the White Sox: OF Adam Eaton in exchange for SP Lucas Giolito, SP Reynaldo Lopez, and SP Dane Dunning.
By John Edwards7 years ago in Unbalanced
John Jay Starts Season off with Two Victories
Please see pledge, tip and subscribe options below After opening the 2024 season with a 10-2 victory over Pelham, John Jay came home on Thursday March 28 and faced the Briarcliff Mighty Bears between the raindrops. But the intermittent nastiness of the precipitation was nothing compared to the biting sting of the John Jay offensive attack.
By Rich Monettiabout 7 hours ago in Unbalanced
2024 Division Semifinals Preview
It's here, folks! It's finally here! The 2023-24 NHL regular season is over and done with, and after six months and 1,312 games played, it's now time for the greatest championship chase in all of sports. Winning the Stanley Cup is absolutely difficult. Hell, just getting to the Final is a rough journey. Yet, for the 44th year, it will be sixteen teams fighting their way to capture the greatest trophy in sports: the Stanley Cup. Four of these 16 teams have never won it all, and one of those four hasn't even been to the Final. In addition, four of the 16 team teams in this year's playoffs are Canadian, meaning that there's a 25% chance that the three decades long Cup drought in that country will come to an end,
By Clyde E. Dawkinsabout 3 hours ago in Unbalanced


Comments
There are no comments for this story
Be the first to respond and start the conversation.