
Which Crypto Prop Firms Include Free Market Data? A Practical Verification Guide
How traders can verify whether free data is real time, transparent and connected to execution.


Free market data can make a crypto prop trading account appear more cost effective, but the word “free” only answers one question: whether traders pay a separate fee to access price information.
It does not necessarily tell you where the prices come from, how quickly they update, whether the data is exchange linked, or whether the chart uses the same prices that determine trade execution.
These differences can become important when a signal appears on one screen, an order fills at another price, or a stop loss is triggered at a level that does not seem to match the chart. The cause may be normal market volatility, spread, latency, liquidity, the pricing model, or a difference between the chart and execution feed.
Before purchasing a crypto prop firm evaluation, traders should therefore look beyond the free market data label. Who supplies the prices? How often do quotes update? Are bid and ask prices visible? Which price triggers a stop? Does the chart use the same market data as the execution engine?
This guide explains what free market data can include, how to evaluate whether it is genuinely real time, how different pricing models work, and how to test the relationship between displayed prices and actual execution.
The goal is not to rank providers. It is to give traders a practical and neutral framework for evaluating market data before choosing a crypto prop firm.
Is Free Market Data Really Real Time?
Many crypto prop firms include basic market data in their trading platforms without charging a separate data subscription. However, free access does not automatically mean that the feed is real time, exchange sourced, or identical to the prices used for execution.
Free market data can refer simply to the fact that traders can view price information without purchasing an additional data package. The underlying feed may still differ in source, update frequency, pricing methodology, or execution behavior.
A platform might display a live reference price while using another system to calculate fills. Another provider may aggregate prices from multiple sources. A third may use an internal reference or index that follows the broader market without reproducing every transaction in an underlying order book.
These models can produce very similar charts under normal conditions. Their differences may become more noticeable when markets move quickly, spreads widen, or liquidity changes.
The practical question is therefore not simply whether market data is free. Traders should determine whether the information is sufficiently timely, transparent, and relevant to the strategy they intend to trade.
What Does Free Market Data Actually Include?
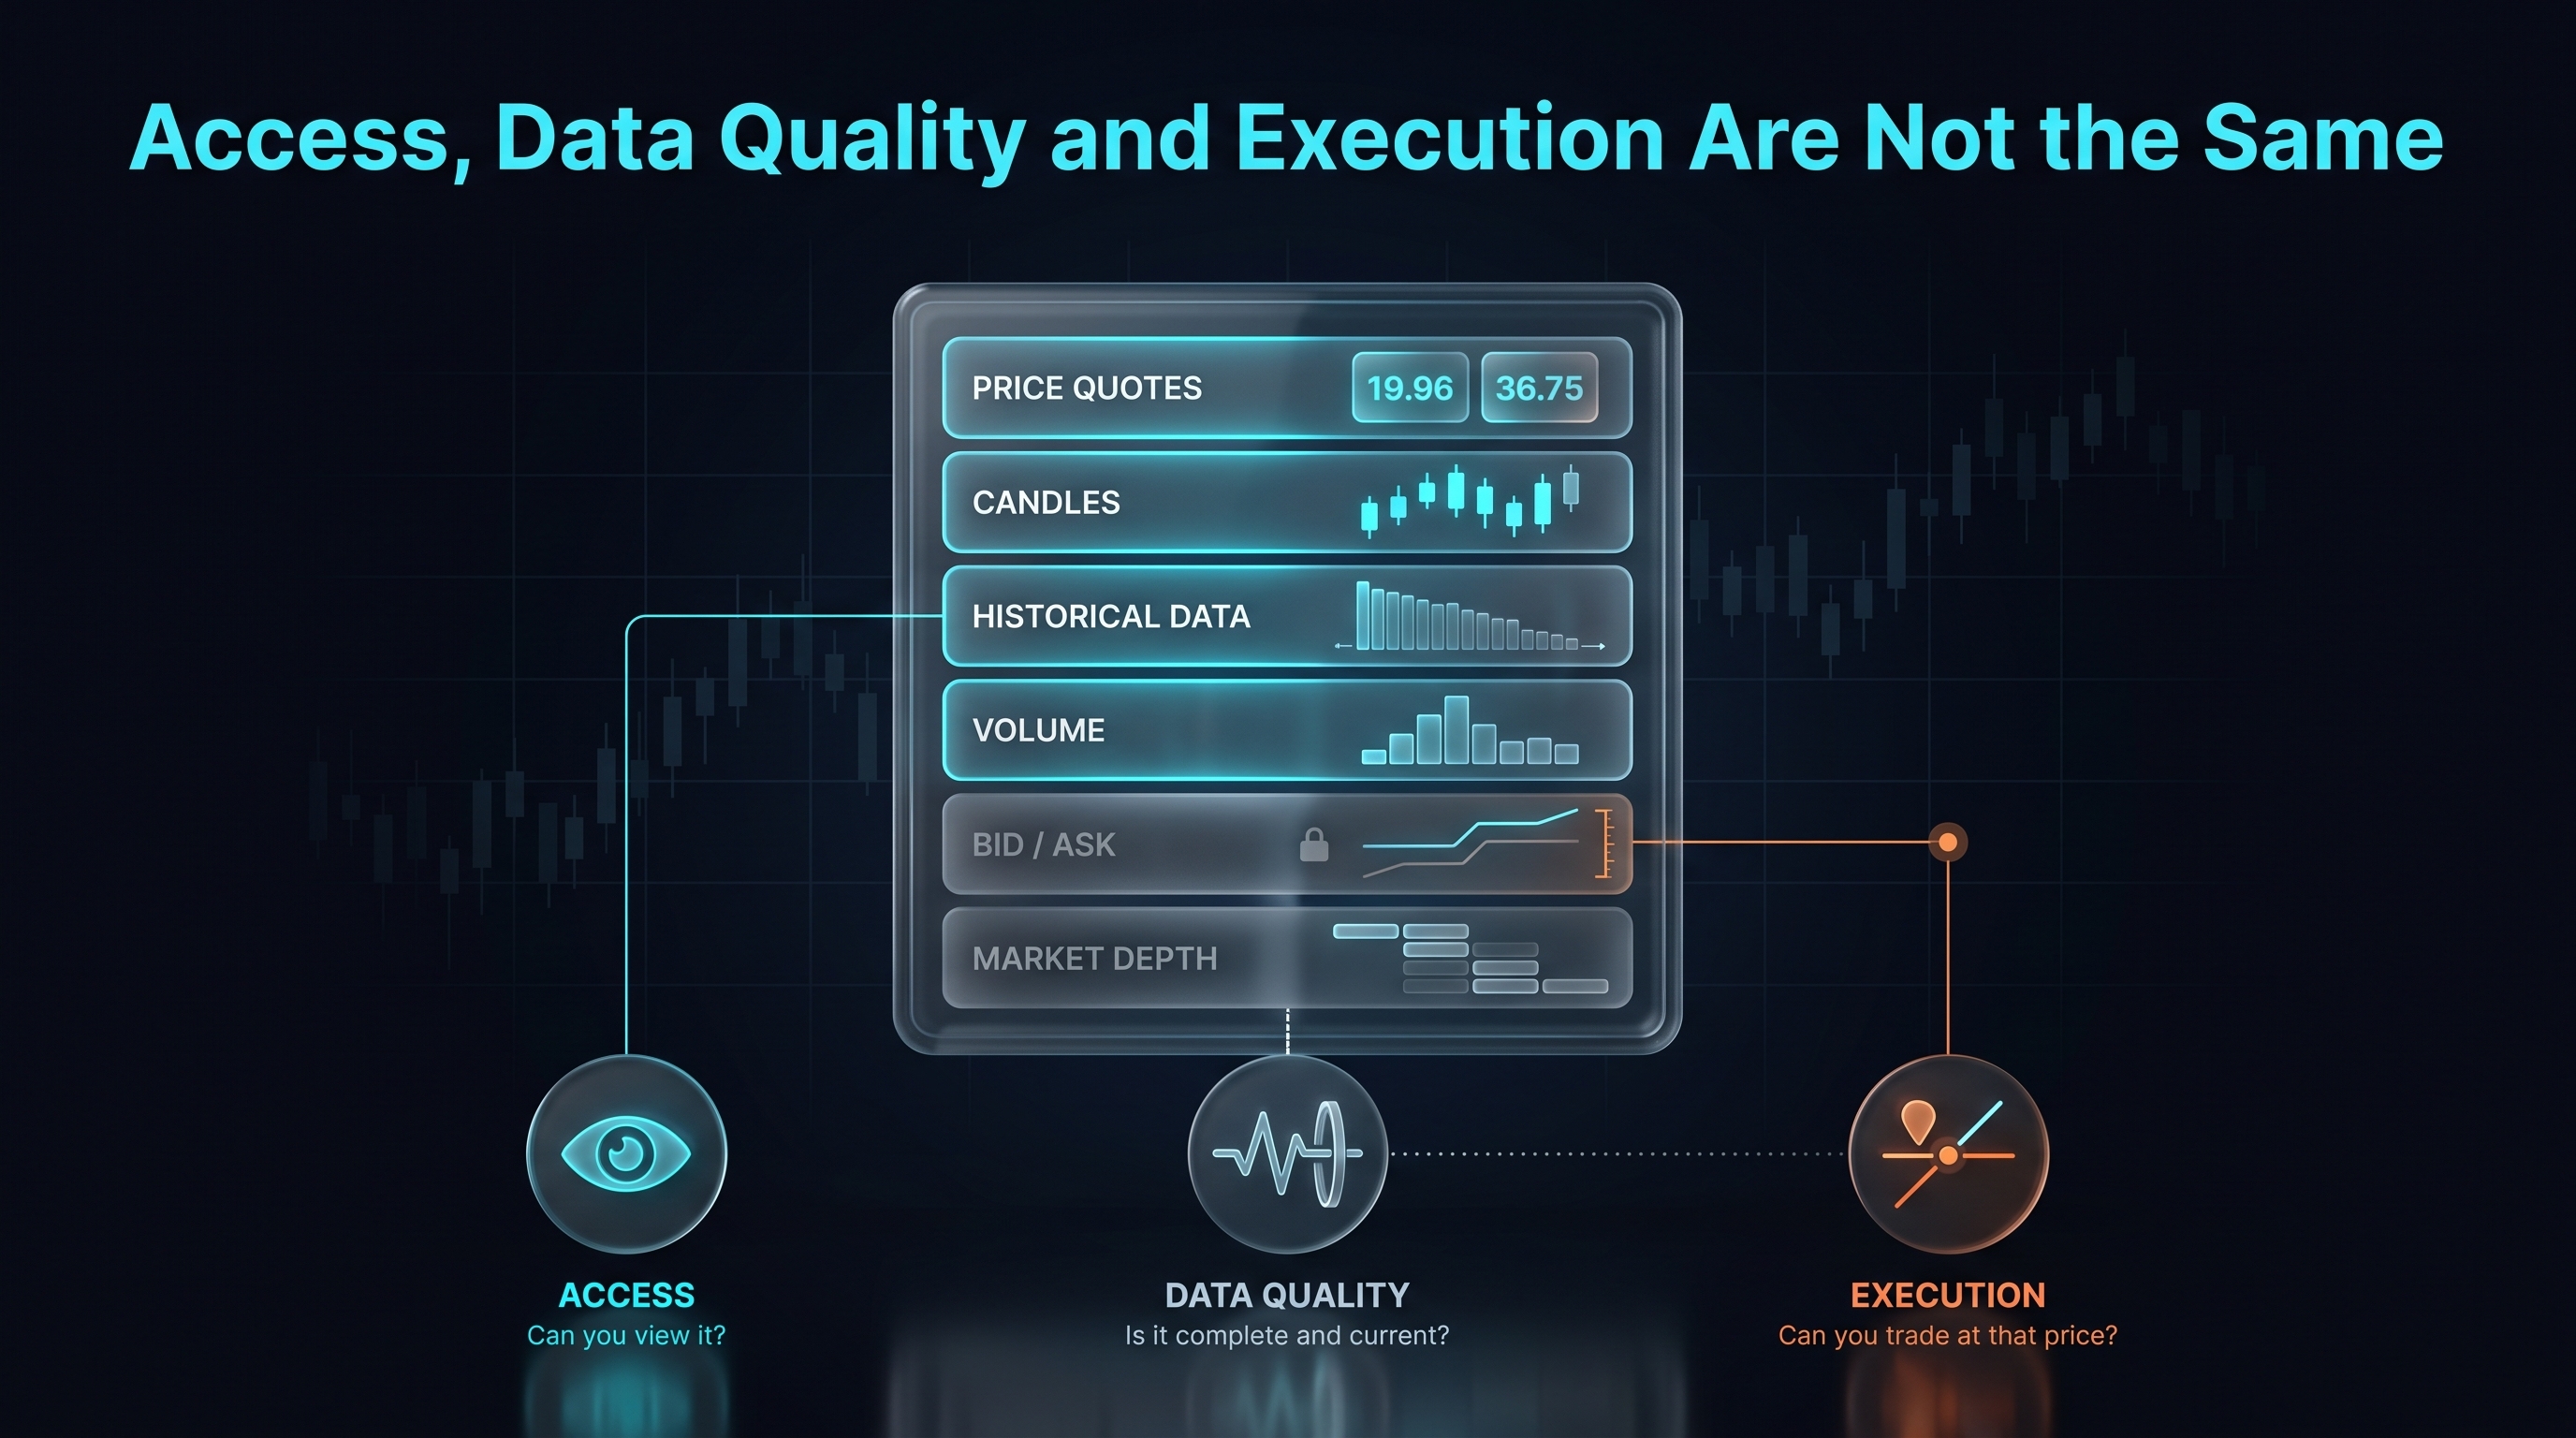
Free market data in crypto prop trading can include price quotes, candles, volume, historical information, and other market related data without a separate data fee.
The exact package depends on the platform. A basic feed may provide current prices and historical candles, while a more detailed feed may include bid and ask prices, volume, multiple timeframes, recent transactions, or market depth.
Some platforms may provide these features to all traders, while others may restrict specific instruments or data features based on account type.
The important distinction is between access, data quality, and execution. These are related, but they are not the same thing.
A trader can have free access to a chart without knowing whether the feed is delayed. A fast moving chart does not necessarily show an executable bid or ask price. And access to market data does not eliminate spreads, commissions, funding, slippage, or other trading costs.
How Can Traders Tell Whether Market Data Is Real Time?
Real time market data should be evaluated through observable behavior rather than assumed from promotional language.
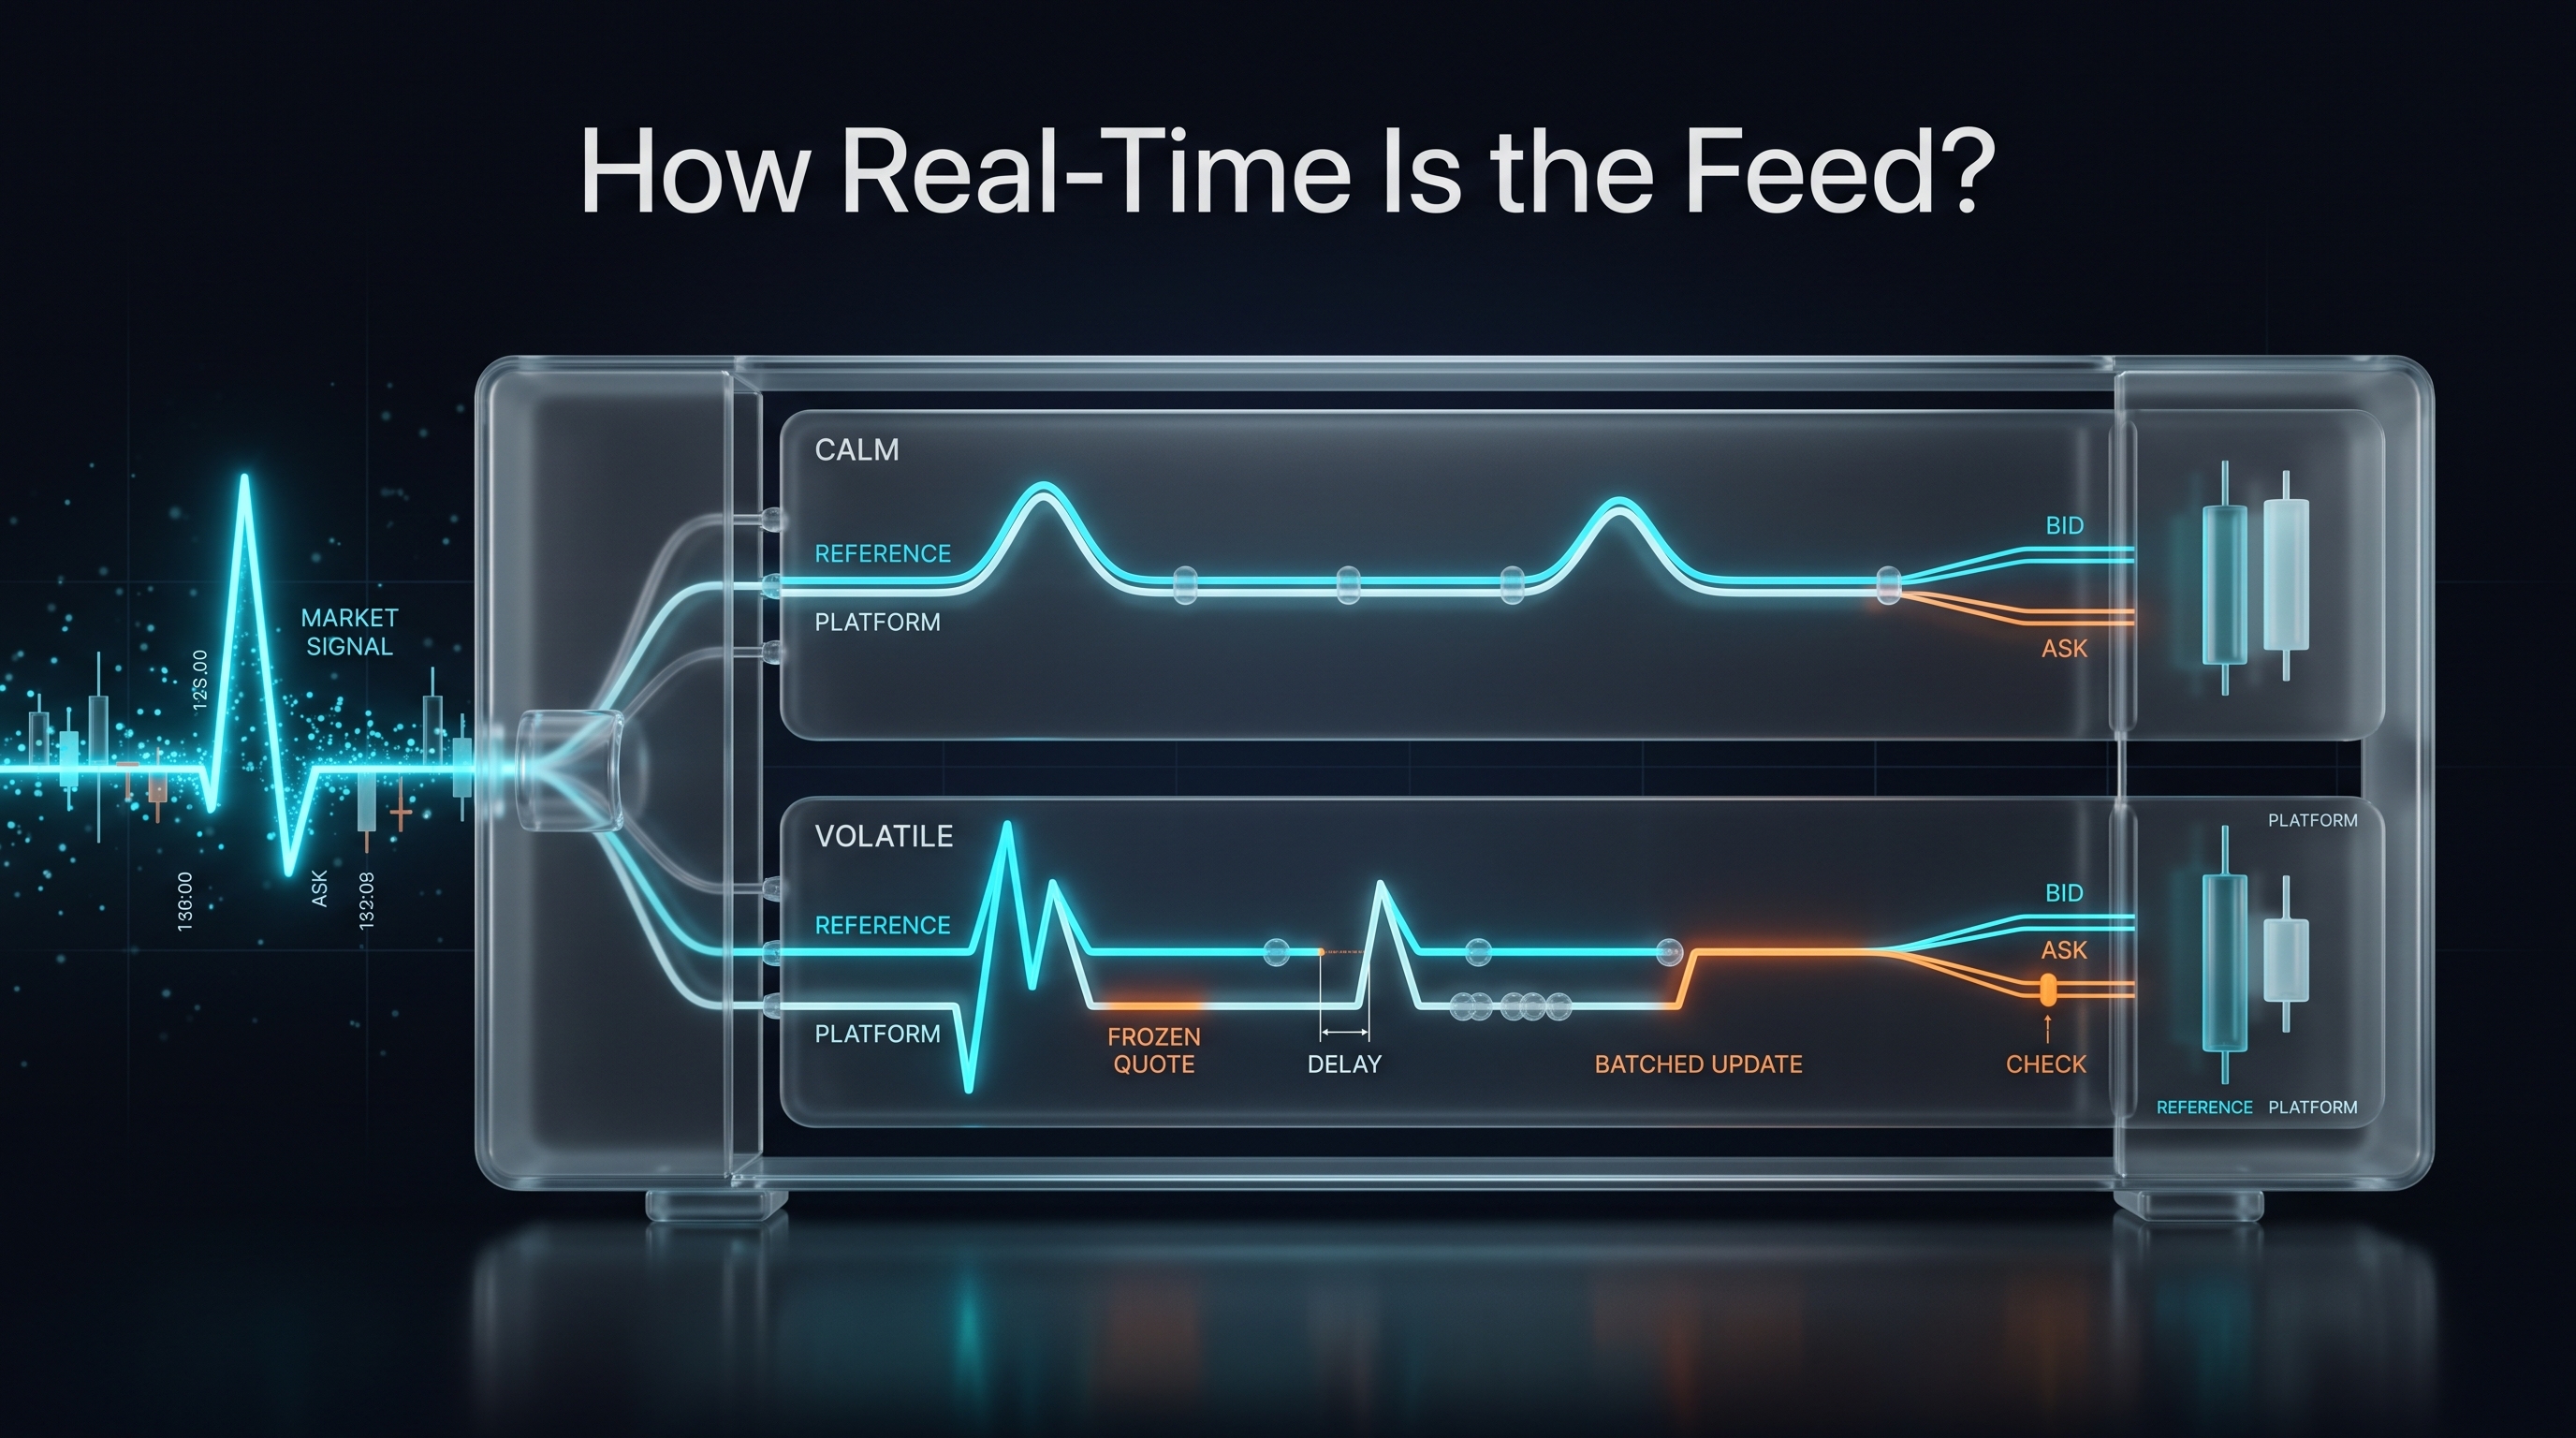
Traders can compare quote updates, timestamps, candle formation, and bid/ask prices with an independent market source. This comparison is most useful when performed under both calm and volatile conditions.
A delayed feed can still produce normal looking candles. Similarly, a reference based price can follow the general direction of the market while missing some short term movements.
Useful signs to observe include:
How quickly prices update after a sharp market movement
Whether quotes remain unchanged while independent sources are moving
Whether several seconds of price movement appear at once
Whether candle highs and lows differ materially from comparable sources
Whether bid and ask prices are updated consistently
Whether the platform behaves differently during volatile periods
These observations do not automatically prove that a feed is synthetic, delayed, or unreliable. Different legitimate sources can show different prices because they use different exchanges, liquidity pools, or aggregation methods.
The goal is to identify persistent or unexplained differences, not to demand that every platform display exactly the same number.
Why Do Timestamps Matter?
A price without timing information is difficult to evaluate.
If a platform does not clearly show when a quote was updated, traders may not know whether the displayed price represents current market activity or simply the latest available observation.
Timestamps are particularly useful when reviewing candle formation. Traders can compare when a candle opens, when it closes, and when significant price movements appear on different sources.
A simple record using notes, screenshots, or screen recordings can help identify whether one platform repeatedly reacts later than another.
The purpose is not necessarily to calculate a perfect latency measurement. It is to establish an observable record of how the feed behaves.
Do Prices Need to Match Other Platforms Exactly?
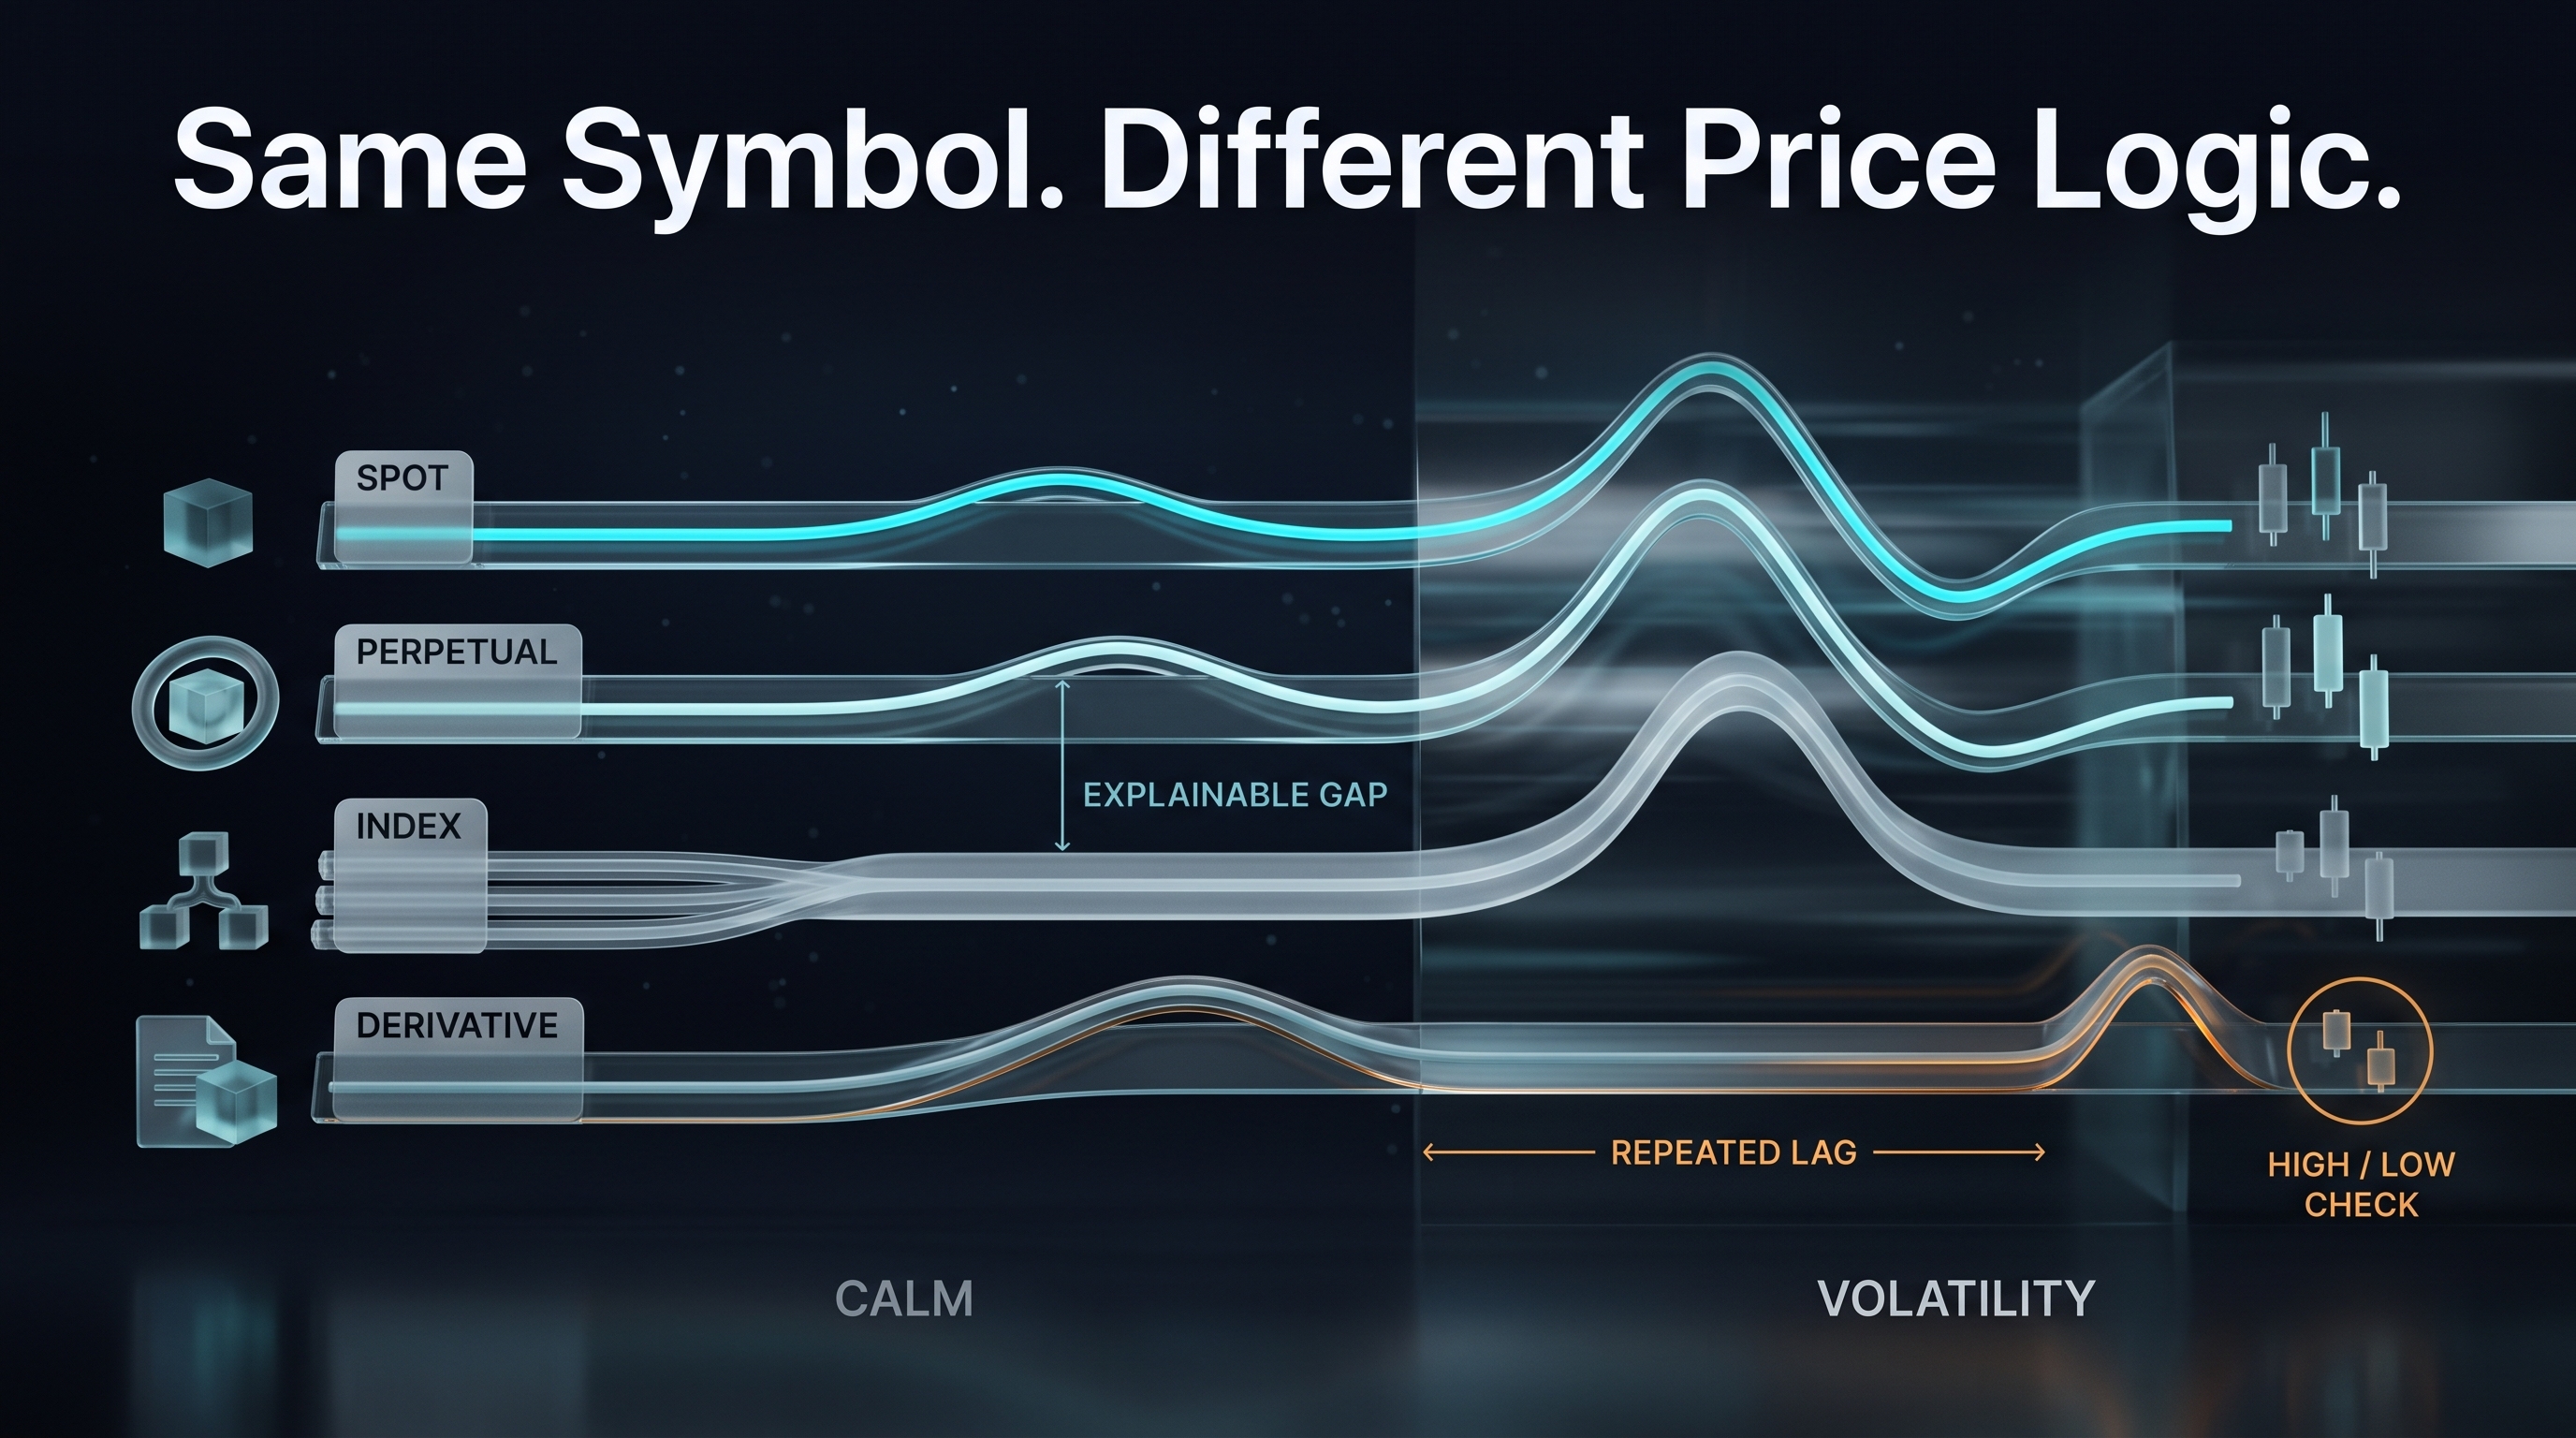
No. Different legitimate market data sources can display slightly different prices. One platform may show the last traded price, while another displays a bid, ask, or aggregated index. Different exchanges can also have different liquidity and order flow. A useful comparison should therefore focus on behavior rather than exact numerical equality.
Ask:
Is the difference consistent with the type of price being displayed?
Is any delay explainable?
Does the difference become larger during volatility?
Are the instruments actually the same type of market?
For example, a spot asset, perpetual contract, index, and broker specific derivative may have similar symbols while following different pricing logic.
A small difference during quiet conditions may be insignificant. A repeated delay during rapid movements or a large unexplained difference in candle highs and lows deserves closer investigation.
Where Does Crypto Prop Firm Market Data Come From?
Knowing that a feed is available for free does not explain its source.
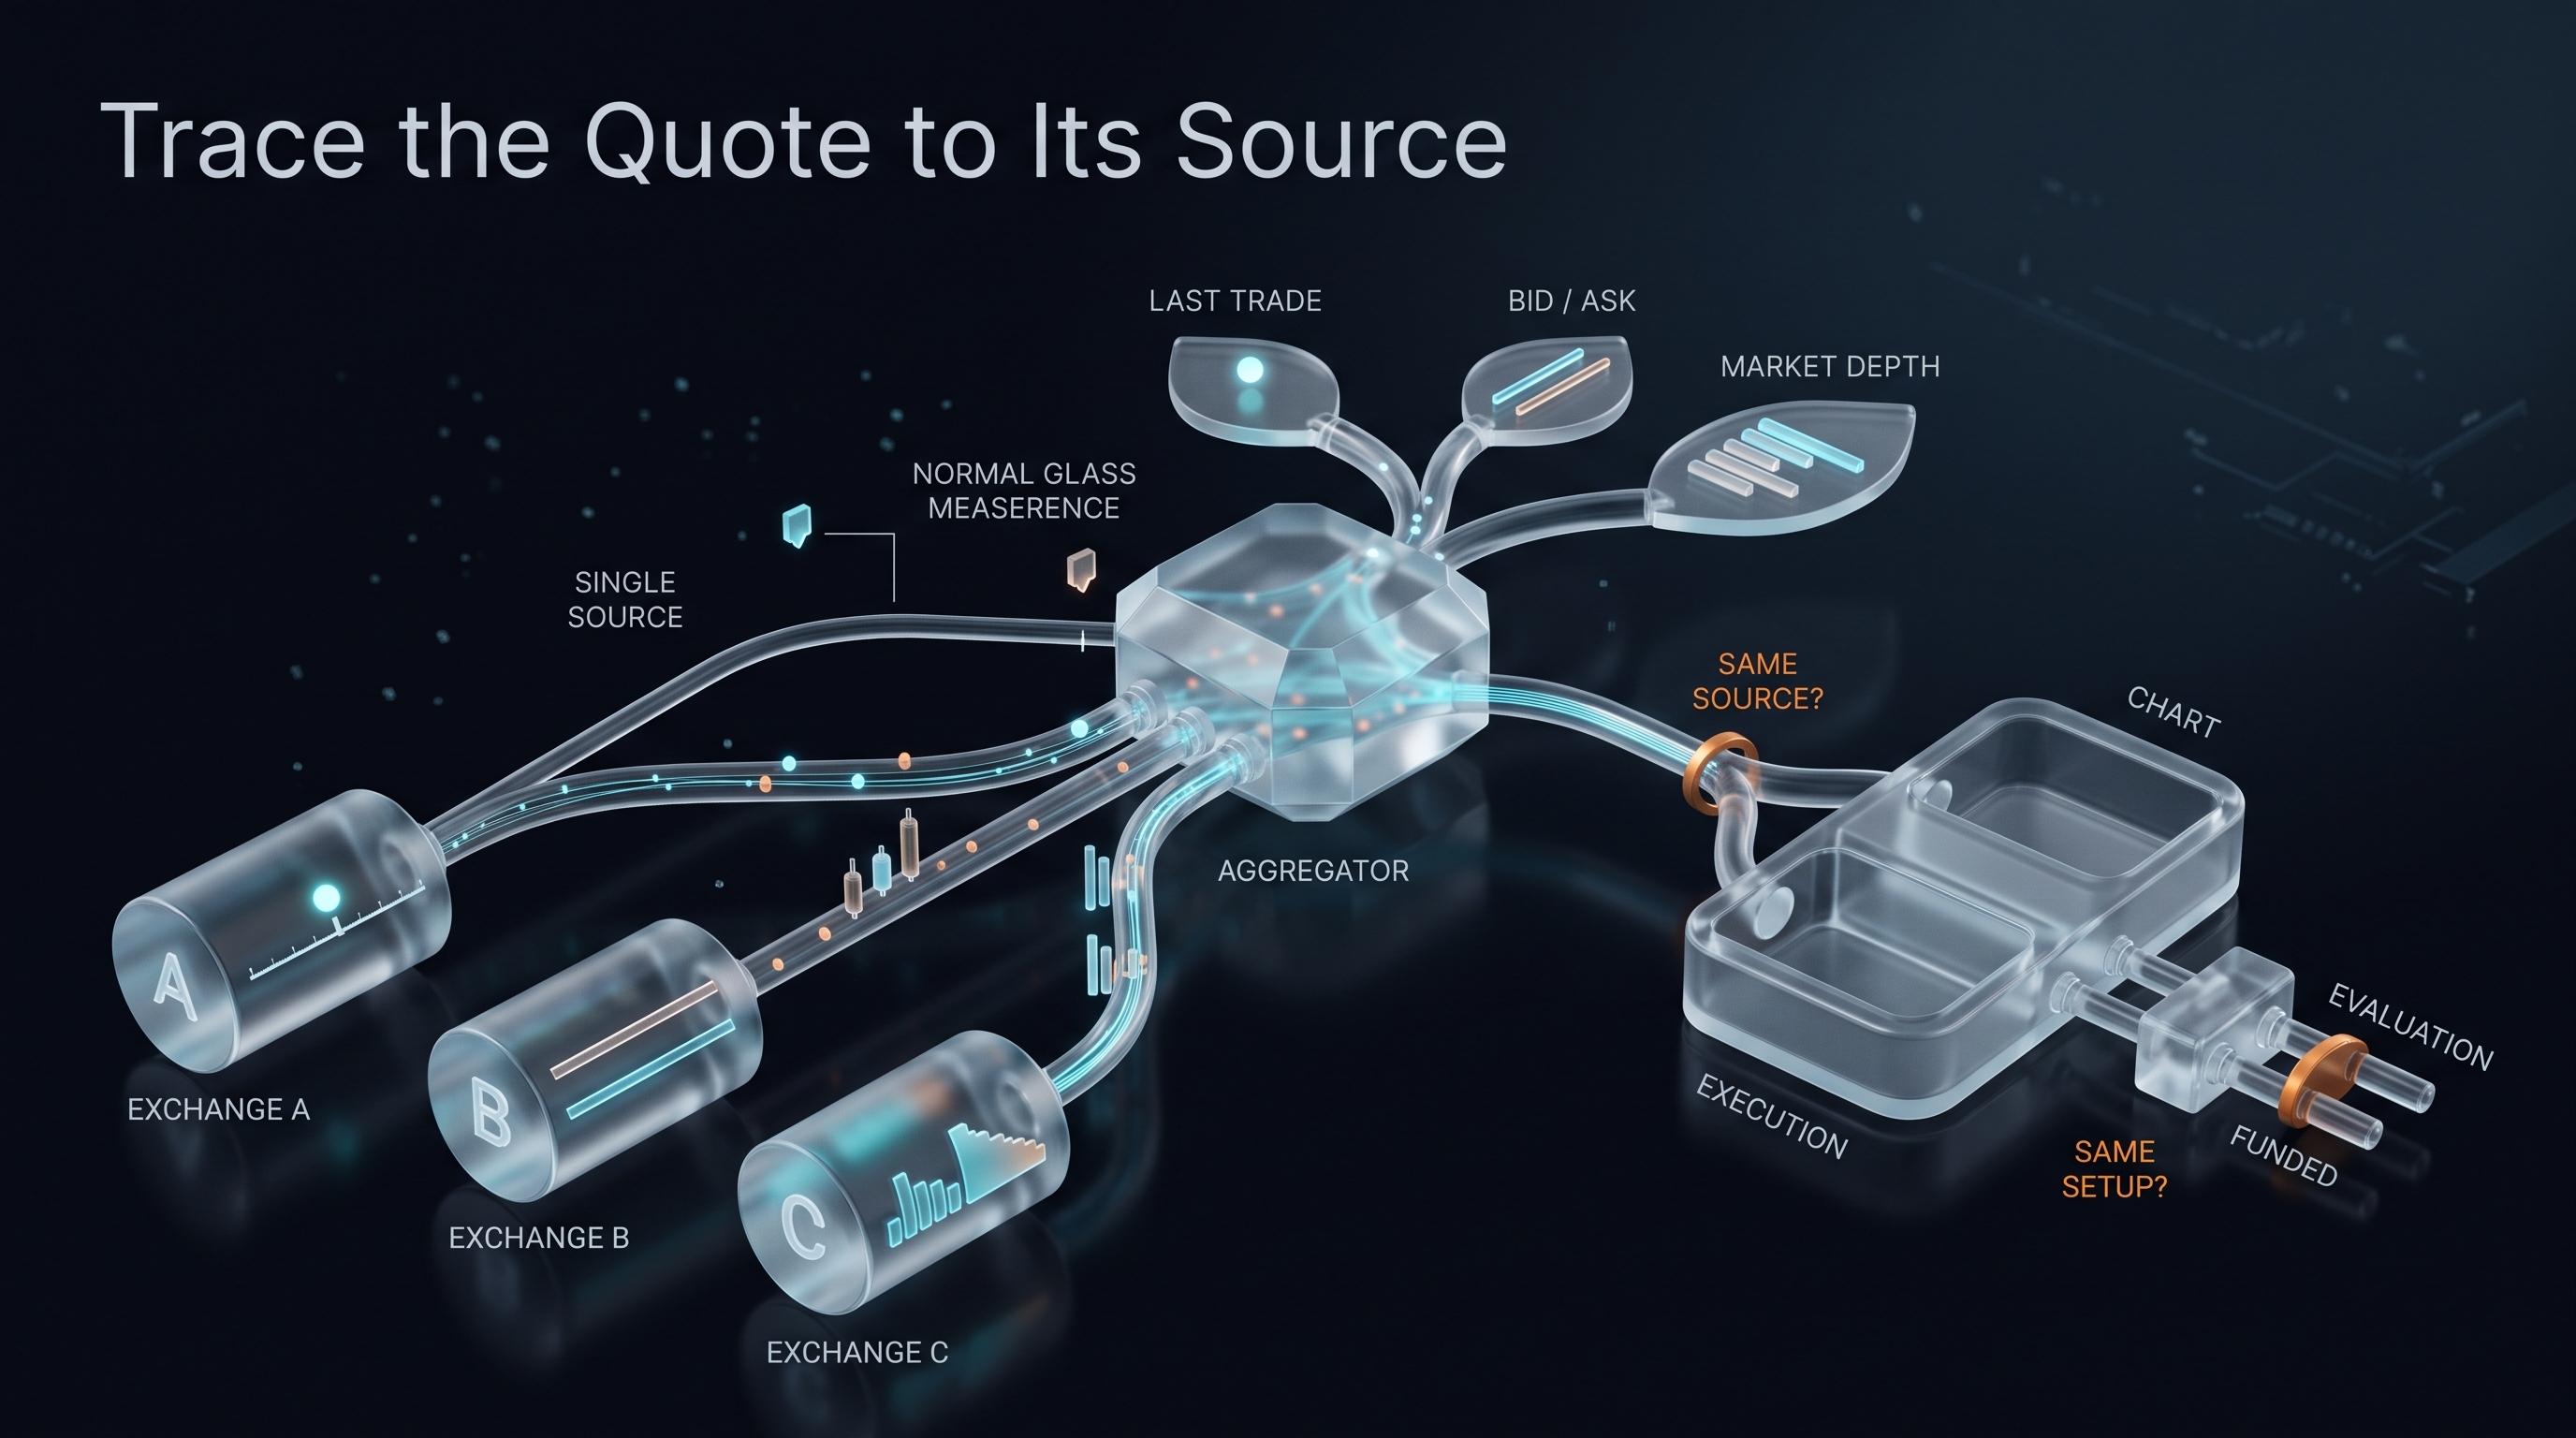
Crypto prop firms may use prices from a single exchange, multiple exchanges, liquidity providers, aggregators, indexes, reference models, or combinations of these sources.
The pricing model matters because the source determines what the displayed price represents and how closely it may correspond to a particular trading venue or executable quote.
How Does Exchange Linked Data Work?
Exchange linked data connects a platform to one or more external market sources.
The source may be a single exchange, several exchanges, or an aggregator that combines information from multiple venues. Depending on the setup, the data may include bid and ask prices, last traded prices, historical candles, volume, and potentially market depth.
Exchange linked data can reflect changes in liquidity and trading activity more directly than an internally generated reference price.
However, exchange linked does not mean that every platform will display the same quote.
A platform connected to one exchange may show a different price from an aggregator combining several venues. Likewise, the last traded price on one exchange may differ from the best available bid or ask elsewhere.
For traders, the important questions are:
Which source or sources are used?
Is the data aggregated?
Does the chart use the same source as execution?
Which type of price is displayed?
Are these conditions the same during evaluation and funded trading?
What Is Aggregated or Reference Pricing?
Aggregated pricing combines information from multiple sources to create a broader market reference.
Reference pricing can also use an index, basket, or another calculation intended to represent market movement rather than reproduce every transaction occurring on one exchange.
These approaches can provide a useful representation of the broader market, but they may behave differently from a single exchange during short periods of volatility.
For example, a reference price may follow the overall direction of an asset while producing different candle highs, lows, or short term movements from a specific exchange.
The model itself does not determine whether a trading environment is suitable. Traders need to understand what the price represents and whether it matches the requirements of their strategy.
What Is Synthetic Pricing?
Synthetic or internally generated pricing may use an index, reference basket, internal calculation, or another data stream to represent market movement.
A synthetic feed can produce a controlled trading environment, but it may differ from direct exchange conditions in areas such as:
Price spikes
Candle wicks
Highs and lows
Spread behavior
Stop loss triggers
Execution prices
Floating profit and loss
During calm market conditions, these differences may be difficult to notice. During a rapid move, they can become more visible.
A synthetic feed is not automatically unusable. The key issue is transparency. Traders should understand what they are testing before interpreting the results of a backtest or evaluation.
Why Does the Pricing Model Matter?
A trading strategy is tested against specific prices, spreads, and execution rules.
Consider a breakout strategy that uses the previous candle’s high as an entry trigger. If one price source records a high above that level while another does not, the same strategy can generate different trades.
The same issue can occur with stop losses. A chart may display one type of price while the platform triggers a stop according to bid, ask, or another reference.
This does not necessarily mean that one source is incorrect. It means that the trading environment affects how a strategy behaves.
Before relying on backtests or evaluation results, traders should understand the pricing model behind the data.
Does Market Data Match Trade Execution?
One of the most important questions for a crypto prop trader is whether the price shown on the chart is the same price used to calculate an order fill or trigger a stop.
A chart can update quickly while the execution engine uses another quote source or another type of price. Even when the chart and execution system use related data, the displayed price may not be directly executable.
Understanding this distinction can help traders interpret differences between expected and actual trade outcomes.
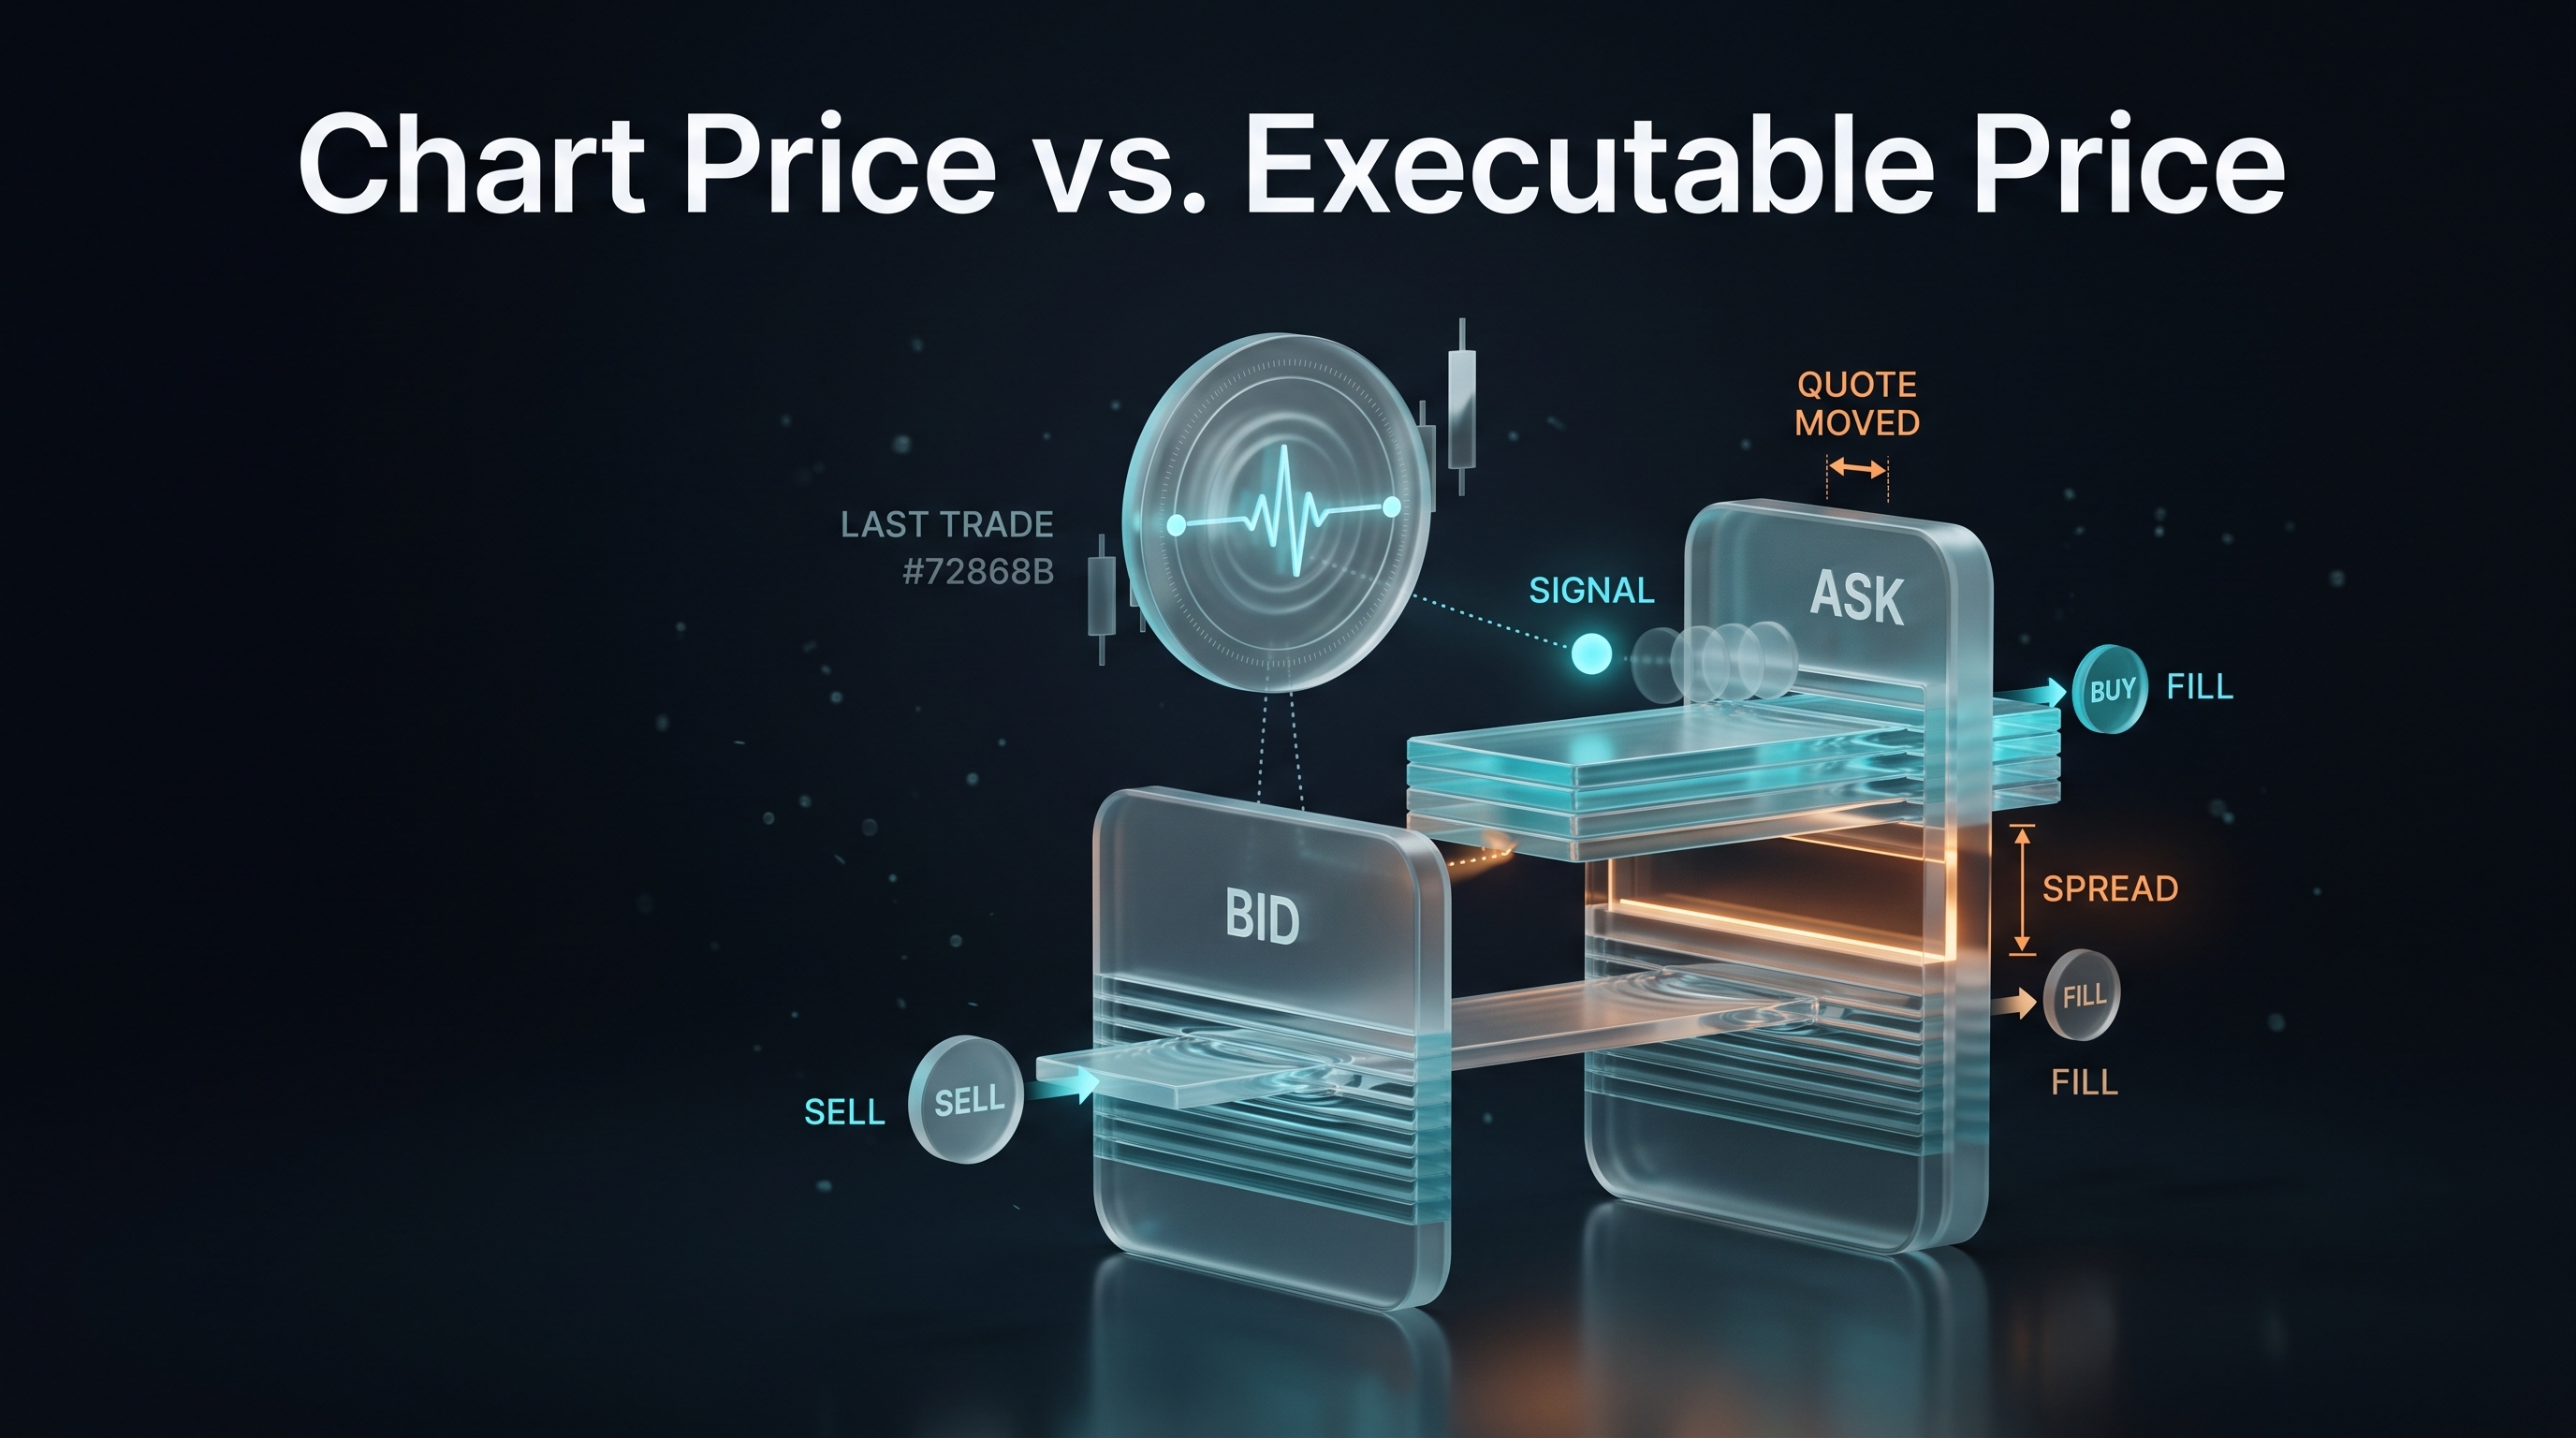
Chart Price vs. Executable Price
A chart may display the last traded price, while a buy order is executed against the ask and a sell order against the bid.
As a result, the price visible on a chart is not necessarily the price at which a trader can immediately buy or sell.
The quote may also change between the moment a signal appears and the moment an order is processed. Spread changes and liquidity conditions can create additional differences.
Traders should therefore compare the type of price, not just the number.
A last traded price represents where a recent transaction occurred. A bid or ask represents a current side of the market. These prices can be different even when both are legitimate.
Are Bid and Ask Prices Visible?
The bid is generally the price available for selling, while the ask is generally the price available for buying. The difference between them is the spread.
A single chart price does not reveal the complete trading cost.
Bid and ask visibility becomes particularly important for scalpers, breakout traders, and strategies that use narrow stops or small profit targets.
Traders should check:
Whether both bid and ask prices are visible
How the spread behaves during normal conditions
How wide the spread becomes during volatility
Whether weekend conditions differ
Whether spreads widen during thin liquidity
A chart may appear stable while the bid and ask become significantly wider.
How Does Slippage Affect Traders?
Slippage is the difference between the expected execution price and the actual fill.
Some slippage is a normal part of trading, particularly during fast markets when available liquidity can change between order submission and execution.
The more useful question is whether slippage is occasional and explainable or persistent and difficult to reconcile with the displayed market.
Slippage can have a larger effect on strategies that use:
Small profit targets
Tight stop losses
Frequent entries
Market orders
Thinly traded instruments
A free market data feed does not eliminate these conditions. It only means that traders are not paying a separate fee to access the data.
Can a Chart Price Differ From a Fill Price?
Yes. Several normal mechanisms can create a difference.
The chart may display the last traded price while a buy order uses the ask. A sell order may use the bid. The quote can also change between the signal and order confirmation.
Additional differences can result from:
Spread widening
Liquidity changes
Different symbols
Different data sources
Reference or index pricing
Execution latency
The important point is that a chart price and an executable price serve different purposes.
Traders should understand which price the platform uses for entries, exits, stop losses, floating profit and loss, daily loss, and maximum drawdown.
Does the Chart Use the Same Data as Execution?
A platform may use one feed for charting and another for calculating fills.
Such an arrangement may exist for operational reasons, but the difference should be transparent.
Traders should determine:
Whether the chart and order ticket use the same symbol
Whether the chart displays last price, bid, ask, index, or another reference
Which price triggers stop losses
Whether the execution engine uses the same source as the chart
Whether evaluation and funded accounts use the same conditions
If these details are unclear, chart analysis and actual execution may not be directly comparable.
Is Historical Data Consistent With Live Data?
Historical data is important for backtesting and strategy evaluation, but simply having historical candles is not enough.
Traders should determine:
How far the historical data extends
Whether the historical series contains gaps
Whether the historical source matches the live source
Whether volume represents a specific exchange or an aggregated estimate
A backtest based on one data source followed by live execution through another can produce misleading results.
Historical and live data do not have to be perfectly identical, but material differences should be understood before traders rely heavily on backtest results.
Does Order Book Depth Matter?
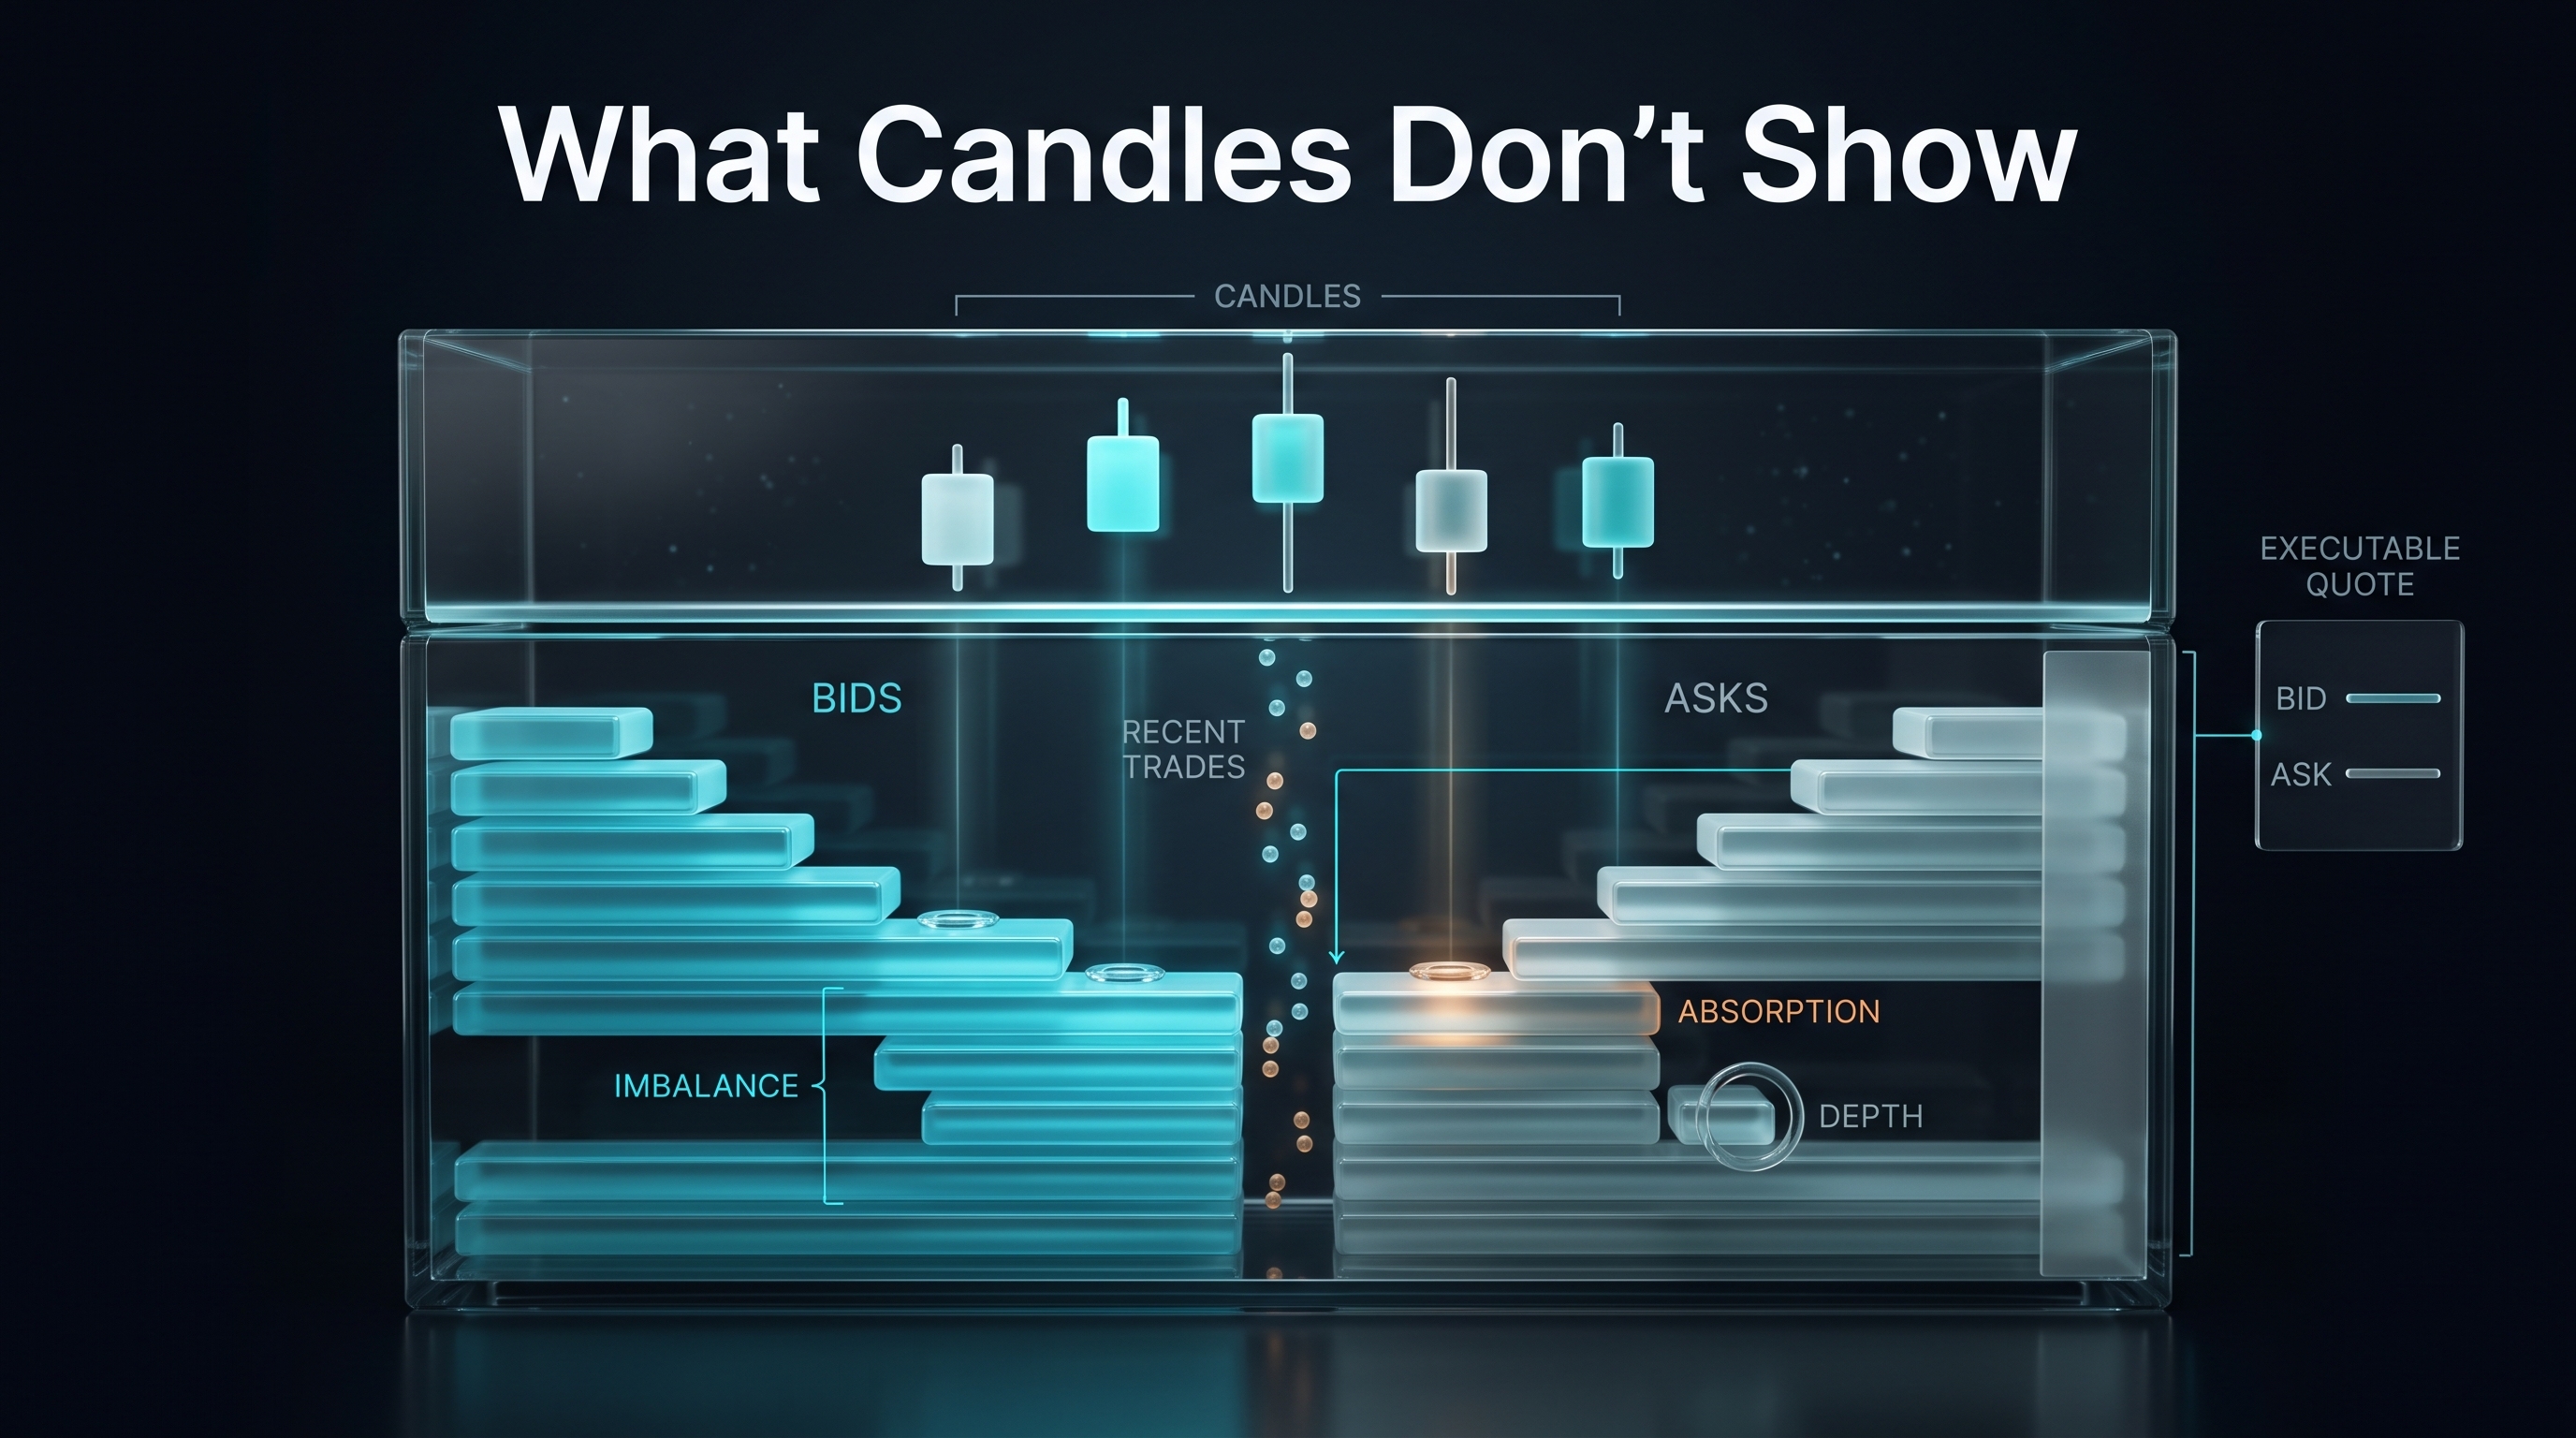
Order book depth shows buying and selling interest at different price levels.
It can be important for traders who use:
Liquidity analysis
Order flow imbalance
Market absorption
Recent transactions
Depth based strategies
The absence of a full order book does not automatically mean that market data is poor. Some platforms can provide executable quotes without exposing the underlying market depth.
The important point is that traders should not assume they are receiving order flow information simply because a platform provides a standard candle chart.
Candles show the result of buying and selling, but they do not show every order that created the movement.
What Should a Crypto Prop Firm Disclose About Market Data?
A crypto prop firm should provide enough information for traders to understand what their charts represent and how market data affects account calculations.
The most useful disclosures concern:
Price source
Update behavior
Symbol definitions
Bid and ask prices
Spread structure
Execution conditions
Stop loss triggers
Differences between evaluation and funded accounts
Traders do not necessarily need a complete technical diagram of a provider’s infrastructure. They do need enough information to understand how prices are generated and how those prices affect trades.
Where Does the Price Feed Come From?
A provider should explain whether prices come from:
One exchange
Multiple exchanges
Liquidity providers
An aggregator
An index
A reference model
A combination of sources
Phrases such as professional pricing or institutional liquidity do not necessarily explain the underlying mechanism.
If the exact source cannot be disclosed, the provider should still explain how prices are generated, monitored, and used for trading and account calculations.
Does the Provider Explain the Execution Model?
The execution model should clarify how orders are filled and how stops are triggered.
Traders should understand whether the platform uses:
Bid
Ask
Last traded price
Index price
Mark price
Another reference price
These details can affect entries, exits, stop losses, floating profit and loss, daily loss, and maximum drawdown.
Are Evaluation and Funded Conditions Identical?
They may not be.
Some providers can use different symbols, account limits, or execution conditions after a trader passes an evaluation.
This does not automatically determine whether the program is suitable. It means traders should understand what the evaluation is actually testing and whether the funded stage conditions remain consistent with the strategy.
How to Verify Free Market Data Before Buying an Evaluation
The most reliable way to evaluate a free market data claim is to test the platform rather than rely entirely on promotional wording.
The following process can help traders build a practical picture before paying for an evaluation.
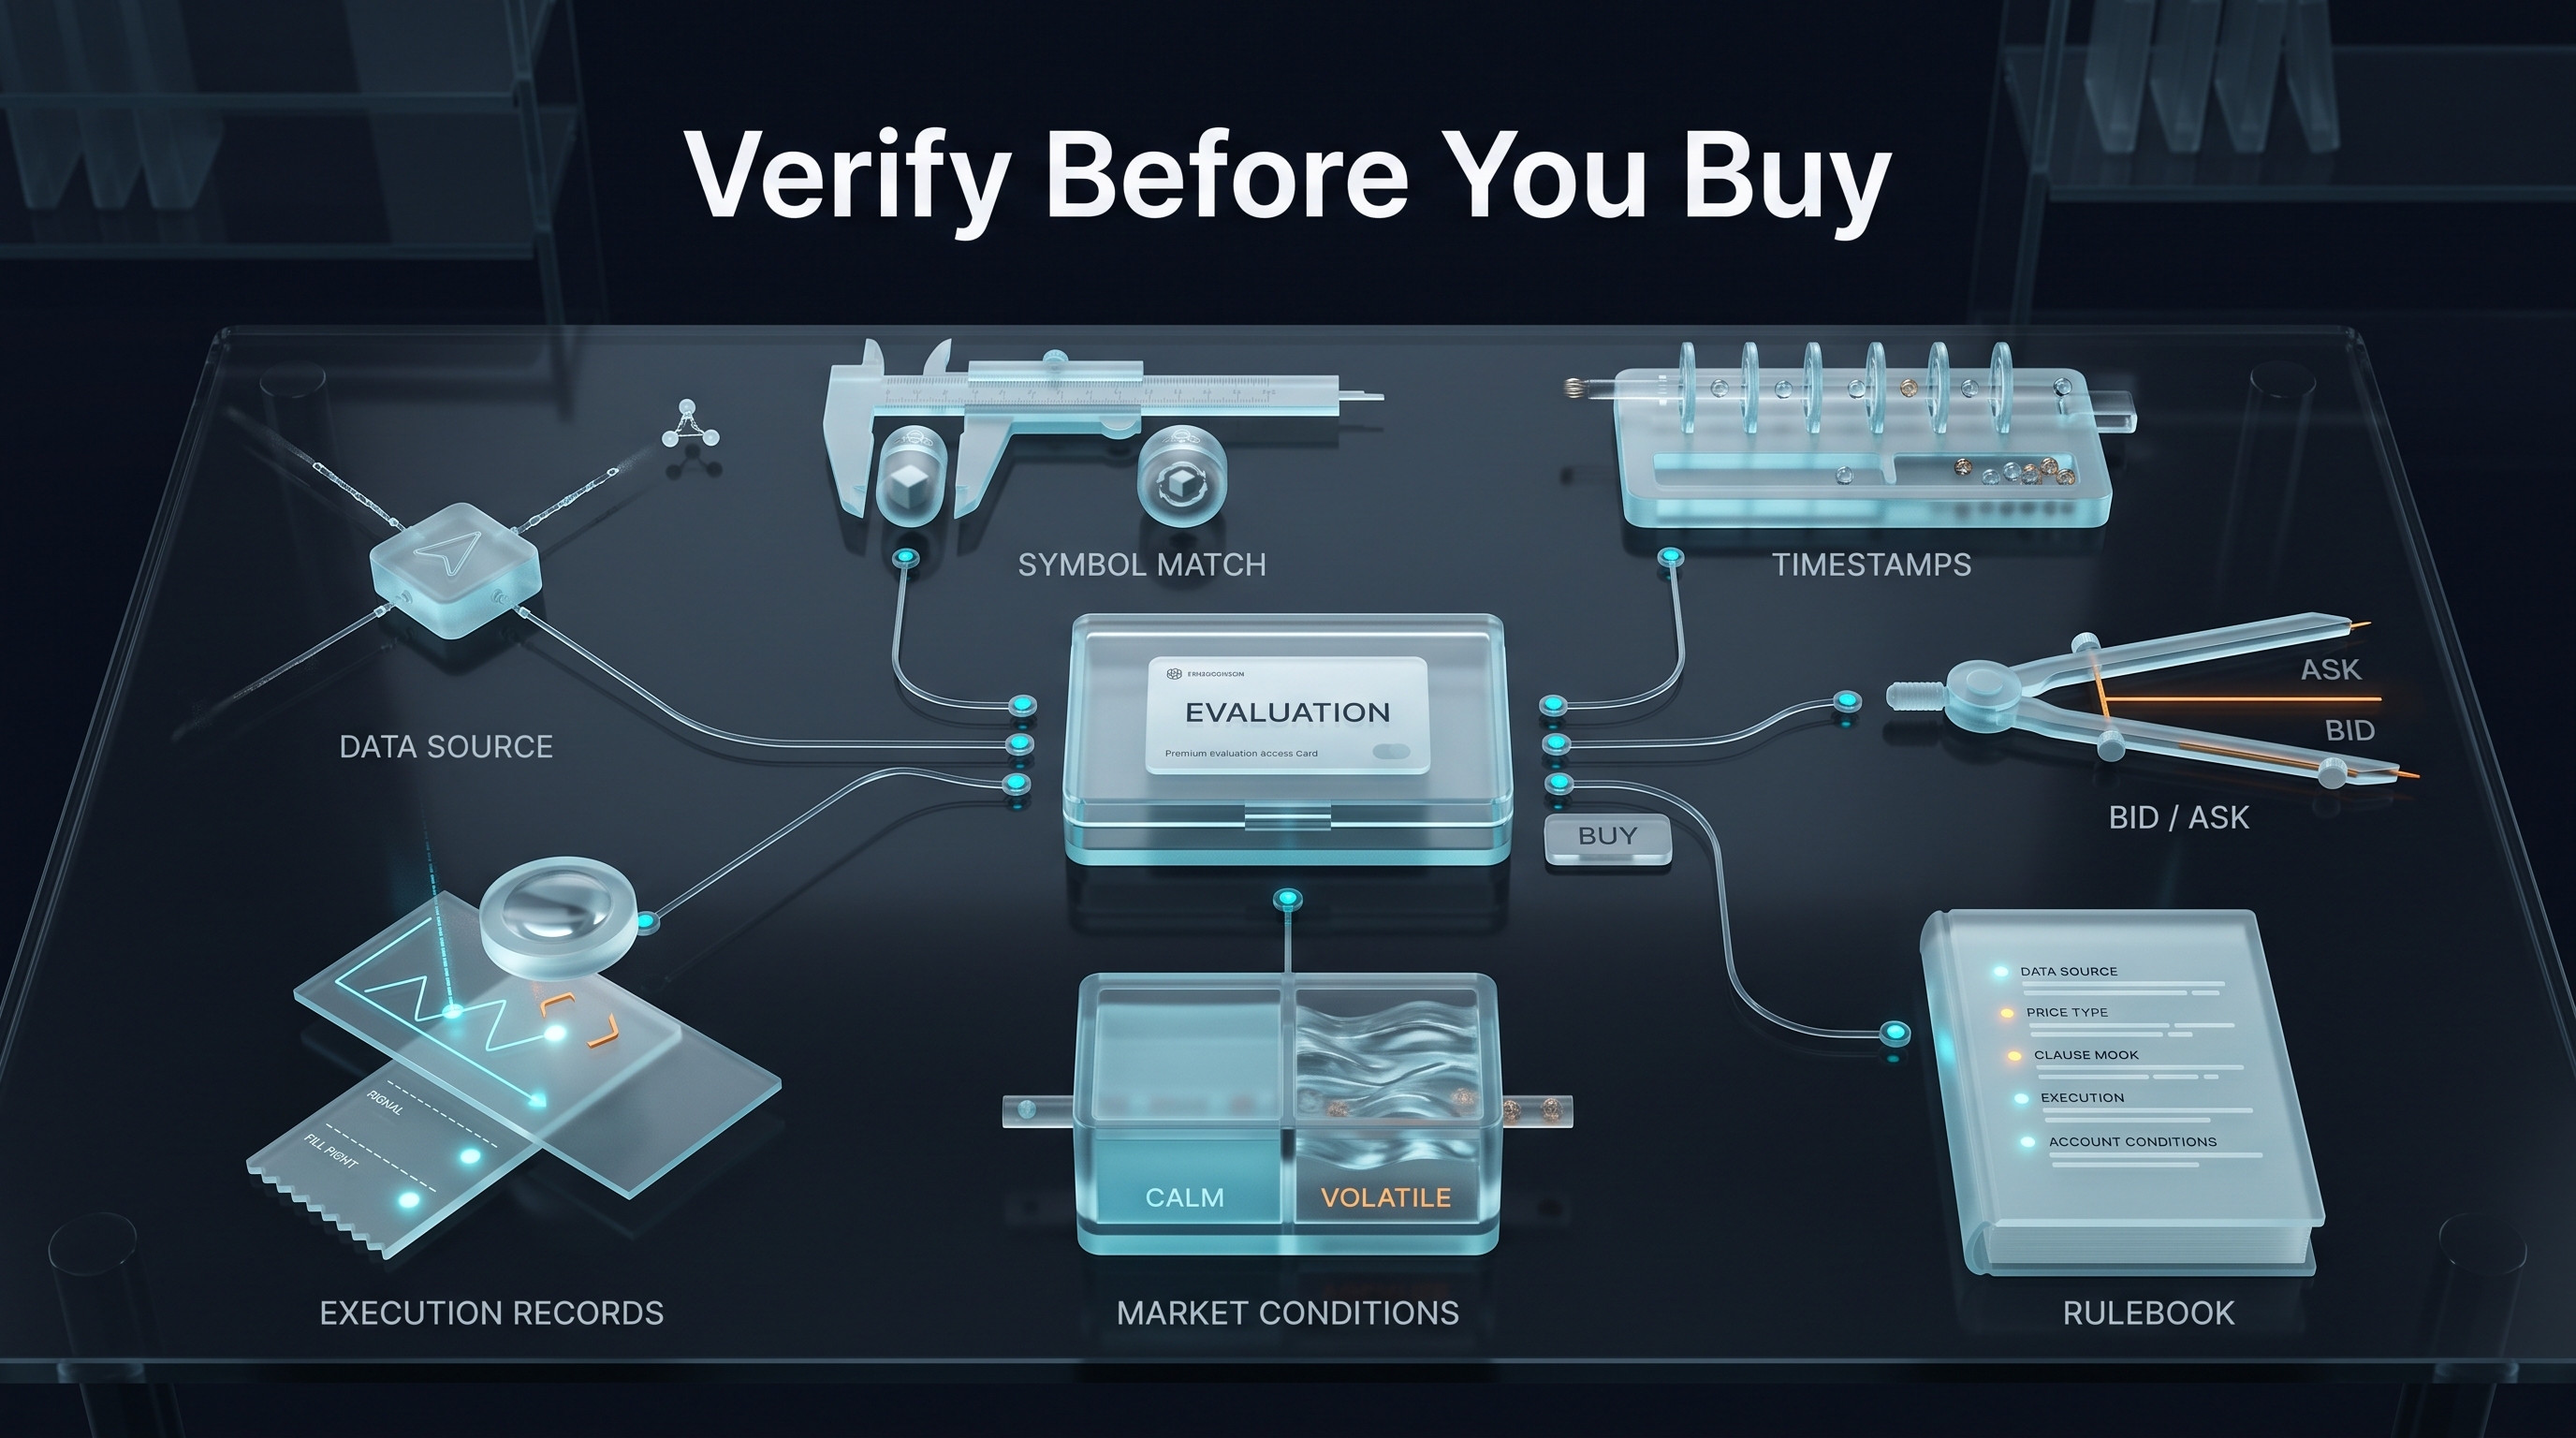
1. Identify the Data Source
Start with the provider’s documentation.
Look for information about:
Exchanges
Liquidity providers
Aggregation
Index pricing
Reference pricing
Synthetic calculations
If the information is unclear, ask support directly.
A useful answer should explain the mechanism rather than simply repeat that the platform offers real time market data.
The clarity of the response can also help traders understand how transparent the trading environment is.
2. Compare the Same Symbol With an Independent Source
Choose one or two actively traded instruments and observe them on the trading platform and an independent market source at the same time.
Compare:
Current price
Candle formation
Highs and lows
Update speed
Reaction to sudden movements
The objective is not to demand exact equality. It is to determine whether differences are reasonable and consistent with the stated pricing model.
Also confirm that the instruments are genuinely comparable. A spot asset and a perpetual contract may have similar names but different pricing behavior.
3. Check Timestamps and Update Frequency
Observe how frequently quotes change and when candles close.
Pay particular attention to periods when the market moves quickly.
A feed that updates normally in calm conditions but freezes during volatility deserves further investigation. The same applies when several seconds of movement appear at once or when a major price change arrives after independent sources have already reacted.
Notes or screen recordings can create a useful record of these observations.
4. Review Bid-Ask Behavior
Record bid and ask prices when the platform makes them available.
Observe the spread during:
Normal market activity
Volatile moves
Weekends
Thin liquidity periods
Then consider how those conditions affect the intended strategy.
A spread that is acceptable for a multi day position may be too expensive for a short term strategy with a small target.
5. Compare Displayed Prices With Execution Records
If a demo or trial environment is available, compare the price shown immediately before an order with the final fill.
Review:
Order type
Requested price
Filled price
Execution time
Spread
Slippage
A single trade cannot establish a complete pattern, but it can show what information the platform records and how transparent the execution process is.
Traders should also determine whether the chart displays a last traded price while orders execute against bid or ask.
6. Test Different Market Conditions
Do not evaluate market data only when the market is calm.
Observe the platform during:
A normal trading session
A fast directional move
A weekend period
A period of thinner liquidity
Many differences remain invisible when prices move slowly and become more apparent when spreads widen or quote updates accelerate.
The objective is not to search for one unusual event. It is to understand how the platform behaves when market conditions place greater pressure on data and execution systems.
7. Read the Full Rulebook
Important conditions may appear in the rulebook rather than on the main product page.
Review the rules covering:
Symbols
Spreads
Stop losses
Weekend holding
Market events
Funding costs
Holding fees
Evaluation conditions
Funded account conditions
Daily loss
Maximum drawdown
If a marketing page provides a general description while the terms document contains additional conditions, the written terms are more relevant to how the account is administered.
What Costs Remain When Market Data Is Free?
Free market data does not mean that trading itself is free.
A provider can include market data without an additional subscription while recovering costs through the trading environment.
These costs do not automatically indicate a poor program. The important issue is whether traders understand them and calculate their potential impact on the strategy.
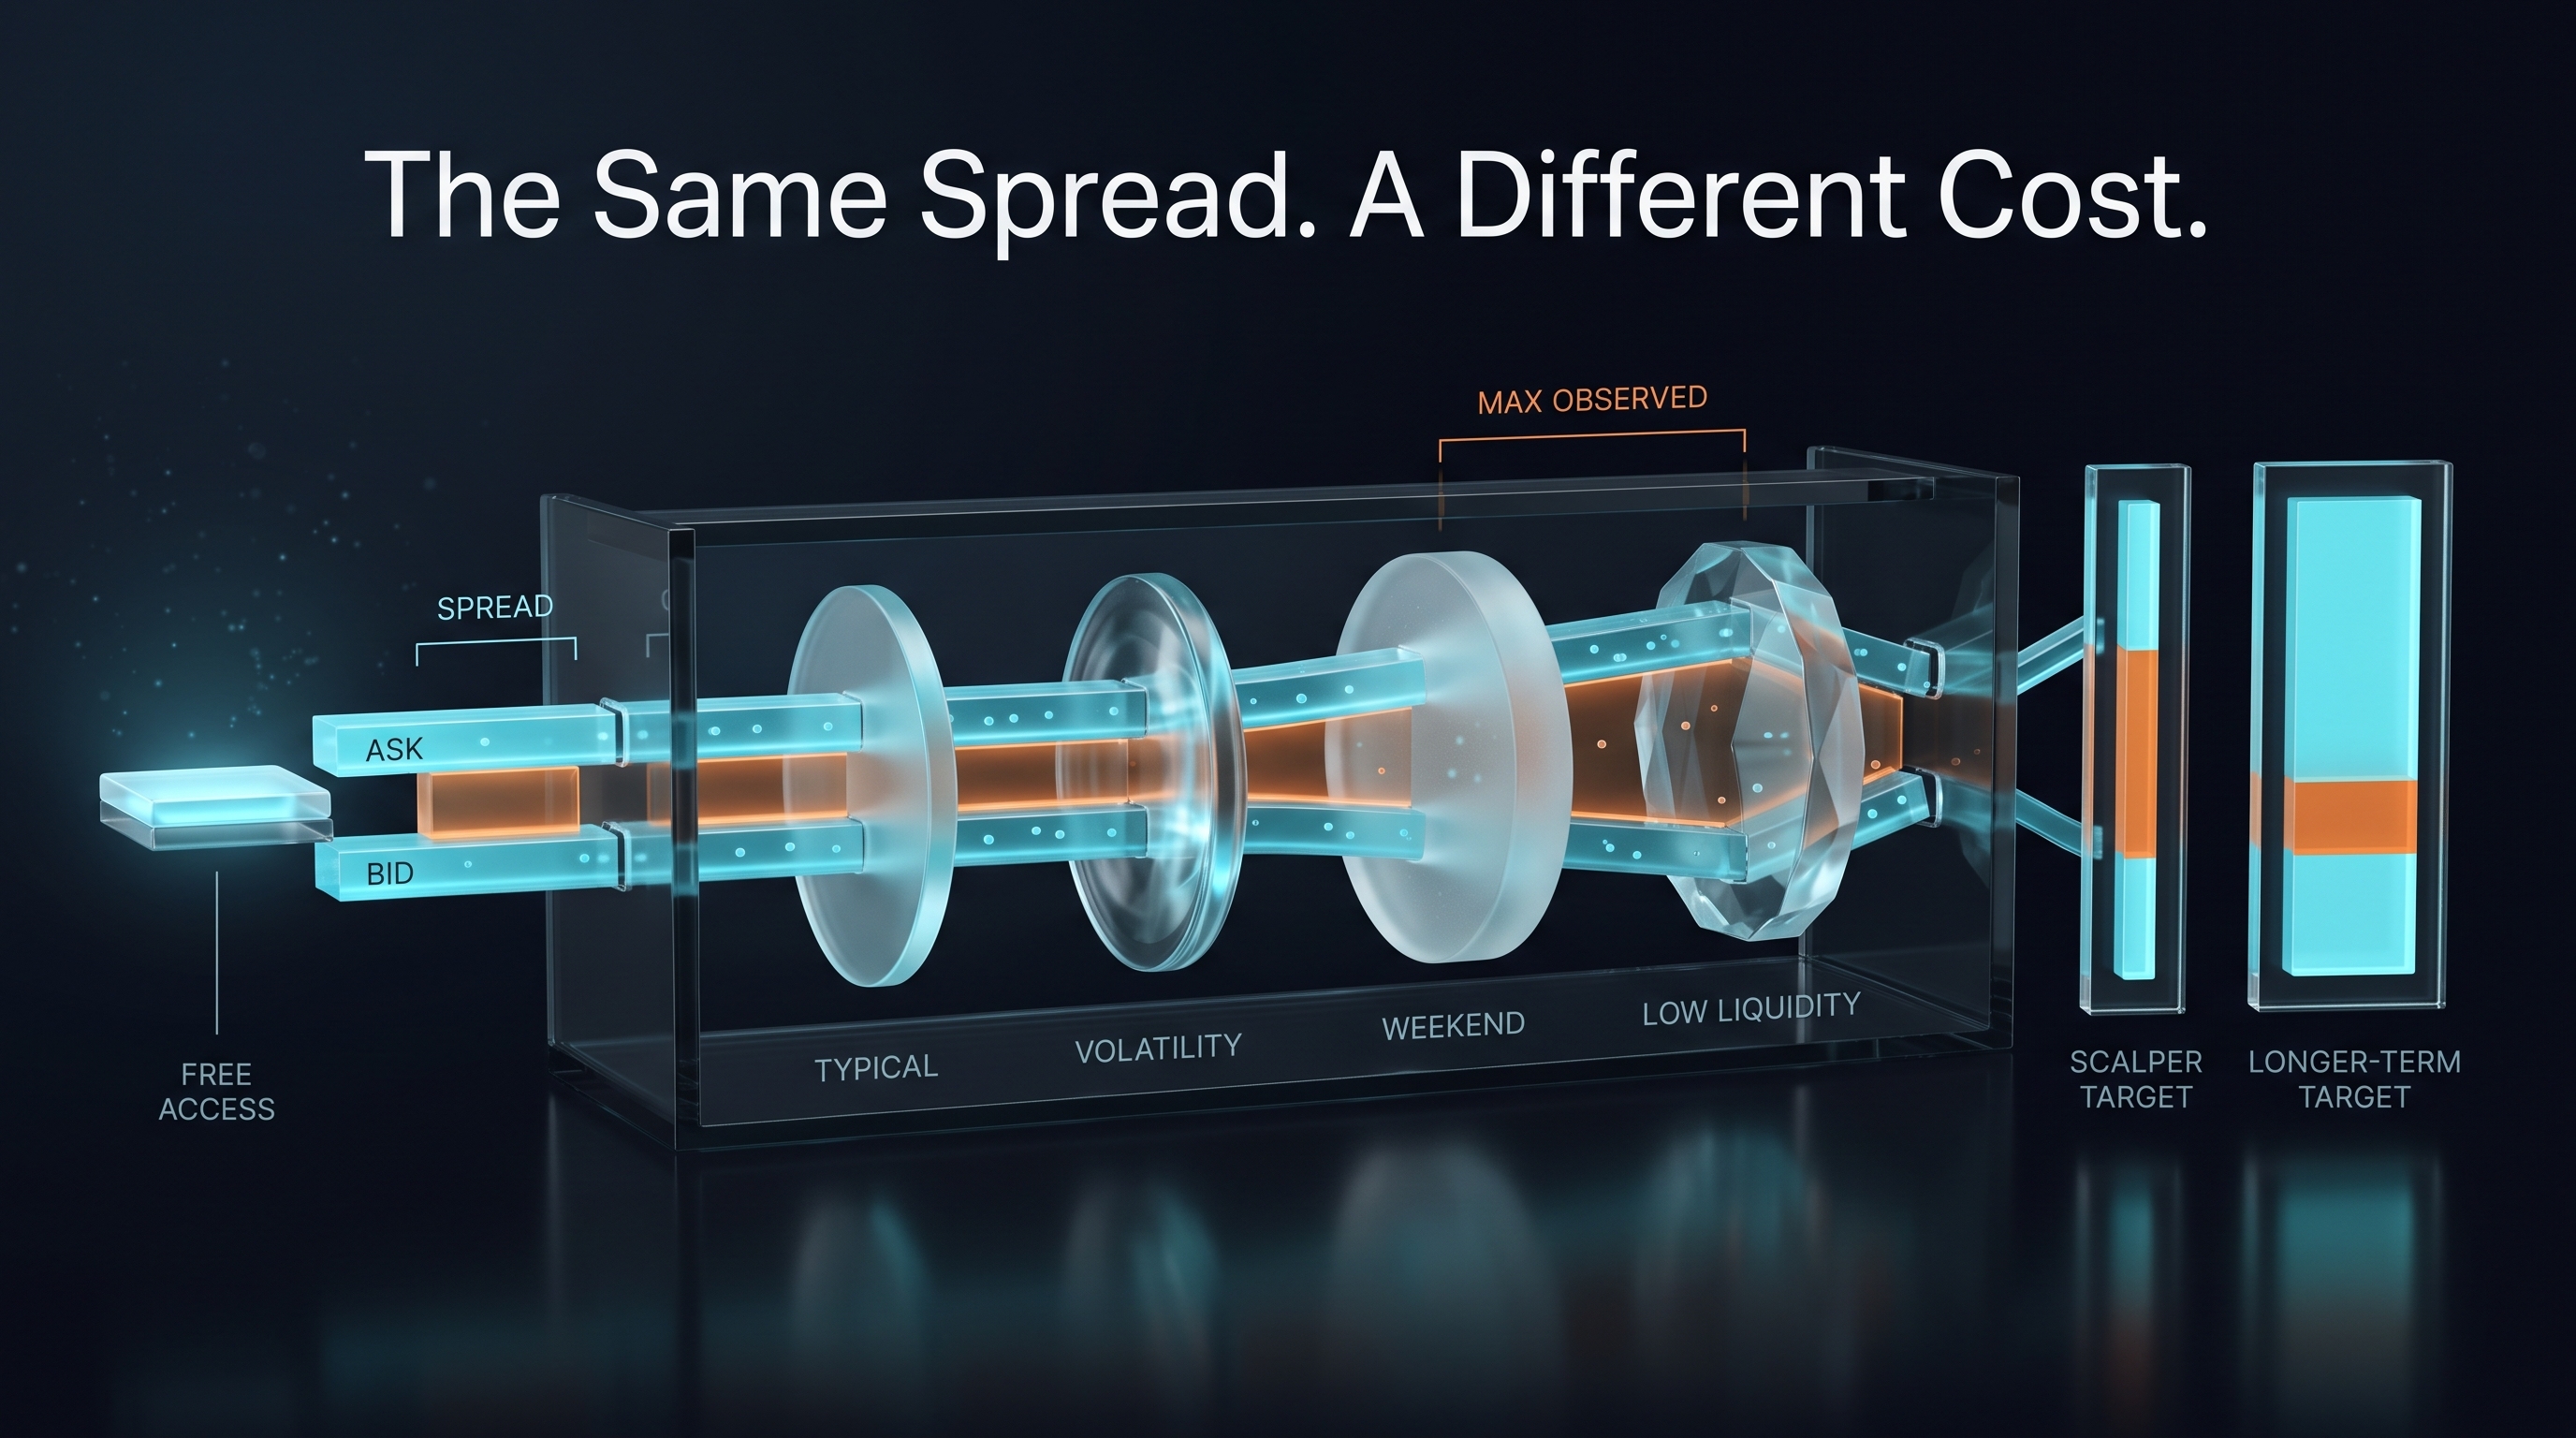
Can Wider Spreads Replace a Data Subscription?
They can. A provider may offer free platform access while charging through the bid-ask spread.
Spread is a normal trading cost, but its impact depends heavily on the strategy.
Traders should consider:
Typical spread
Maximum observed spread
Spread during volatility
Weekend spreads
Low liquidity spreads
Spread relative to the strategy’s target
A small spread may have little impact on a longer term position but can become significant for a scalper or a strategy with a narrow profit target.
Can Commissions Replace a Data Fee?
Yes. A platform may provide market data without a subscription while charging a commission on each trade.
The commission should be evaluated in relation to:
Position size
Trading frequency
Average holding time
Profit target
Stop distance
A fee that appears small on a single trade can become meaningful when a strategy enters and exits frequently.
The relevant question is not whether a commission exists. It is whether the total transaction cost remains compatible with the strategy.
Can Funding Costs Still Apply?
They may. Perpetual contracts often use funding mechanisms to help keep contract prices closer to the underlying market. Payments can move between long and short traders depending on market conditions.
A program that does not charge a traditional overnight swap may still pass through funding costs.
Traders should confirm whether the account removes:
Traditional broker style swap
Perpetual funding
Both
Neither
Free market data does not answer the funding question, just as swap free does not explain the complete execution environment.
Can Holding Fees Appear Later?
Some programs may allow positions to remain open for a defined period and then apply an administration or holding fee.
Others may impose restrictions after a certain number of days.
Before entering a position, traders should check:
Maximum free holding period
Asset specific conditions
Evaluation holding rules
Funded account holding rules
Any fees that appear after a specified period
The actual cost of a position depends on the entire period it remains open, not only on the initial entry.
Which Trading Strategies Depend Most on Reliable Market Data?
Every trading strategy depends on accurate and timely information, but the impact of data quality is not identical across strategies.
Scalping, breakout trading, order flow systems, and automated strategies can be especially sensitive to differences in timing, spread, price formation, and execution.
Swing traders may be less sensitive to a small entry price difference but can face greater exposure to holding costs and account restrictions.
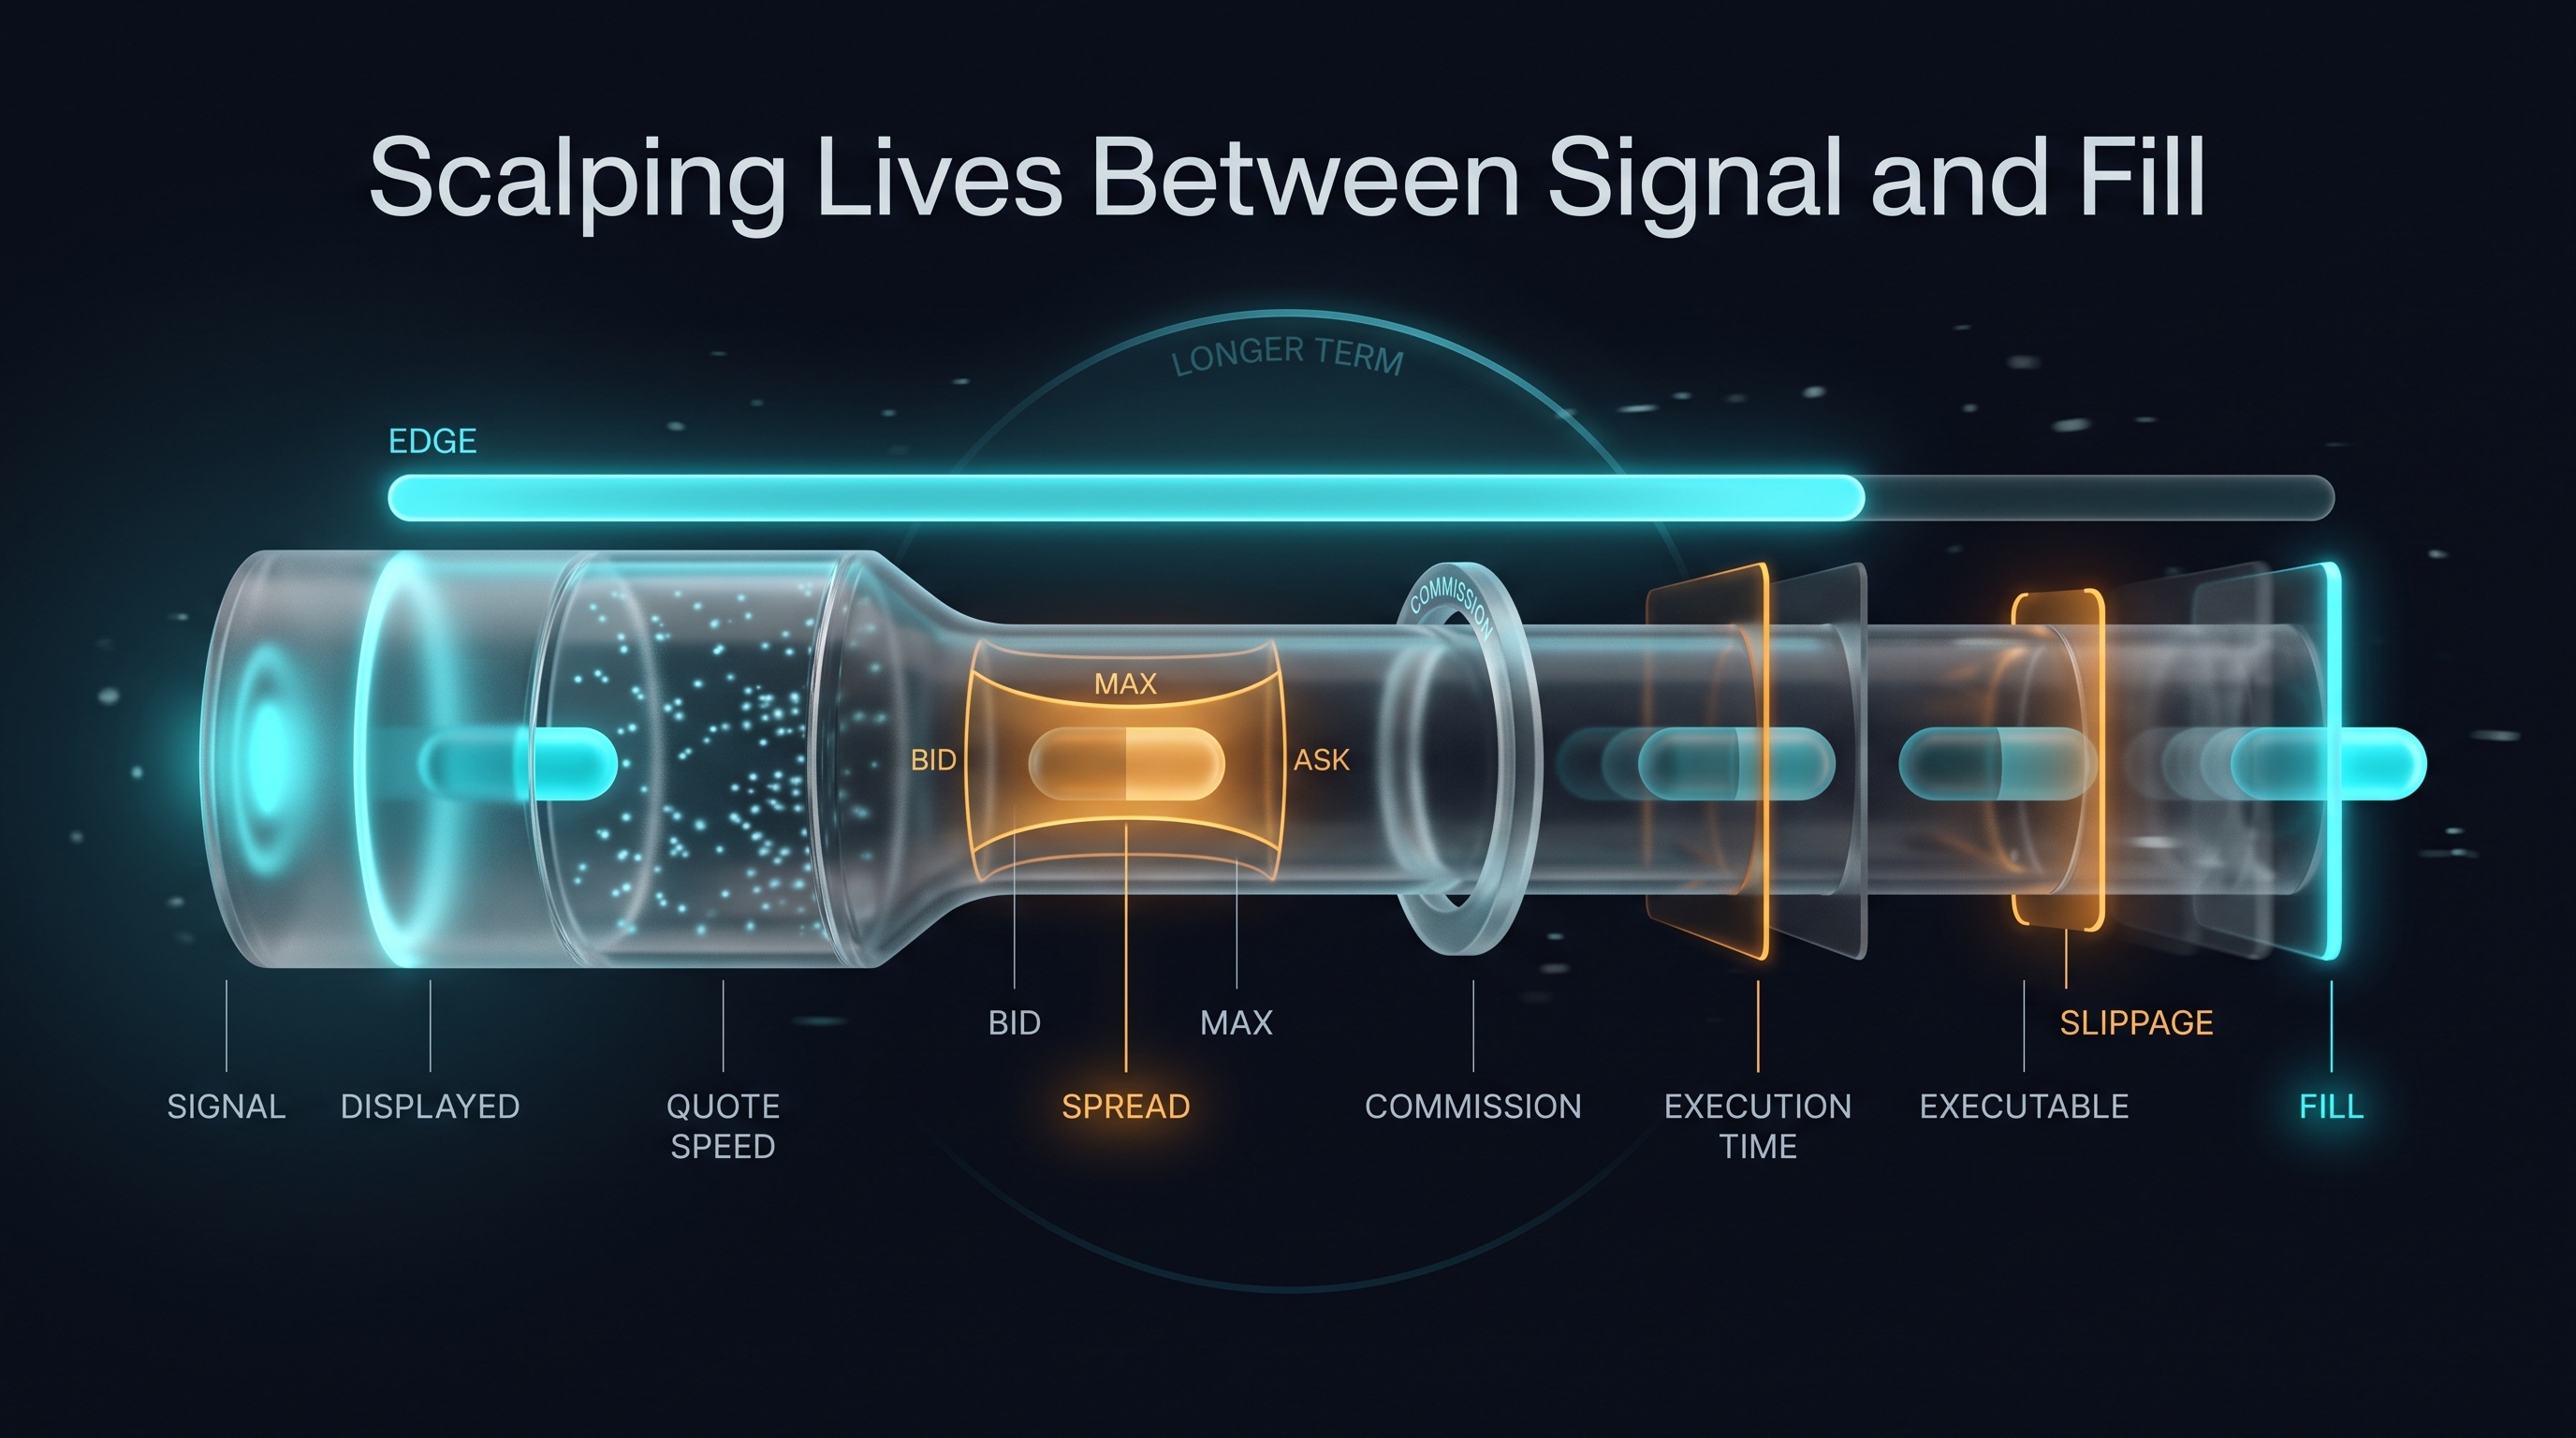
Why Does Data Matter for Scalping?
Scalping attempts to capture relatively small price movements.
Because the expected profit per trade can be limited, spread, commission, and execution delay can consume a meaningful portion of the strategy’s potential edge.
Scalpers should understand:
Quote update speed
Average spread
Maximum spread
Execution time
Frequency of slippage
Whether displayed prices are executable
A feed that appears adequate for a longer-term strategy may behave differently for a setup that depends on a few price points.
Why Does Data Matter for Breakout Trading?
Breakout strategies depend on whether price moves beyond a defined level.
A delayed or inconsistent feed can create late signals, missed entries, or differences in whether a breakout is recognized at all.
The difference may come from:
Candle highs
Candle closes
Bid/ask relationships
Data source
Update timing
Breakout traders should confirm whether the price used for analysis is consistent with the feed that triggers orders.
They should also observe platform behavior during fast movements, when price can move through several levels before an order is filled.
Why Does Data Matter for Order Flow Trading?
Order flow traders generally need more than a standard candle chart.
They may analyze:
Market depth
Bid/ask imbalance
Aggressive buying and selling
Liquidity absorption
Recent transactions
If a platform does not provide the underlying depth or transaction data, traders should not assume that a standard chart provides order flow information.
Candles show the result of buying and selling, but they do not reveal every order that created the movement.
Order flow strategies are therefore highly dependent on the completeness and relevance of the available data.
Why Does Data Matter for Swing Trading?
Swing traders may be less sensitive to a small entry difference, but holding conditions can become more important.
A multi day position can be affected by:
Funding rates
Holding fees
Weekend rules
Spread changes
Floating profit and loss
Drawdown calculations
Maximum holding periods
For this type of strategy, free market data may be less important than the cost and permission to keep a position open.
Traders should evaluate the entire holding period rather than focusing only on the entry quote.
What Should Traders Check Before Choosing a Crypto Prop Firm?
Before paying for an evaluation, traders should turn the market data claim into a practical checklist.
Data Source
Confirm whether the platform uses an exchange, multiple exchanges, an aggregator, an index, a reference model, or another pricing method.
Real Time Behavior
Check whether prices update consistently and whether the platform reacts appropriately during fast market movements.
Bid and Ask
Determine whether both sides of the quote are visible and how spreads behave under different market conditions.
Execution Model
Understand how orders are filled and which price is used for entries, exits, stop losses, and account calculations.
Historical Data
Check whether historical data is sufficiently complete and whether it is consistent with the live environment used for trading.
Costs
Review spreads, commissions, funding, holding fees, and other transaction related costs.
Evaluation vs. Funded Conditions
Confirm whether the data, symbols, execution conditions, holding rules, and account limits remain consistent after passing the evaluation.
Rulebook
Read the complete terms rather than relying only on the product page or promotional description.
Support Responses
Ask direct questions when information is unclear, and compare support answers with the official written rules.
The objective is not to find a platform with zero differences. Latency, liquidity changes, spread variation, and execution risk are part of real trading environments.
The objective is to understand those conditions well enough to determine whether they are compatible with the strategy being tested.
Final Takeaway: Free Data Is a Starting Point, Not a Guarantee
Free market data can remove one type of access cost, but it does not automatically guarantee real time pricing, exchange linked data, narrow spreads, or consistent execution.
The most useful approach is to separate several concepts that are often grouped together under the word data.
Free access tells you whether you pay a separate data fee.
Real time data concerns how quickly information reflects market activity.
Data source explains where the prices originate and how they are generated.
Execution quality determines how orders, stops, and account calculations interact with those prices.
Trading costs include factors such as spreads, commissions, funding, slippage, and holding fees.
Before choosing a crypto prop firm, traders should compare the feed during both calm and volatile conditions, understand the pricing model, review bid and ask behavior, examine execution records, and read the full rulebook.
The free market data label should therefore be treated as a starting point for verification rather than a guarantee of trading quality.
The key question is not simply whether the data costs nothing. It is whether the market information, execution conditions, and total trading environment are transparent and compatible with the strategy being tested.
Disclaimer: Educational content only. This article is not financial advice. Crypto and leveraged trading involve substantial risk. Prop firm rules, fees, data sources, and execution conditions vary between providers and may change over time. Examples are illustrative and should not be treated as guarantees, projections, or offers.
About the Creator
Sophie
Trader focused on Price Action & Order Flow.
Into crypto, fast execution, controlled risk, and quality setups.
Passing funded accounts and refining my trading every day.
Enjoyed the story? Support the Creator.
Subscribe for free to receive all their stories in your feed.
Comments
There are no comments for this story
Be the first to respond and start the conversation.