
What No One Tells You About Becoming a Quant
Before you write a single strategy, you learn to stare at a log file. And you don't stop until it stares back, clean.
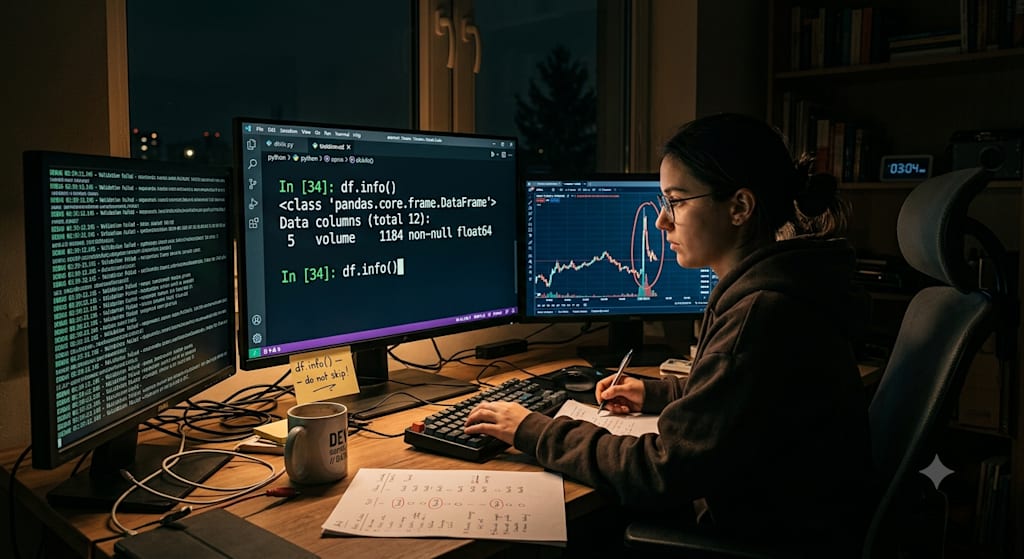
The first lesson for a beginner is never about strategy.
It’s the window on Jukuan where he just downloaded daily frequency data. The cursor blinks at the end of the first line of code. He originally meant to write a 5‑day moving average, but after typing df.info(), what catches his eye first is a few glaring missing values in the non-null count column.
His mouse hovers over that number. Double‑click. Select. Right‑click to search—no error, no red squiggly line. Just a count that is several hundred records short compared to the other cells.
In that instant he realises: he is still separated from “strategy” by a single table, and that table is not the Holy Grail. It is a detailed ledger that needs to be checked row by row.
Most people stop right there. Not because the code is hard, but because before that window popped up, they imagined their first line of code would be a buy signal, a take‑profit/stop‑loss rule, or a factor regression—not the number returned by df.isnull().sum(), with its cursor blinking like a question mark beside it.
So “you don’t need to write code” becomes a comforting myth. Those who say it interpret “code” as strategy research, and “don’t write” as “never touch the keyboard.” But the real scene at a private fund’s operations desk looks like this: there is not just one screen in front of you, but two, maybe three, and one of them is perpetually fixed on the log output window, the scrollbar racing upward at a speed your eyes can just follow. Python and SQL are indeed not on the strategy‑development side. They are compressed into a fixed set of motions: pd.pivot_table for P&L attribution, df[df['status'] != 'normal'] to filter anomalous orders, and try: wrapped around every broker‑API call. Not to invent new logic, but to make sure that before an error pops up, the red text stays in the log file, not in the trade records.
The real path to entry is not “learn how to write strategies.” It is to slice the next three months into extremely concrete actions, each of which must come with a live picture of what is on the screen.
Month one: start with df.
He does not look at moving averages, does not look at candlestick patterns, does not even look at the prices themselves. Every single day he does only one thing: load a stock’s daily data into a DataFrame, then run the same three checks: whether the column names are right, where the nulls are, and whether the descriptive statistics show any extreme values that do not make sense.
In the first week, while checking the volume column, he spots an outlier: one day’s turnover has two extra zeros compared to the days before and after. His first thought is “maybe a rights issue or ex‑dividend adjustment,” but after checking the announcements he finds nothing on that day. He pulls that row out, copies it into another sheet, and adds a handwritten note beside it: “Suspected data source error, marked.” No functions used, just manual copy, manual paste, manual typing.
In the second week, he starts to feel that this is not random. He runs the same check over thirty consecutive days and finds similar anomalies in four different stocks, spread across three separate dates. He tries to write a small filtering script—not for analysis, but for archiving: print out the row numbers, dates, and field names where extreme values occur, and save them in a folder named “Anomaly_Records.”
In the third week, at one in the morning, he finds a stock whose opening price differs from the previous day’s close by more than ten percentage points, yet there was no trading halt, no ex‑dividend adjustment, no major news that day. He cross‑checks the data source three times, confirming it is not his own code. Then he does something: he takes a screenshot of that record, circles the two numbers in red, writes “Suggest verifying upstream data caliber,” and posts it in the department group chat—the first time he has ever spoken there since joining.
By the end of the fourth week, he no longer needs to look at the output of df.info() to judge data quality. His eyes, sweeping over the non‑null count column, can tell by instinct which rows have too few numbers, too many, or numbers that look implausible. That is not talent. It is the result of repeating the same action for twenty days until his visual system has begun running the judgement before his brain even catches up.
Month two: start with “gaps.”
He no longer looks only at the basic fields. He writes a loop that iterates through the closing prices of adjacent days and flags any gap of more than 5%. In the strategy‑development world, this is called an “event‑driven factor.” But here, for him, it is called a “verification record.”
The first time he runs it, seven stocks are flagged. He opens the intraday chart of one of them and confirms that the day he flagged did indeed gap up at the open. But what draws his attention more is another row that was not flagged: one day the closing price rose only 4.8% from the previous day, technically missing the threshold. When he goes back to look at that day’s price action, he sees that the gap actually formed at the open, then faded during the session and finally settled at 4.8%.
He wrestles with it for ten minutes, then adds a comment next to the detection loop: “Threshold 5%, but sentiment gaps may appear above 4.5%. Recommend secondary manual review.”
He takes screenshots of the printed row‑number lists, names each file by stock code and date, and saves them into a folder called “Verification_Records_2026.” That folder contains no models, no factors, no strategic logic. Only rows and rows of numbers that have been manually confirmed, along with the date he scribbled next to that comment.
By the middle of the second month, he begins to notice a pattern: a considerable number of the dates he flagged cluster on the same day. He looks up the news for that day and finds it was the day after a monetary‑policy adjustment. He does not write this up in a report, nor does he tell anyone. He does only one thing: he adds an extra “Remarks” column to the output fields of that detection script, left for his future self, not for others.
Month three: start with “submitting.”
He deletes the words “passionate about quantitative trading” from his résumé. In their place, he puts a screenshot: beside the script that detects price gaps, he has written a hand‑scrawled annotation: “At 2 a.m., this script saved me three manual checks.”
He does not write “Proficient in data analysis with Python.” Instead, he writes: “Familiar with basic data‑cleaning logic in pd.DataFrame, able to identify missing values and extreme outliers in daily data, with 30 consecutive days of live‑data verification experience.”
During the interview, when HR asks him “What is your understanding of quantitative strategies?”, he does not mention factors, backtesting, or Sharpe ratios. He says: “I spent thirty days verifying data and found that the same data source had extreme value shifts twice within the same time window. Both occurred after 3 p.m. on Tuesdays. I do not know if that affects any strategy, but I do know that if you were running a live portfolio that day, you would want someone to tell you about it before the market opens.”
In the end, he gets an offer for an operations assistant role. During his first three days on the job, his daily work consists of sitting in front of the same screen, staring at the log‑output window, waiting for the confirmation line that says “Connected to broker interface.” No strategy logic, no performance curves. Just red and green text alternating: red for errors, green for success.
On the third night, at 2 a.m., he encounters his first emergency: an interface returns a timeout error. The error message is unlike anything he saw during his thirty days of data verification. He does not panic. He does not restart immediately. He does not call the on‑duty colleague right away. First, he copies the error message, pastes it into a local text file, notes the timestamp, and only then does he press the restart button.
The name of that text file is “Error_Log_2026‑07‑18.” Its first line is the original error text. Its second line is a sentence he writes: “First encounter, cause unknown. Restarted. Awaiting observation.”
The road that leads to strategy research does not open all at once on some particular day.
It opens on his thirtieth consecutive night shift, after he has finished reconciling the last penny of the day’s subscriptions and redemptions, closed his laptop, and seen that one line of print still sitting on the screen:
print('Data integrity check passed.')
The door to strategy development does not open at that moment.
But for the first time, he knows exactly which keyhole that key fits into, because he has already watched, every morning at dawn, how that key is turned.
Not with strategic logic, but with that line that says Data integrity check passed, and behind it, thirty error‑free nights.
The next morning, he opens the email from the broker with the previous day’s trade records, scrolls to the bottom, and confirms that no single order was cancelled due to data anomalies. He closes the browser. He does not take a screenshot, does not forward it, does not announce in the group chat that “I made it.”
He simply leaves that print statement in his code, and does not delete it.
Two months later, a colleague from the strategy team passes by his desk and notices a sticky note on the corner of his screen, with three handwritten lines:
df.info() – do not skip
Copy errors first, then restart
Finish before 3 a.m., never leave it until after 3
The colleague asks: “Is that your motto?”
He replies: “No. That’s my notes from the first month.”
The colleague laughs and walks away.
What he does not say is that underneath that sticky note lies another piece of paper, on which is printed the daily data of the very first stock he downloaded, the four row numbers where he found the missing values in the first week, circled in red pen, with a small line beside them:
“These four rows, I checked them six times.”
About the Creator
Jin
Writer of reamstories
https://reamstories.com/jin
Enjoyed the story? Support the Creator.
Subscribe for free to receive all their stories in your feed. You could also become a paid subscriber, letting them know you appreciate their work.
Comments
There are no comments for this story
Be the first to respond and start the conversation.