
The Crash Of The Stock Market And when It Might Happen Again
Can the Stock Market Crash Again?


The 1929 stock market crash was a drop in stock values that started on October 24, 1929. By Oct. 29, 1929, the Dow Jones Industrial Average had fallen 24.8 percent, one of the worst drops in US history. It shattered trust in Wall Street stocks, precipitating the Great Depression.
What Happened
To understand what happens we need to go back to the day it started black Thursday, Oct. 24, 1929. The Dow JIA opened at 305.85. It suddenly dropped 11%, indicating a stock market correction. The trading value was three times higher than normal. Wall Street bankers rushed to buy shares to keep things afloat. The plan was successful for some time.
On Friday, October 25, the upward trend continued. The Dow Jones Industrial Average gained 0.6 percent to 301.22. On October 28, the Dow fell 13.47 percent to 260.64. The Dow dropped 11.7 percent to 230.07.2 on Black Tuesday, October 29. Panicked investors sold about 16,410,030 shares.
What Are The Causes
Earlier in the week of the crisis in the stock market, newspapers in the New York Times fueled speculation with stories about margin sellers, short-selling, and the exodus of foreign investors.
According to S&P Dow Jones Indices, the Dow was still down 30% from its September 3 peak. This marked the beginning of a bear market. Investors became concerned about large losses in the British stock exchange in late September. Clarence Hatry's company's investors lost billions after it was revealed that he used fake collateral to purchase United Steel. A few days later, Philip Snowden, the Chancellor of the Exchequer of the United Kingdom, characterized the American stock market as "a perfect orgy of speculation."
The next day, newspapers in the United States agreed. They quoted U.S. Treasury Secretary Andrew Mellon who said investors "acted as if the price of securities would infinitely advance."
As a result, the Dow fell dramatically on both of those days, as well as on October 16. The Washington Post announced a decline in ultra-safe utility stocks on the 19th and 20th.
The Washington Post headlines screamed "Huge Selling Wave Creates Near-Panic as Stocks Collapse," while The New York Times screamed "Prices of Stocks Crash in Heavy Liquidation." The shock had set in for the worst stock market crash in history by Black Thursday.
All invested as a result of a financial invention known as "buying on margin." It allowed people to borrow money from their broker to purchase stocks. They just wanted to put down 10%. Investing in this manner led to the Roaring Twenties' excessive exuberance.
The Effects Of The Crash
People perished in the crash. They were forced to sell their companies and withdraw their life savings. When the stock market began to crash, brokers called in their loans. People were scrambling to get enough money to cover their margins. They had lost confidence in Wall Street.
You can't have a healthy economy without confidence in the market.
The Dow had fallen to 41.22 by July 8, 1932. That symbolized an 89.2 percent drop from its all-time high close of 381.17 on September 3, 1929. In terms of percentage loss, it was the worst bear market in modern US history. At that time, the highest one-day percentage increase also occurred. The Dow gained 15.34 percent, or 8.26 points, to close at 62.1 on March 15, 1933.
The Great Depression timeline follows key developments leading up to the United States' worst economic recession in history.
The Great Depression wreaked havoc on the American economy. Wages dropped by 42% when unemployment soared to 25%. Economic prosperity in the United States fell by 54.7 percent, and global trade fell by 65 percent. Between 1929 and 1933, prices plummeted by more than 10% a year as a result of deflation.
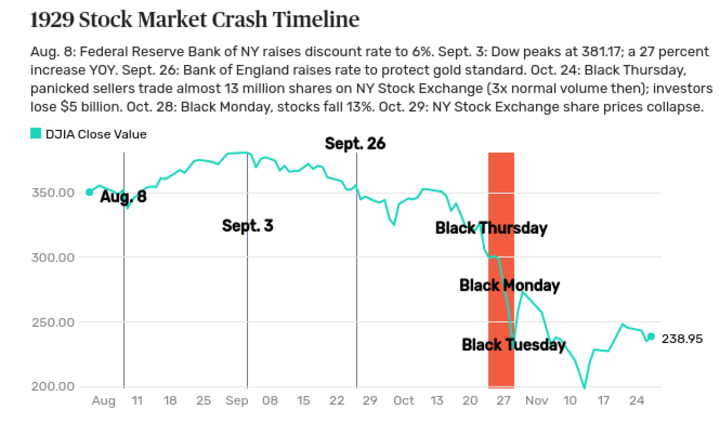
Below you can see a chart tracking key events leading up to the 1929 stock market crash:
Key Events
- March 1929: The Dow dropped, but bankers reassured investors.
- August 8: The Federal Reserve Bank of New York raised the discount rate to 6%.
- September 3: The Dow peaked at 381.17. That was a 27% increase over the prior year's peak.
- September 26: The Bank of England also raised its rate to protect the gold standard.
- September 29, 1929: The Hatry Case threw British markets into panic.
- October 3: Great Britain's Chancellor of the Exchequer Phillip Snowden called the U.S. stock market a "speculative orgy."
- October 4: The Wall Street Journal and The New York Times agreed with Snowden.
- October 24: Black Thursday.
- October 28: Black Monday.
- October 29: Black Tuesday.
- 1933: President Roosevelt launched the Federal Deposit Insurance Corporation to insure bank deposits. After the crash, banks only had enough to honor 10 cents for every dollar. That's because they had used their depositors' savings, without their knowledge, to buy stocks.
- November 23, 1954: The Dow finally regained its September 3, 1929, high, closing at 382.74.
Other stock market declines of the past resulted in the 2001 crash of the 2008 Great Recession. The March 2020 crash happened during the first quarter of the 2020 recession.
Why The 1929 Stock Market Crash Could Happen Again
It is a fact of life in the trading environment that stocks operate in cycles, with a stock market eventually resulting in a bear market decline, if not a crash. In November 2019, the existing bull market set records for the longest-running and best-performing bull market since World War II. In early 2020, there was a brief market collapse known as the Coronavirus Crash. By early April, it had been overlooked, and the bull run had continued into the midst of a global pandemic, a tumultuous election season, the second resignation of a president, and a mob takeover of the United States Capitol.
All are now waiting for the next major drop. But how can you notice it when it strikes? One method is to examine the CAPE ratio, which Yale University's Nobel Laureate economist Robert Shiller established to determine if a stock's price is rising faster than its profits can warrant. Some people use the CAPE ratio to decide if the stocks are undervalued, in which case they should rise, or overvalued, in which case they should fall.
At the end of January 2021, the CAPE ratio for the S& P 500 Index was 33.74.1. It reached a then-record high of 28 just before the 2008 market collapse.
Understanding CAPE and Stock Market Crashes
The price-to-earnings ratio, or P/E, is one of the most significant indicators of a stock's current worth. That is the stock's current price with its earnings per share. Investors consider two variations of it: one that compares the stock's price to its profits over the previous 12 months, and another that compares the stock's price to the expected earnings over the next 12 months.
The average stock has a P/E ratio of approximately 15x or 15 times its earnings. The higher the number, the more expensive the stock seems to be. The lower the total, the better the deal appears.
A variant of this figure is the cyclically-adjusted price-to-earnings ratio, or CAPE, which is also known as the Schiller P/E ratio or P/E 10. It compares the market price of a stock to its actual earnings per share calculated over the previous ten years and adjusted for inflation. This smoothes out the market's gyrations, presumably providing a more accurate picture of whether a stock is overpriced or underpriced based on its actual results over time.
The CAPE ratio can be applied to the whole market or a fair representation of the market, such as the S& P 500 Index. When the number is traced back in time, it reaches a then-record 30 just before the Great Crash of 1929, after which it falls to single digits. It peaked near 45 just before the dot-com bubble in 2000 before plummeting to 15. It was 33.82.2 at the end of 2020.
Drawbacks of CAPE
In retrospect, the CAPE ratio claims to have correctly predicted the 1929 Great Crash and the dot-com bubble. And if it does, there are no firm trading guidelines for traders to create based on the CAPE number that will tell them whether to buy or sell. It could turn out to be right again. Or maybe not.
"It's one thing to make predictions after the fact by looking at proven records, but it's quite another to do so before the data arrives," says Morningstar's vice president of research, John Rekenthaler.
Furthermore, it should be acknowledged that Shiller himself said in early December 2020 that stock prices "may not be as absurd as some people think." He cited the impact of incredibly low-interest rates on making stocks more appealing at higher prices, especially as compared to bonds.
Robert Shiller is the economist behind the CAPE ratio.
CAPE's Upward Trend
In either case, the CAPE for the S& P 500 has been more or less on an upward curve for a century, and some argue that this is justified.
This upward trend made sense, according to investment strategist Rob Arnott, the chairman, chair, and CEO of Research Associates, over a period of time when the United States advanced from being basically a developing market to the world's dominant economy. He argues that this alone could warrant a higher earnings multiple for US stocks.
While the current value of CAPE is above its long-term trend line, the discrepancy is much lower than it was in 1929, as Arnott's detailed research paper shows.
Besides that, reforms enacted in the 1930s, such as the establishment of the Securities and Exchange Commission (SEC) and the imposition of tighter financial reporting rules, are likely to have helped lift the CAPE by - trust in US markets. The standard of recorded earnings today is arguably much better than it was in 1929. As a result, the valuation of CAPE in 1929 may be understated, provided that its denominator, recorded company earnings, maybe overstated by today's standards.
Finally, there is the fact that CAPE is, after all, a look backward at 10 years of corporate earnings. These days, rightly or wrongly, investors base their choices on their expectations of profits going forward.
Playbook For Limiting Crash Damage
In the wake of the crash's darkest days, the Federal Reserve Bank of New York adopted an ambitious strategy of pumping money into the big New York banks in October 1929. This included free-market sales of government securities as well as accelerated credit to banks at a lower discount rate.
Their acts were fraught in controversy at the time. The Federal Reserve Board of Governors and the leaders of numerous other Federal Reserve Banks have alleged that New York Fed President George L. Harrison overstepped his power.
Nonetheless, according to the Federal Reserve's crisis experience, this is now the agreed playbook for mitigating the effects of stock market crashes.
Following the 1987 stock market crash, the Fed under Chair Alan Greenspan worked vigorously to raise liquidity, especially to help securities companies fund vast inventories of securities purchased by filling an explosion of sell orders from their clients.
2020 Stock Market Crash
The Dow reached an all-time high on February 12, 2020, when it closed at 29,551. The index fell 37% over the next six weeks as people panicked about the economic consequences of the COVID-19 pandemic. Though pandemics are regarded as "black swan" phenomena that occur only once in a lifetime, stock valuations were extended, and the bond market expected a recession. So, although the cause of the collapse was unknown, there were warning signals that the economy was about to crash. Following the March 23 trough, the stock recovered fully by the end of the year.
Summary
Although it is difficult to predict or monitor what the market will do, there is still the possibility of another stock market crash. To weather volatile lows, average investors can obey a few rules learned from previous stock market crashes:
- Don’t borrow to invest unless you’re a pro and have the means.
- Evaluate your own risk tolerance and set stop-loss orders for individual stocks or ETFs.
- Avoid just following the herd and getting swept up in the next big trends. Research the businesses you are investing in and buy stable companies. Look deeply into what ETFs and mutual funds hold inside them. Sometimes the name isn’t telling the whole story.
- Set goals for what the investment will be used for and time horizons to achieve that. Try to avoid panic and emotion by selling into deep losses. Try to stay invested and not get swept away by the changing tide.
Thanks to The Balance for providing all this great information.
This article is for informational purposes only. It should not be considered Financial or Legal Advice. Not all information will be accurate. Consult a financial professional before making any major financial decisions.
About the Creator
Devidson Louis
give me my money back
Keep reading
More stories from Devidson Louis and writers in Trader and other communities.
Mistakes You Making Right Now That Will Crush Your Dream Of Retiring Early
Are you planning to retire early? Or maybe you're dreaming about it, but it feels like too big a target to pursue. After all, how many people do you meet who have made it all the way to the top?
By Devidson Louis 3 years ago in Trader
THE GRAPHICS CARD WILL MEET ALL YOUR DEMANDS ON YOUR PC
In the dynamic realm of computing, few components command as much attention and admiration as the graphics card. These technological powerhouses, often referred to simply as GPUs (Graphics Processing Units), serve as the beating heart of visual processing in modern computers, enabling everything from immersive gaming experiences to complex visual simulations and professional content creation. Among the latest contenders in this arena stands the ASUS Dual GeForce RTX 4070 Super OC Edition Graphics Card, a formidable specimen boasting cutting-edge features and unrivaled performance.
By Kim Long Nguyệt Ngữ7 days ago in Trader
The Dangling Bead
My life is splashing before my eyes, as I precariously suspend and prepare for the end, the consumption of my Self and identity. I know that gravity will be the victor in this struggle. Like a pendant, slipping from the chain, the tension has caught me in this moment, bestowing one last gift of reflection. I cling desperately, questioning my purpose. Searching for comfort. And I remember…
By Leslie Staven5 days ago in Fiction


Comments
There are no comments for this story
Be the first to respond and start the conversation.