
The #1 Mistake That Wipes Out Option Sellers
It’s not direction. It’s not IV percentile. It’s the phase you’re trading in.
The single most asked question, boiled down to one sentence:
"I looked at the IV percentile – it was 81% for STAR 50. The textbook says sell when it's high. So why did I get crushed selling OTM calls this week?"
Anyone asking this has already cleared the beginner hurdle of "watching direction" and stepped into the intermediate stage of "watching volatility." But unfortunately, they've just walked straight into the biggest cognitive trap in options trading – treating IV percentile as a buy/sell signal.
High percentile = sell? Low percentile = buy?
If volatility trading were that simple, professional shops wouldn't be paying entire quant teams just to run one VRP model.
Today I'm using that "anomalous data" from August 5, 2026 as a dissection sample. By the end of this piece, you'll understand: in volatility trading, reading the level keeps you alive, but reading the phase makes you rich.
1. Post-Mortem: Why Did "Sell at High Percentile" Fail Last Week?
Let's pull out that key data from Part 1 (30-day tenor, 2-year cone percentile):
For STAR 50 ETF: ATM IV stood at 47.4%, with an IV percentile of 81%. HV30 was 72.4%, producing a VRP (IV minus HV) of –25.0%.
For ChiNext ETF: ATM IV was 38.8%, percentile 77%, HV30 54.6%, and VRP –15.8%.
Following the mechanical rule of "sell at high percentile":
STAR 50 IV at 81% → sell to open, sit back and collect premium.
What happened? HV came barrelling in at 72.4% actual realized volatility. The OTM contracts you sold got blown through their strike prices by violent, unexpected moves. Gamma exploded. Short-seller losses mounted fast.
Where did the logic break?
The textbook's "high IV percentile = short-seller advantage" rests on an extremely strict hidden condition: IV > HV, AND HV is no longer rising.
But on August 5, the data said: IV < HV, and the days before had seen a +5.7% single-day surge in ChiNext – meaning the 5-day moving average of HV was still pointing upward.
At moments like this, even a high IV percentile is a paper tiger. The market is in the early eruption phase (RV overshoot) – real volatility is a runaway horse, and the market's pricing (IV) is eating dust, unable to catch up.
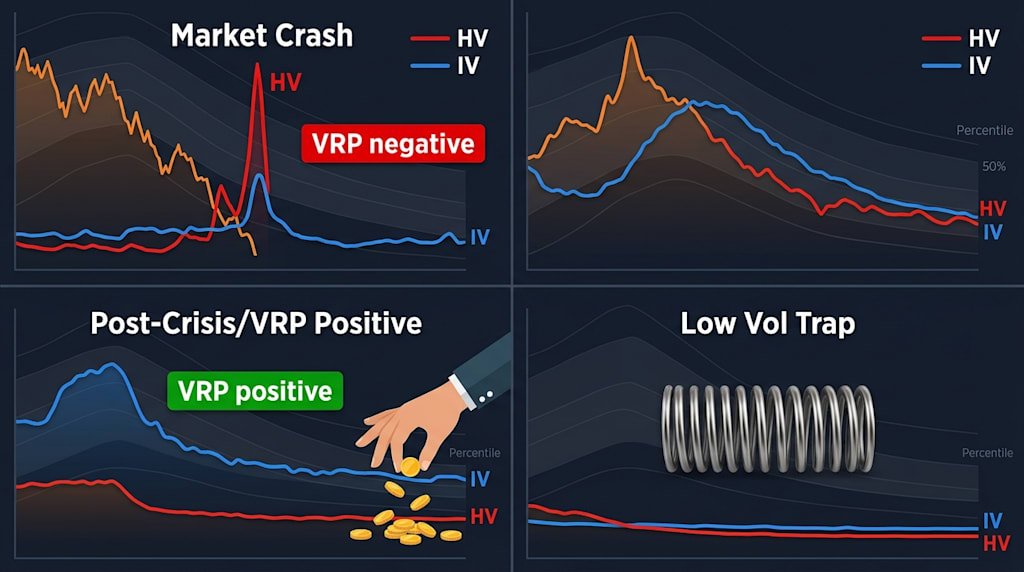
2. Four Phases: A Simple Way to Understand Volatility's "Breathing Rhythm"
After two years of real trading, I've distilled volatility dynamics into four phases. No complex charts – I'll explain it in plain language.
Phase ①: Early Eruption (RV Overshoot)
Characteristics: A black-swan event, policy surprise, or earnings shock sends the underlying into violent moves. HV spikes upward and overtakes IV. VRP flips from positive to negative, and the negative gap widens.
Market Sentiment: Panic or euphoria has just been ignited; pricing hasn't fully digested it yet.
What to do: Never go heavy on naked shorts. Buyers may have a theoretical edge (IV < HV), but direction is extremely uncertain – even a correctly called direction can get wrecked by intraday whipsaws. The optimal move is reduce size and wait, or participate with only a tiny amount of spread strategies.
Typical mistake: Seeing high IV percentile and selling heavy – exactly what got people crushed last week.
Phase ②: Catch-Up (IV Chasing)
Characteristics: Derivatives traders start hedging frantically; IV pulls upward sharply to catch HV. VRP converges from its most negative level back toward zero.
Market Sentiment: Volatility gets "confirmed" – bullish/bearish divergence peaks.
What to do: The steepest ramp of IV is the back half of the buyer's golden window. Early long-straddle players start taking partial profits. Sellers should stay cautious – IV may still overshoot to the upside.
Phase ③: Harvest (Premium Reversion)
Characteristics: HV tops out, flattens, and begins to roll over. IV, due to market inertia, remains elevated. VRP flips from negative to positive and the positive gap expands.
Market Sentiment: The actual storm has passed, but memory lingers – the market is willing to pay for "aftershock" insurance.
What to do: This is the true heaven for sellers. IV percentile may still be high (say, above 70%), but HV has already turned. The OTM contracts you sell now will benefit from both time decay (Theta) and volatility crush (Vega) – double whammy against buyers, sky-high win probability for sellers.
Key anchor: HV's 20-day moving average flattens out. That's your trumpet call to scale up short positions.
Phase ④: Low-Vol Trap (Spring Compression)
Characteristics: Both HV and IV sink to historically low percentiles (<20%). Markets are complacent. VRP hovers around zero in a tight range.
Market Sentiment: Nobody cares about risk. Options become dirt cheap.
What to do: Halt large-scale short-selling strategies. Selling now is picking up "sesame seeds" while risking the "whole pig." Instead, start laying out long strategies – buy cheap far-dated OTM contracts, betting on the day the spring snaps back. If you win, big gains; if you lose, it's limited premium paid.
3. Real-Trade Dissection: My Worst Losing Put Write – How It Got Wrecked by the Wrong Phase
In Part 1 I gave the stats: 116 put writes, 84.5% win rate, +503k profit.
Many readers DM'd: "What did the losing 15.5% look like?"
Here's the most typical one (September 2025, CSI 500 ETF):
Entry reason (textbook wrong): IV percentile was 78% – I thought "expensive enough," sold an OTM put 2 strikes away, collected juicy premium.
Day 3 after entry: A sudden social-financing data miss tanked the underlying –2.8% in one session. HV jumped from 22% to 38%, VRP punched through to negative. My put went from OTM to ITM – Delta risk and IV spike (Vega loss) hit simultaneously. Floating loss exploded.
Final result: Stopped out near HV's peak. That single loss ate 6% of total YTD profit.
That trade taught me more than the 84.5% win rate ever did.
Later, I checked the term structure on the entry day: front-month IV was a full 5 Vols higher than back-month IV – a classic "front-month premium" (near-term backwardation), a signature signal of the transition from Phase ① to Phase ②. At the time, I was staring only at the absolute percentile, completely ignoring "whether the front-month IV was distorted by a short-term event."
From then on, two hard rules went on my trading checklist:
Must calculate VRP before selling to open. If VRP is negative, no matter how high the IV percentile, cut position size by half.
Check HV's 5-day moving average direction every day at close. If the average is still rising, hedge Delta at next open – never grit your teeth and hold.
4. Volatility Cone: 2-Year or 3-Year? Don't Let "Distorted Percentiles" Fool You
"2024 had a full year of low volatility. If I use a 3-year cone, doesn't that 'artificially' inflate the 2026 IV percentile? Is it distorted?"
The answer is: Yes, it's distorted.
Consider the effect of different lookback windows:
3-year cone (includes 2024 low vol): STAR 50 at 47.4% IV today might rank at the 85th percentile.
2-year cone (mostly 2025–2026 high vol): might rank only at the 75th percentile.
1-year cone (just the last year): might rank at only the 60th percentile.
My current approach is "three cones together," with different weights:
1-year cone: 50% weight – captures the recent volatility regime, detects current "abnormality."
2-year cone: 30% weight – smooths structural shifts, my primary reference.
3-year cone: 20% weight – observes extreme historical ranges, used only for tail-risk anchoring.
Core conclusion: When the three cones give wildly diverging percentiles (e.g., 1-year at 60%, 3-year at 85%), it means the volatility regime is systematically moving higher. The older data (3-year) will give you a false impression of "expensive," while the reality is – the volatility floor has permanently lifted.
That's exactly what we're seeing in 2026. After the sharp rebound earlier this year, the volatility regime for A-shares has shifted from "flat" to "active." If you still anchor on 2024's low-vol data, you'll always think IV is too expensive – missing out on all the big long-side opportunities, or getting schooled by HV on the short side.
5. A "Phase Recognition" Checklist for Advanced Traders
Stop staring at just the absolute IV number. Before opening any trade, spend 30 seconds running through this checklist. I printed it and stuck it on the bottom right corner of my trading screen:
□ Step 1: Check VRP Sign
If VRP > 0 (IV > HV) → Seller has safety margin → can sell normally.
If VRP < 0 (IV < HV) → Seller has no safety margin → naked selling prohibited – stand aside or hedge.
□ Step 2: Check HV Slope (HV5 vs HV20)
If HV5 > HV20 and diverging upward → Phase ①/② – buyer's window, sellers stay out.
If HV5 < HV20 and converging downward → Phase ③ – seller's golden window, scale up.
If HV5 ≈ HV20 and flat at low levels → Phase ④ – light long positioning, set up for the big move.
□ Step 3: Check Term Structure (front-month IV – back-month IV)
Spread > +3 Vols (front premium) → short-term panic/euphoria overdone – sellers wait for HV to turn.
Spread < –2 Vols (back premium) → market expects higher long-term vol – sell front, buy back to trade the vol spread.
□ Step 4: Three-Cone Divergence Check (1Y vs 2Y vs 3Y percentile spread)
If max spread > 20% → volatility regime shifting – give highest weight to the 1-year cone.
6. Back to the Opening Question: Why Did Selling at 81% Percentile Lose?
Now I can give you the complete answer:
Because you did what belongs in Phase ③ (Harvest) while the market was in Phase ① (Early Eruption).
An IV percentile of 81% only tells you "the price is high." But high-priced things can always get higher. When HV is charging at you at 72%, the IV percentile is just a static snapshot – it can't tell you whether this "high" is the starting point of a bubble or the endpoint.
The real edge comes from identifying which breath of volatility you're standing on. When it's inhaling (HV rising), don't rush to exhale (heavy selling); when it's exhaling (HV falling), don't hesitate – that's the market giving you a gift.
7. Final Words: Next Up – Position Sizing
This is Part 2 of the volatility series. We've laid out the skeleton of phase recognition.
Part 3 will tear "Volatility Cone in Practice" apart completely – how to draw 1Y/2Y/3Y cones, how to read percentile bands, and how to use "rolling HV percentiles" to avoid the distortion trap we just talked about.
Part 4 will lay out my real trading ledger for position sizing and risk control – how much I put on each trade, max drawdown limits, and when to stop.
In this game, direction is the entrance, volatility is the next level, phase is the real differentiator, and position sizing is what keeps you in the game.
See you in the next one.
About the Creator
Jin
Writer of reamstories
https://reamstories.com/jin
Enjoyed the story? Support the Creator.
Subscribe for free to receive all their stories in your feed. You could also become a paid subscriber, letting them know you appreciate their work.
Comments
There are no comments for this story
Be the first to respond and start the conversation.