
SK Hynix Just Posted the Most Explosive Quarter in Semiconductor History — And the Market Obliterated $600 Billion
The AI memory king hit record revenue, record profit, and record cash. So why did its stock crash 47%? The answer is a brutal lesson in what happens when analyst models can’t keep up with HBM reality.
Start with the numbers.
For the second quarter of 2026, SK Hynix delivered this scorecard: revenue of 79.32 trillion won (about $54.3 billion), up 257% year‑over‑year and 51% quarter‑over‑quarter; operating profit of 60.54 trillion won, up 557% YoY and 61% QoQ; an operating margin of 76%; net profit of 93.92 trillion won, up 1,242% YoY.
Cumulative first‑half revenue crossed the 100 trillion won mark for the first time. A single quarter’s operating profit exceeded the company’s entire 2025 full‑year profit (47.21 trillion won). DRAM and NAND ASPs rose 30% and 50–55% sequentially, respectively. Cash and cash equivalents stood at 88 trillion won, with a net cash position of 69.4 trillion won.
This is not a “decent” earnings report. This is one of the most explosive performances in the history of the semiconductor industry.
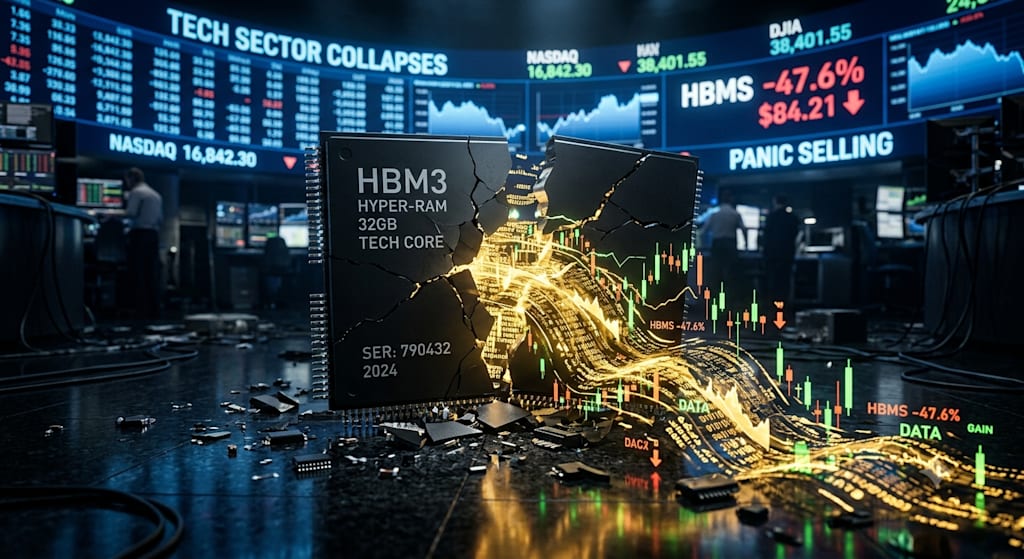
Yet the stock plunged 17% intraday after the release, and has since oscillated around 1.3 million won. It is now down roughly 47% from its peak, erasing nearly $600 billion in market capitalization.
The reason is singular: actual results missed consensus estimates.
The market expected 84 trillion won in revenue; actual was 79 trillion. Expected operating profit was 64 trillion; actual was 60.5 trillion. The shortfalls were about 5% and 5.5%, respectively.
In a market where “beating estimates” is the only passing grade, “record‑breaking but missing” is an automatic death sentence.
But if you stop at “missed estimates” and conclude “demand is collapsing,” you remain an entire HBM physical structure away from the truth.
THE SUBSTANCE: Three Structural Variables the Market Has Misjudged
Variable One: HBM Is “Distorting” the Traditional Analyst Model
The traditional semiconductor analyst model is simple: track wafer starts, capital expenditure, and bit output. In the conventional DRAM era, the number of Gb produced per wafer was relatively fixed. This framework held for two decades.
HBM fundamentally upends that equation.
HBM (High Bandwidth Memory) is a 3D stacked architecture, where multiple DRAM dies are vertically interconnected through TSV (Through‑Silicon Via) and packaged together with a logic die. To produce the same capacity (1GB) of HBM consumes several times the wafer area of conventional DRAM.
In plainer terms: from the same wafer, using it for HBM yields far fewer physical bits than using it for standard DRAM.
As SK Hynix shifts an increasing share of its capacity from conventional DRAM to HBM, two things happen.
First, capital expenditure rises (HBM requires more advanced equipment and more complex packaging lines).
Second, the near‑term “bit output per capital dollar” efficiency ratio declines.
But the analyst models have not caught up. They still apply the old formula: wafer inputs × capacity added × historical bit‑output coefficients = revenue projection.
The result is a systematic underestimation of the impact of HBM’s rising share on near‑term reported metrics, and a systematic overestimation of revenue.
This is precisely what happened in Q2. HBM’s share of SK Hynix’s product mix did not stall—it actually rose faster than the market anticipated. The DRAM business accounts for 73% of revenue, and within that, HBM4 just began mass production in the second quarter. The ramp‑up phase of a high‑end product (yield learning, pricing strategy) behaves entirely differently from mature products.
The market misread “structural upgrade lagging the reported numbers” as “demand shrinkage and peak pricing.”
One more detail: CLSA noted after the report that HBM3E average prices were flat sequentially, while shipments of the higher‑priced HBM4 to NVIDIA were deferred. This is not unsold inventory. It is the timing gap of a product transition.
Variable Two: 80% Capex Growth—But Where Is the Money Coming From, and Where Is It Going?
The second source of market fear is capital expenditure.
Full‑year 2026 capex is expected in the high end of the 40 trillion won range (approximately 48‑50 trillion won), representing roughly 80% year‑over‑year growth. The company is also accelerating the Cheongju M15X ramp and advancing the Yongin Fab 1 construction.
In investors’ muscle memory, “massive capacity expansion” in semiconductors always equals “oversupply” and “price collapse.” That memory is rooted in the 2022–2023 DRAM/NAND crash, when Samsung, Hynix, and Micron all expanded simultaneously, coinciding with a demand implosion that sent the entire industry into losses.
But this time, the context is fundamentally different.
Difference One: The expansion is not speculative hoarding—it is contractual, binding delivery.
SK Hynix currently holds long‑term supply agreements (LTAs) with roughly ten core customers, with differentiated pricing mechanisms to smooth volatility. Just last week, the company signed a bilateral supply deal with NVIDIA worth a total of $500 billion. This means the planned capacity additions correspond to already locked‑in order demand, not gambling on market speculation.
Difference Two: The expansion is centered on high‑barrier HBM, not low‑end commodities.
HBM capacity expansion faces triple constraints: equipment lead times (critical tools are booked 18–24 months out), TSV process yields (higher stacking layers mean tougher yield challenges), and advanced packaging capacity—the shortest plank in the entire supply chain.
CLSA maintained its “high‑conviction outperform” rating after the report, with the core rationale that even if SK Hynix expands capacity as currently planned, the HBM market will remain tight through 2027.
Difference Three: The source of capex funding determines whether it is “moat‑building” or “burning cash on a gamble.”
SK Hynix generated 72 trillion won in operating cash flow in Q2 alone. The company holds 88 trillion won in cash on its books, with a net cash position of 69.4 trillion won.
This means the expansion is funded internally—not through debt, not through dilutive equity issuance at low prices. A company that can sustain high‑intensity capital spending through its own cash generation and one that survives on external financing may show the same “capex growth” number, but their underlying realities are worlds apart.
The market is now applying a one‑size‑fits‑all valuation haircut, but no one is asking: where is that 80% capex increase actually going?
If the answer is “to HBM capacity,” and HBM long‑term orders are already secured through 2028, then that 80% growth is the necessary cost of reinforcing a monopoly position—not value‑destructive blind spending.
Variable Three: The Macro Death Spiral—and Its Decoupling from Micro Fundamentals
SK Hynix’s plunge is not an isolated event.
On July 17, the 10‑year U.S. Treasury yield began to accelerate sharply upward. We had previously forecast that the Fed’s hawkish turn would weigh most heavily on tech valuations, starting with semiconductors and cascading through the entire Nasdaq.
Last night, the Nasdaq formally confirmed its entry into a downtrend. As a beta play on the global semiconductor supply chain, the Korean stock market is highly sensitive to foreign capital flows. Thus the negative feedback loop formed:
U.S. semiconductor decline → foreign capital exits Korea → Hynix tumbles → dragging down U.S. semiconductor sentiment → Nasdaq remains under pressure
The semiconductor stocks on both sides of the Pacific have entered a self‑reinforcing death spiral.
Add to this the pro‑cyclical effect of algorithmic trading. When prices breach key technical support levels (such as the 200‑day moving average), quantitative funds’ sell orders are triggered unconditionally. At that point, price movements have nothing to do with the company’s current fundamentals. They are purely a technical phenomenon of liquidity shortfall and sentiment‑driven stampede.
A key piece of evidence: Micron, TSMC, and ASML all reported decent earnings, yet their stocks fell anyway. If only SK Hynix had missed expectations, that would be a company‑specific issue. But when the entire sector becomes uniformly numb to good news and hypersensitive to bad news, it is a classic hallmark of sentiment‑dominated markets.
THE ESSENCE: A 10x PE AI Monopoly—Pricing Doomsday, or Mispricing?
When panic takes hold, we return to the most basic question: what is this company worth?
Here is a simple calculation.
Q2 EPS was 132,000 won. Annualized at a very simple level (132,000 × 4), full‑year EPS would be approximately 528,000 won. At the current price of around 1.4 million won, the trailing dynamic P/E is roughly 10x.
If we use FactSet’s consensus forward 12‑month earnings estimates, the forward P/E drops to as low as 4x.
What do these numbers mean?
A monopoly oligarch—net profit up 12x year‑over‑year, sitting on 88 trillion won in cash, commanding roughly 50% of the global AI memory market—is being valued at bankruptcy‑level cyclical multiples at the very peak of its earnings power.
A 10x P/E is only rational in one scenario: the market has priced in a 2027 AI bubble burst, with Hynix’s profits set to collapse by half or more.
But the current industry reality does not support that scenario.
First, AI is transitioning from the training phase to the inference phase. Training demands concentrated compute; inference demands edge compute and high‑bandwidth memory—and the latter only increases the density of HBM demand, not reduces it.
Second, the rise of agentic AI is reshaping the memory demand structure. Multimodal agents need to call multiple models simultaneously, driving exponential growth in memory bandwidth and capacity requirements.
Third, NVIDIA’s GPU iteration cadence has not slowed. From HBM4 to HBM4E, the specification roadmap is clearly laid out, and SK Hynix’s technological leadership in this arena has not been eroded.
Fourth, the revenue visibility from long‑term LTAs extends beyond 2027. This is not a cyclical exposure where “orders could vanish next quarter.”
The biggest misjudgment is this: the market is pricing an “AI infrastructure oligarch” using the template of a “cyclical peak.”
A cyclical downturn means disappearing demand, commoditized products, and vanishing pricing power. The current reality of AI memory is exactly the opposite: demand is upgrading (from HBM3E to HBM4), product customization is deepening, and pricing power is concentrated among a handful of suppliers.
These are fundamentally different worlds.
CLOSING: Bloody Chips in the Rubble
What is the essence of this crash?
Three factors layered together: a short‑term earnings timing mismatch (distorted bit‑output translation from rising HBM share), macro liquidity tightening (Treasury yields weighing on tech multiples), and sentiment stampede (quant selling + the death spiral).
But the fundamental logic has not broken.
“Not broken” means: HBM demand still exceeds supply, LTAs still lock in medium‑term revenue, technological barriers remain unbreached, and free cash flow remains strong.
And this is precisely the greatest divergence of perception in the market. The majority sees “miss → it’s over”; a minority sees “structural upgrade lagging reported numbers → overreaction.”
When a core AI leader drops to 10x P/E, with its technological moat and long‑term contracts intact, the market’s irrationality is creating an attractive risk‑reward profile.
“Risk‑reward” does not mean “it will bounce tomorrow.” No one knows when algorithmic selling will exhaust itself, when Treasury yields will stabilize, or where the bottom of the sentiment‑driven stampede lies.
What it does mean is: from current levels, the downside asymmetry is extreme. If the fundamental thesis is correct, the current price has already over‑discounted the most pessimistic scenario. If the fundamental thesis is wrong—if AI demand is debunked—then holding any AI‑related asset is a mistake, and 10x vs. 15x makes little difference.
The crux is that premise: has AI demand been debunked?
As of now, no.
HBM4 mass production began in Q2. HBM4E is coming next year. HBM5 is on the roadmap. There are still multiple generations of AI memory specification upgrades ahead. Calling the cycle peak now is like saying in 1998 that “the internet bubble is about to pop”: the direction may eventually be correct, but the timing is entirely off.
SK Hynix’s fundamentals have not deteriorated. What has deteriorated is market sentiment.
Treasury yields will stabilize, the volume effect of HBM4 will feed into the reported “bit output” metrics, and algorithmic selling momentum will exhaust itself. When those three things happen, the market will eventually recognize that this collapse in the summer of 2026 was nothing more than violent turbulence along the long arc of the AI bull market.
Turbulence passes. But in the fiercest moments of the storm, those who keep their eyes open and see clearly whether what’s outside is a squall or an earthquake are the ones who will have the chance to pick up the bloody chips that everyone else has mistakenly thrown away.
About the Creator
Jin
Writer of reamstories
https://reamstories.com/jin
Enjoyed the story? Support the Creator.
Subscribe for free to receive all their stories in your feed. You could also become a paid subscriber, letting them know you appreciate their work.
Comments
There are no comments for this story
Be the first to respond and start the conversation.