
Trading is a dynamic and ever-changing market, and staying ahead of the curve requires traders to gather and analyze as much information as possible. One valuable tool in a trader's arsenal is a liquidation heatmap, which provides crucial insights into market sentiment and potential risks. In this comprehensive guide, we will delve into the intricacies of reading and understanding a liquidation heatmap, empowering you to make informed trading decisions.
What is a Liquidation Heatmap?
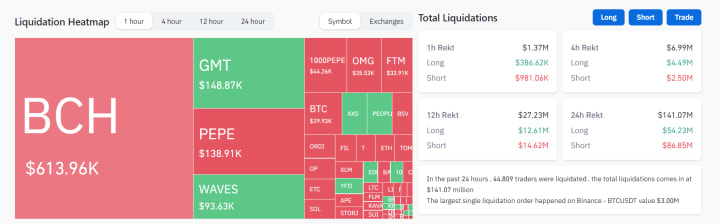
A liquidation heatmap is a graphical representation of liquidation events within the cryptocurrency market. It uses color-coded zones to indicate the intensity of liquidations, with green representing low activity and red highlighting high levels of liquidations. The heatmap provides traders with a visual overview of potential market volatility and areas of liquidation risk.
Key Elements of a Liquidation Heatmap
1. Color-Coded Zones:
Understanding the color-coded zones on a liquidation heatmap is crucial for effectively interpreting the information it presents. The color scheme used in a heatmap allows traders to quickly identify the intensity of liquidation activity in different areas of the market. Here are the key aspects to consider when examining the color-coded zones:
a) Green Zones: Green zones on a liquidation heatmap indicate relatively calm periods with low liquidation activity. These zones typically represent stable market conditions where traders are less likely to encounter significant price fluctuations or sudden market shifts. Green zones are often associated with a more confident market sentiment, indicating a sense of stability and reduced risk.
b) Red Zones: On the other hand, red zones on a liquidation heatmap signal heightened levels of liquidations and potential market stress. These areas represent periods of increased volatility and higher risks. Traders need to exercise caution and closely monitor the market when encountering red zones. They may indicate periods of uncertainty, where sudden price movements or market reversals are more likely to occur. Red zones should be approached with increased vigilance, as they may present both opportunities and challenges for traders.
2. Legend:
Accompanying the liquidation heatmap is a legend that provides valuable information about the data presented. The legend serves as a guide, explaining the various elements and terms used within the heatmap. Familiarizing yourself with the legend is essential for accurately deciphering the information it conveys. Here are some key details commonly found in the legend of a liquidation heatmap:
a) Asset: The legend specifies the asset or cryptocurrency being traded, ensuring traders are aware of the specific market they are analyzing. Different assets may exhibit unique characteristics and behaviors, so understanding the asset being tracked is crucial for making informed decisions.
b) Liquidation Price: The liquidation price represents the price level at which a position is automatically closed or liquidated. It is an important factor for assessing the impact of liquidations on the market. Traders can identify critical price levels by analyzing the liquidation prices shown in the heatmap.
c) Volume: The legend may include information about the volume of liquidations occurring in different areas of the market. Volume data provides insights into the intensity and magnitude of liquidation events. Analyzing volume patterns can help traders gauge market activity and potential liquidity levels.
Interpreting a Liquidation Heatmap
1. Identifying Market Sentiment:
By analyzing the liquidation heatmap, traders can gain insights into overall market sentiment. Green zones indicate a stable market with lower liquidation activity, suggesting a more confident market sentiment. On the other hand, red zones imply higher liquidation levels and can indicate market uncertainty or heightened risk.
2. Spotting Potential Support or Resistance Areas:
Liquidation heatmaps can help traders identify potential support or resistance areas. These are regions on the heatmap where liquidations occur frequently or cluster together. Such areas often represent price levels where traders are more likely to place their stop-loss orders, leading to increased buying or selling pressure.
3. Analyzing Market Trends:
Liquidation heatmaps offer valuable information about market trends. Observing patterns and changes in the heatmap over time can help traders identify emerging trends, spot market reversals, or anticipate potential price movements. For example, an increasing concentration of liquidations in specific regions might suggest an upcoming market shift.
Strategies for Utilizing a Liquidation Heatmap
1. Risk Management:
Liquidation heatmaps assist traders in managing risk by providing insights into areas of potential market stress. Traders can adjust their risk management strategies accordingly, such as tightening stop-loss levels in high liquidation zones or avoiding trades during periods of extreme market volatility.
2. Confirmation for Trading Decisions:
Liquidation heatmaps can serve as a supplementary tool to validate or confirm trading decisions based on other technical or fundamental analysis. If a trader identifies a potential entry or exit point on a price chart, cross-referencing it with the heatmap can provide additional confidence in the decision.
3. Market Monitoring:
Regularly monitoring the liquidation heatmap allows traders to stay updated on market conditions and spot shifts in market sentiment. By keeping a close eye on the heatmap, traders can adapt their trading strategies to changing market dynamics and capitalize on opportunities.
Conclusion:
Mastering the art of reading and understanding a liquidation heatmap is a valuable skill for cryptocurrency traders. By comprehending the color-coded zones, interpreting the legend, and analyzing market trends, traders can gain insights into market sentiment, identify potential support or resistance areas, and make informed trading decisions. Incorporating the liquidation heatmap into your trading routine will enhance your risk management
About the Creator
Europeans reject Chinese cars.
China's car industry has changed over the course of the last ten years, from delivering fundamental western clones to making vehicles that equivalent the world's ideal. As the assembling force to be reckoned with of the world, China is likewise creating them in enormous volumes.
By Phumlani Mdlalose4 days ago in Trader
Integrated marketing
Integrated Marketing Dispatches( IMC) is a strategic approach that ensures all marketing dispatches are cohesive, harmonious, and work together to support a brand's communication across colorful channels. In moment's dynamic and connected business, where consumers are bombarded with information from multiple sources, IMC has come essential for companies to effectively reach their target followership and achieve their marketing objects. At its core, IMC involves the integration of colorful communication tools, similar as advertising, public relations, direct marketing, deals creation, and digital marketing, to deliver a unified communication to consumers. By coordinating these rudiments, companies can produce a flawless brand experience that resonates with consumers and drives engagement and fidelity. One of the crucial benefits of IMC is that it allows companies to maximize the impact of their marketing sweats by using the strengths of each communication tool. For illustration, while advertising helps make brand mindfulness on a large scale, public relations can enhance credibility and trust by securing positive media content. Meanwhile, direct marketing enables substantiated communication with individual guests, while digital marketing offers precise targeting and real- time engagement openings. also, IMC enables companies to maintain thickness in their messaging across different channels, which is pivotal for erecting brand identity and recognition. harmonious branding helps consumers develop a clear understanding of what a brand stands for and fosters trust and fidelity over time. Whether a consumer encounters a brand's communication on social media, TV, or in- store, they should admit a harmonious communication that reflects the brand's values and positioning. Another advantage of IMC is its capability to produce community among colorful marketing channels, performing in a accretive effect that amplifies the overall impact of the crusade. When different communication tools are strategically integrated, they support each other, creating a more important and memorable brand experience for consumers. For illustration, a company may launch a TV announcement crusade to make mindfulness, rounded by social media elevations to encourage engagement and drive business to the website. By coordinating these sweats, the company can induce lesser brand visibility and engagement than if each channel were used singly. In addition to enhancing brand mindfulness and engagement, IMC also facilitates better dimension and evaluation of marketing effectiveness. By integrating different communication tools, companies can track the performance of each channel and assess how they contribute to overall crusade objects. This allows marketers to optimize their strategies in real- time, allocating coffers to the most effective channels and refining messaging to more reverberate with their target followership. still, enforcing IMC effectively requires careful planning, collaboration, and collaboration across different departments and stakeholders within an association. It involves aligning marketing objects, messaging, and creative means across colorful channels while icing thickness in brand positioning and identity. This frequently requires breaking down silos between departments similar as marketing, advertising, public relations, and deals to foster collaboration and integration. also, with the rapid-fire elaboration of technology and the proliferation of new communication channels, the geography of IMC is constantly evolving. Companies must stay nimble and acclimatize their strategies to influence arising trends and technologies to stay applicable and competitive. From social media and influencer marketing to immersive gests and stoked reality, there are endless openings for brands to engage with consumers in innovative ways and produce memorable brand gests . In conclusion, Integrated Marketing Dispatches is a strategic approach that integrates colorful communication tools to deliver a cohesive and harmonious brand communication across multiple channels. By coordinating sweats across advertising, public relations, direct marketing, deals creation, and digital marketing, companies can maximize the impact of their marketing sweats, enhance brand mindfulness and engagement, and drive business results. still, successful perpetration requires careful planning, collaboration, and adaption to evolving consumer trends and technologies.
By vinoth kumar6 days ago in Trader


Comments
There are no comments for this story
Be the first to respond and start the conversation.