
Profit Target to Drawdown Ratio in Crypto Prop Firms
A formula first guide to calculating PT:DD and measuring the real difficulty of crypto prop trading

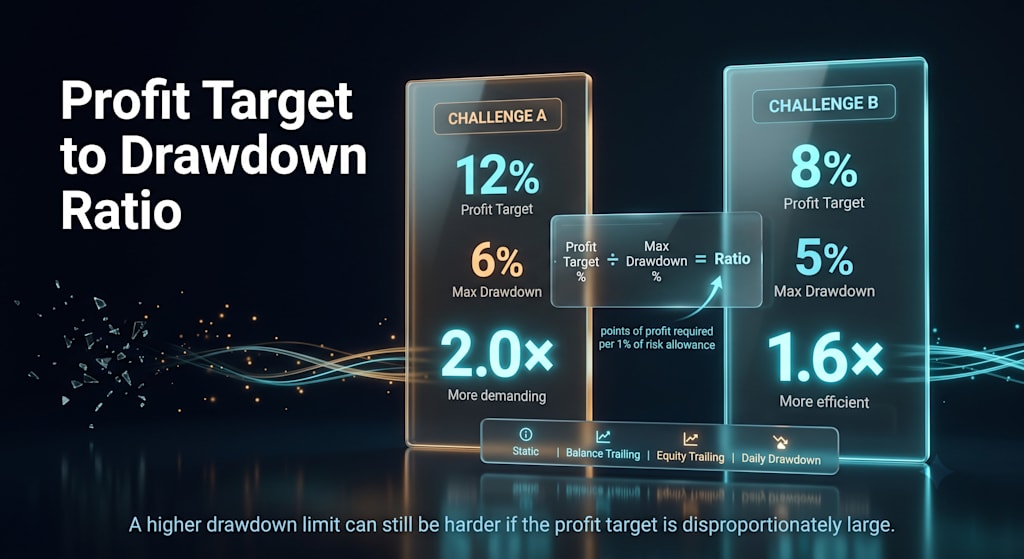
Crypto prop trading can look generous and still be mathematically demanding. A 6% maximum drawdown sounds better than a 5% limit, but not if the first challenge requires a 12% profit target while the second asks for only 8%.
The profit target to drawdown ratio places those two rules on the same scale. It shows how many percentage points of profit a trader must generate for each percentage point of total loss allowance. However, the headline ratio is only the starting point. Static, balance based trailing, equity based trailing, and daily drawdown rules can produce very different levels of usable risk.
This guide explains one consistent PT:DD formula, applies it to practical examples, and builds a neutral framework for comparing crypto prop challenges without relying on “best firm” claims or marketing language.
What is the Profit Target to Drawdown Ratio in a Crypto Prop Firm?
The profit target to drawdown ratio in a crypto prop firm compares the profit required to pass an evaluation with the maximum loss allowed. Calculate it by dividing the profit target by maximum drawdown. A 9% target and 6% drawdown equal 1.50. Under this formula, a lower ratio is generally more favorable when the other rules are identical.
PT:DD = Profit Target (%) ÷ Maximum Drawdown (%)
The ratio does not predict whether an individual trader will pass. Instead, it provides a standardized way to compare the return requirement with the account’s total loss limit.
A PT:DD of 1.00 means the profit target equals the maximum drawdown. A ratio of 1.50 means the trader must generate 1.5 percentage points of profit for every percentage point of total drawdown. A ratio of 2.00 means the required profit is twice the permitted total loss.
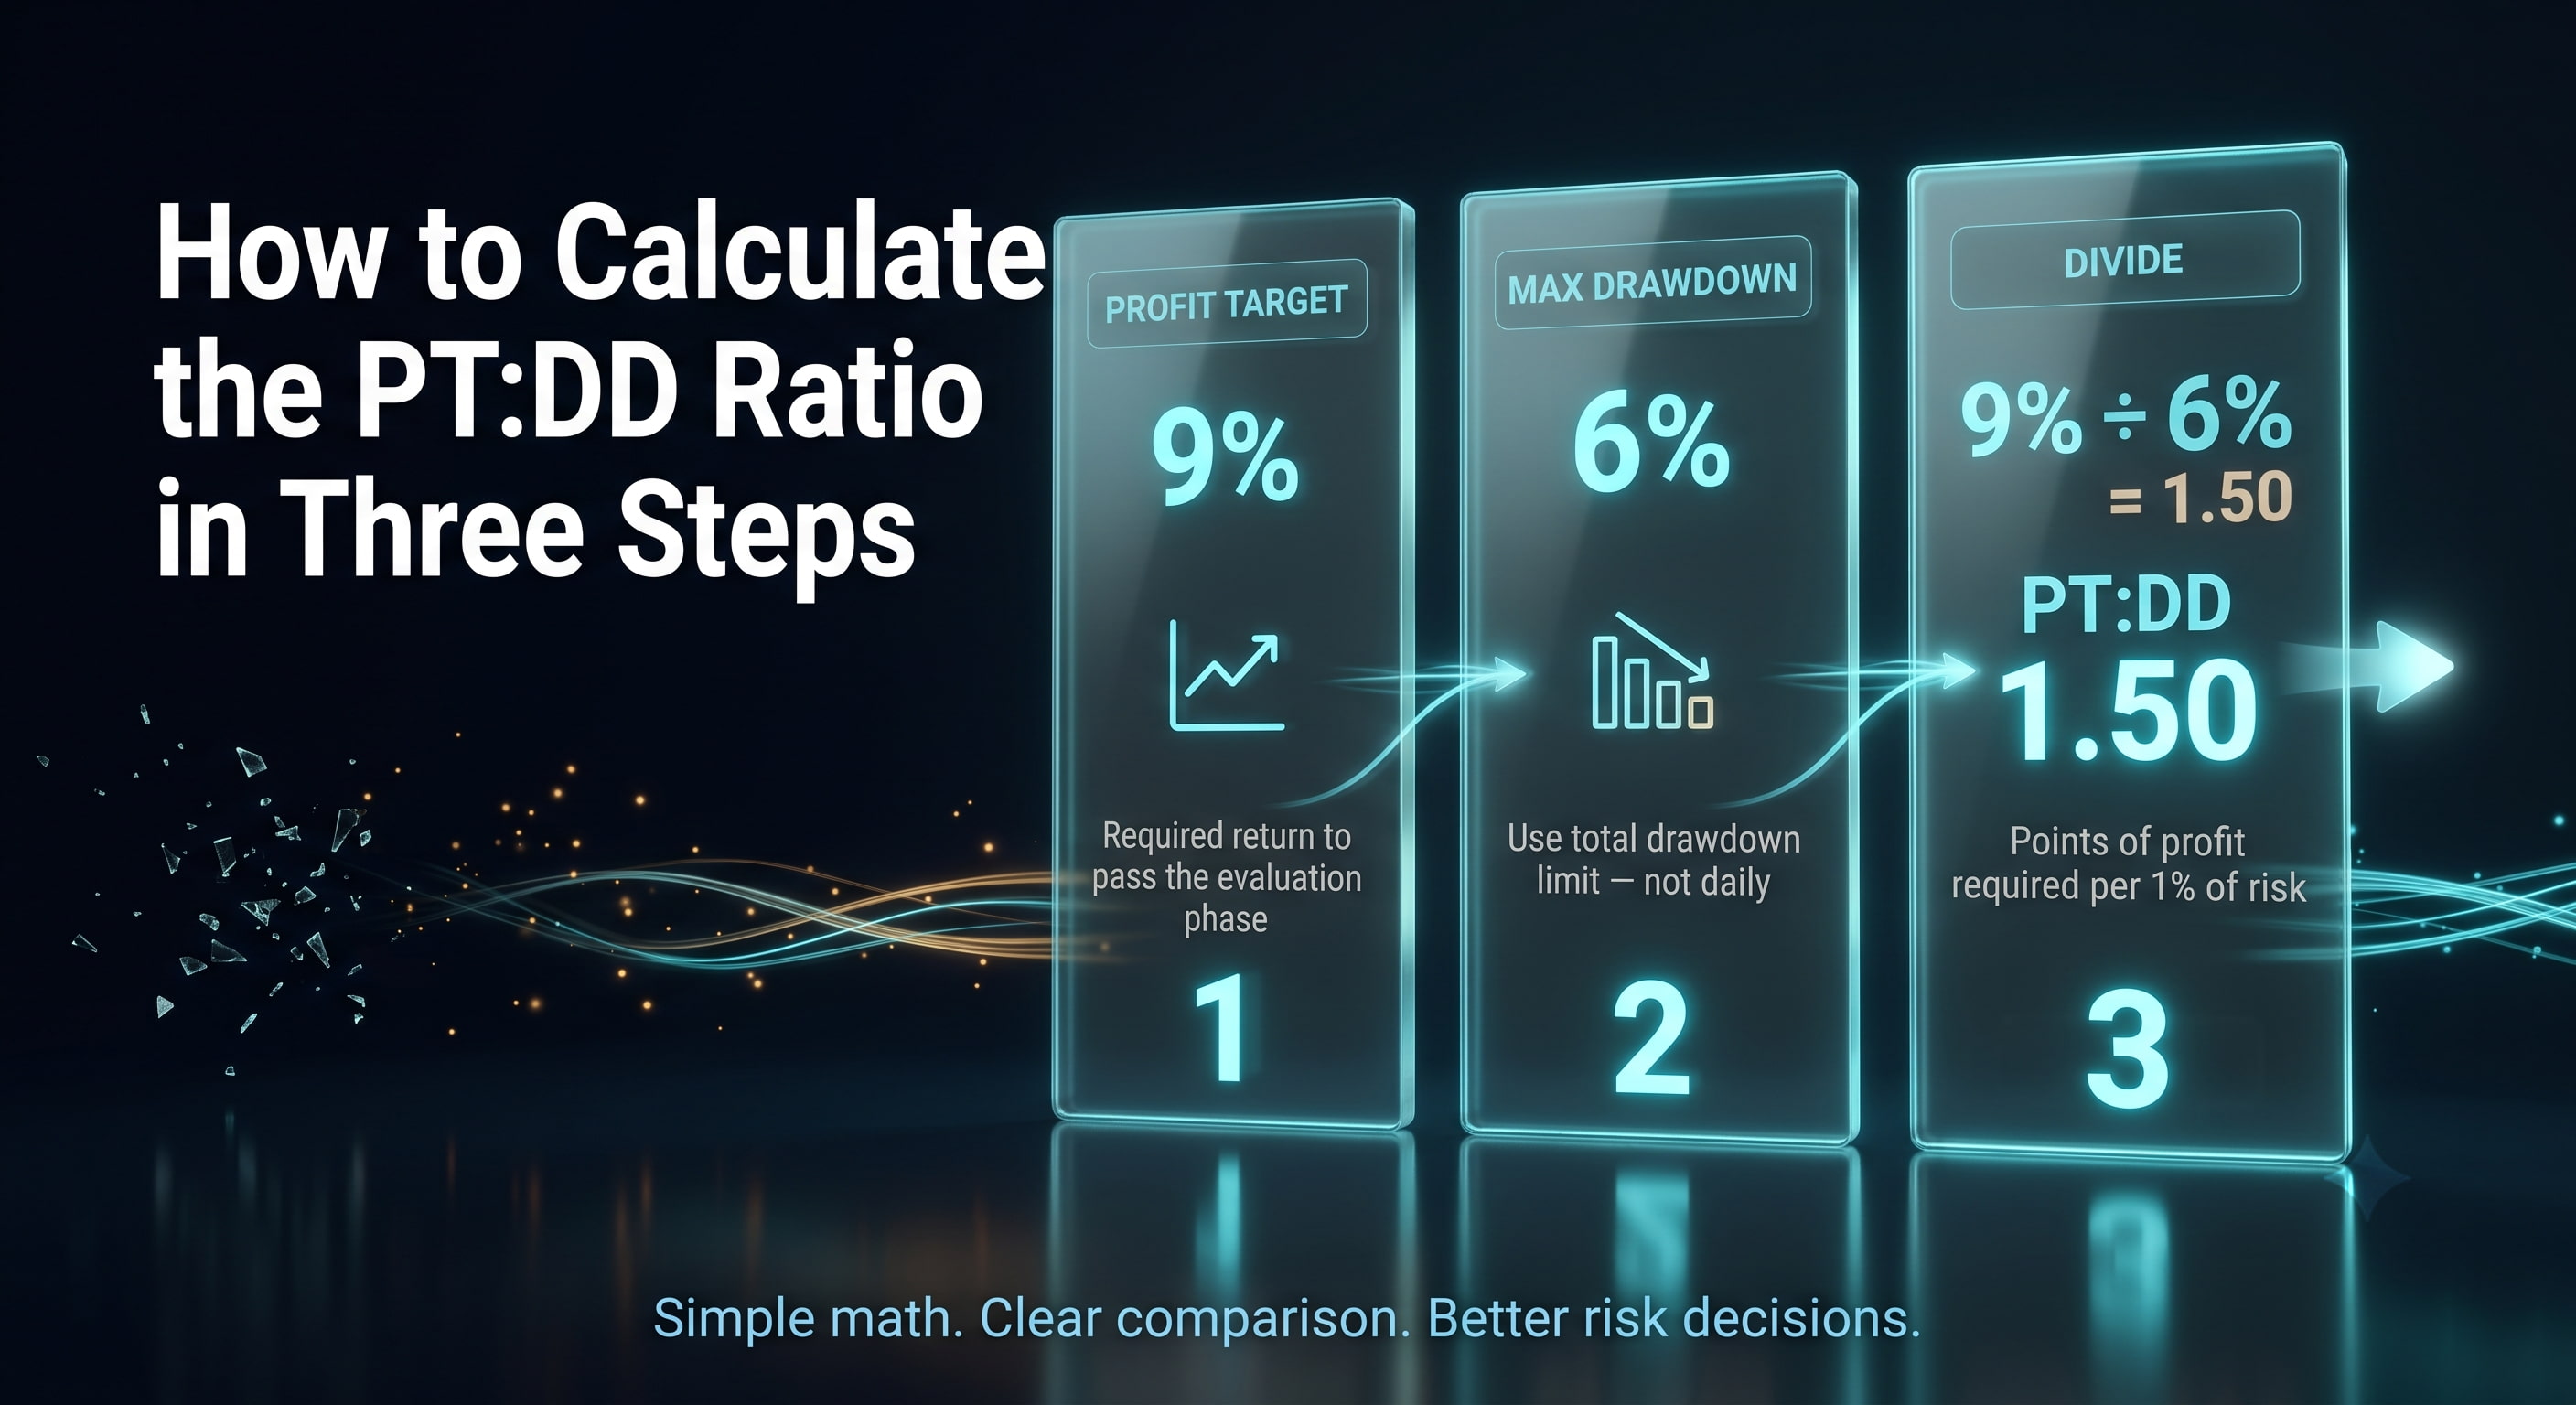
How to Calculate the PT:DD Ratio in Three Steps
Find the profit target.
Use the percentage return required to pass the relevant evaluation phase.
Find the maximum drawdown.
Use the total drawdown limit, not the daily drawdown limit.
Divide the target by the drawdown.
For example, a 9% target divided by a 6% maximum drawdown produces a PT:DD of 1.50.
These ratios are comparable only when the challenge phase, drawdown model, time limit, and other trading rules are also comparable.
Profit Target: 8%
Max Drawdown: 8%
PT:DD: 1.00
Meaning: One target point per drawdown point
Profit Target: 9%
Max Drawdown: 6%
PT:DD: 1.50
Meaning: 1.5 target points per drawdown point
Profit Target: 10%
Max Drawdown: 5%
PT:DD: 2.00
Meaning: Two target points per drawdown point
For example, a one phase challenge with a PT:DD of 1.50 should not automatically be compared with the combined targets of a two phase challenge. Each phase creates a separate path dependent objective, so the ratio should normally be calculated for each phase individually.
Is a Lower or Higher PT:DD Ratio Better?
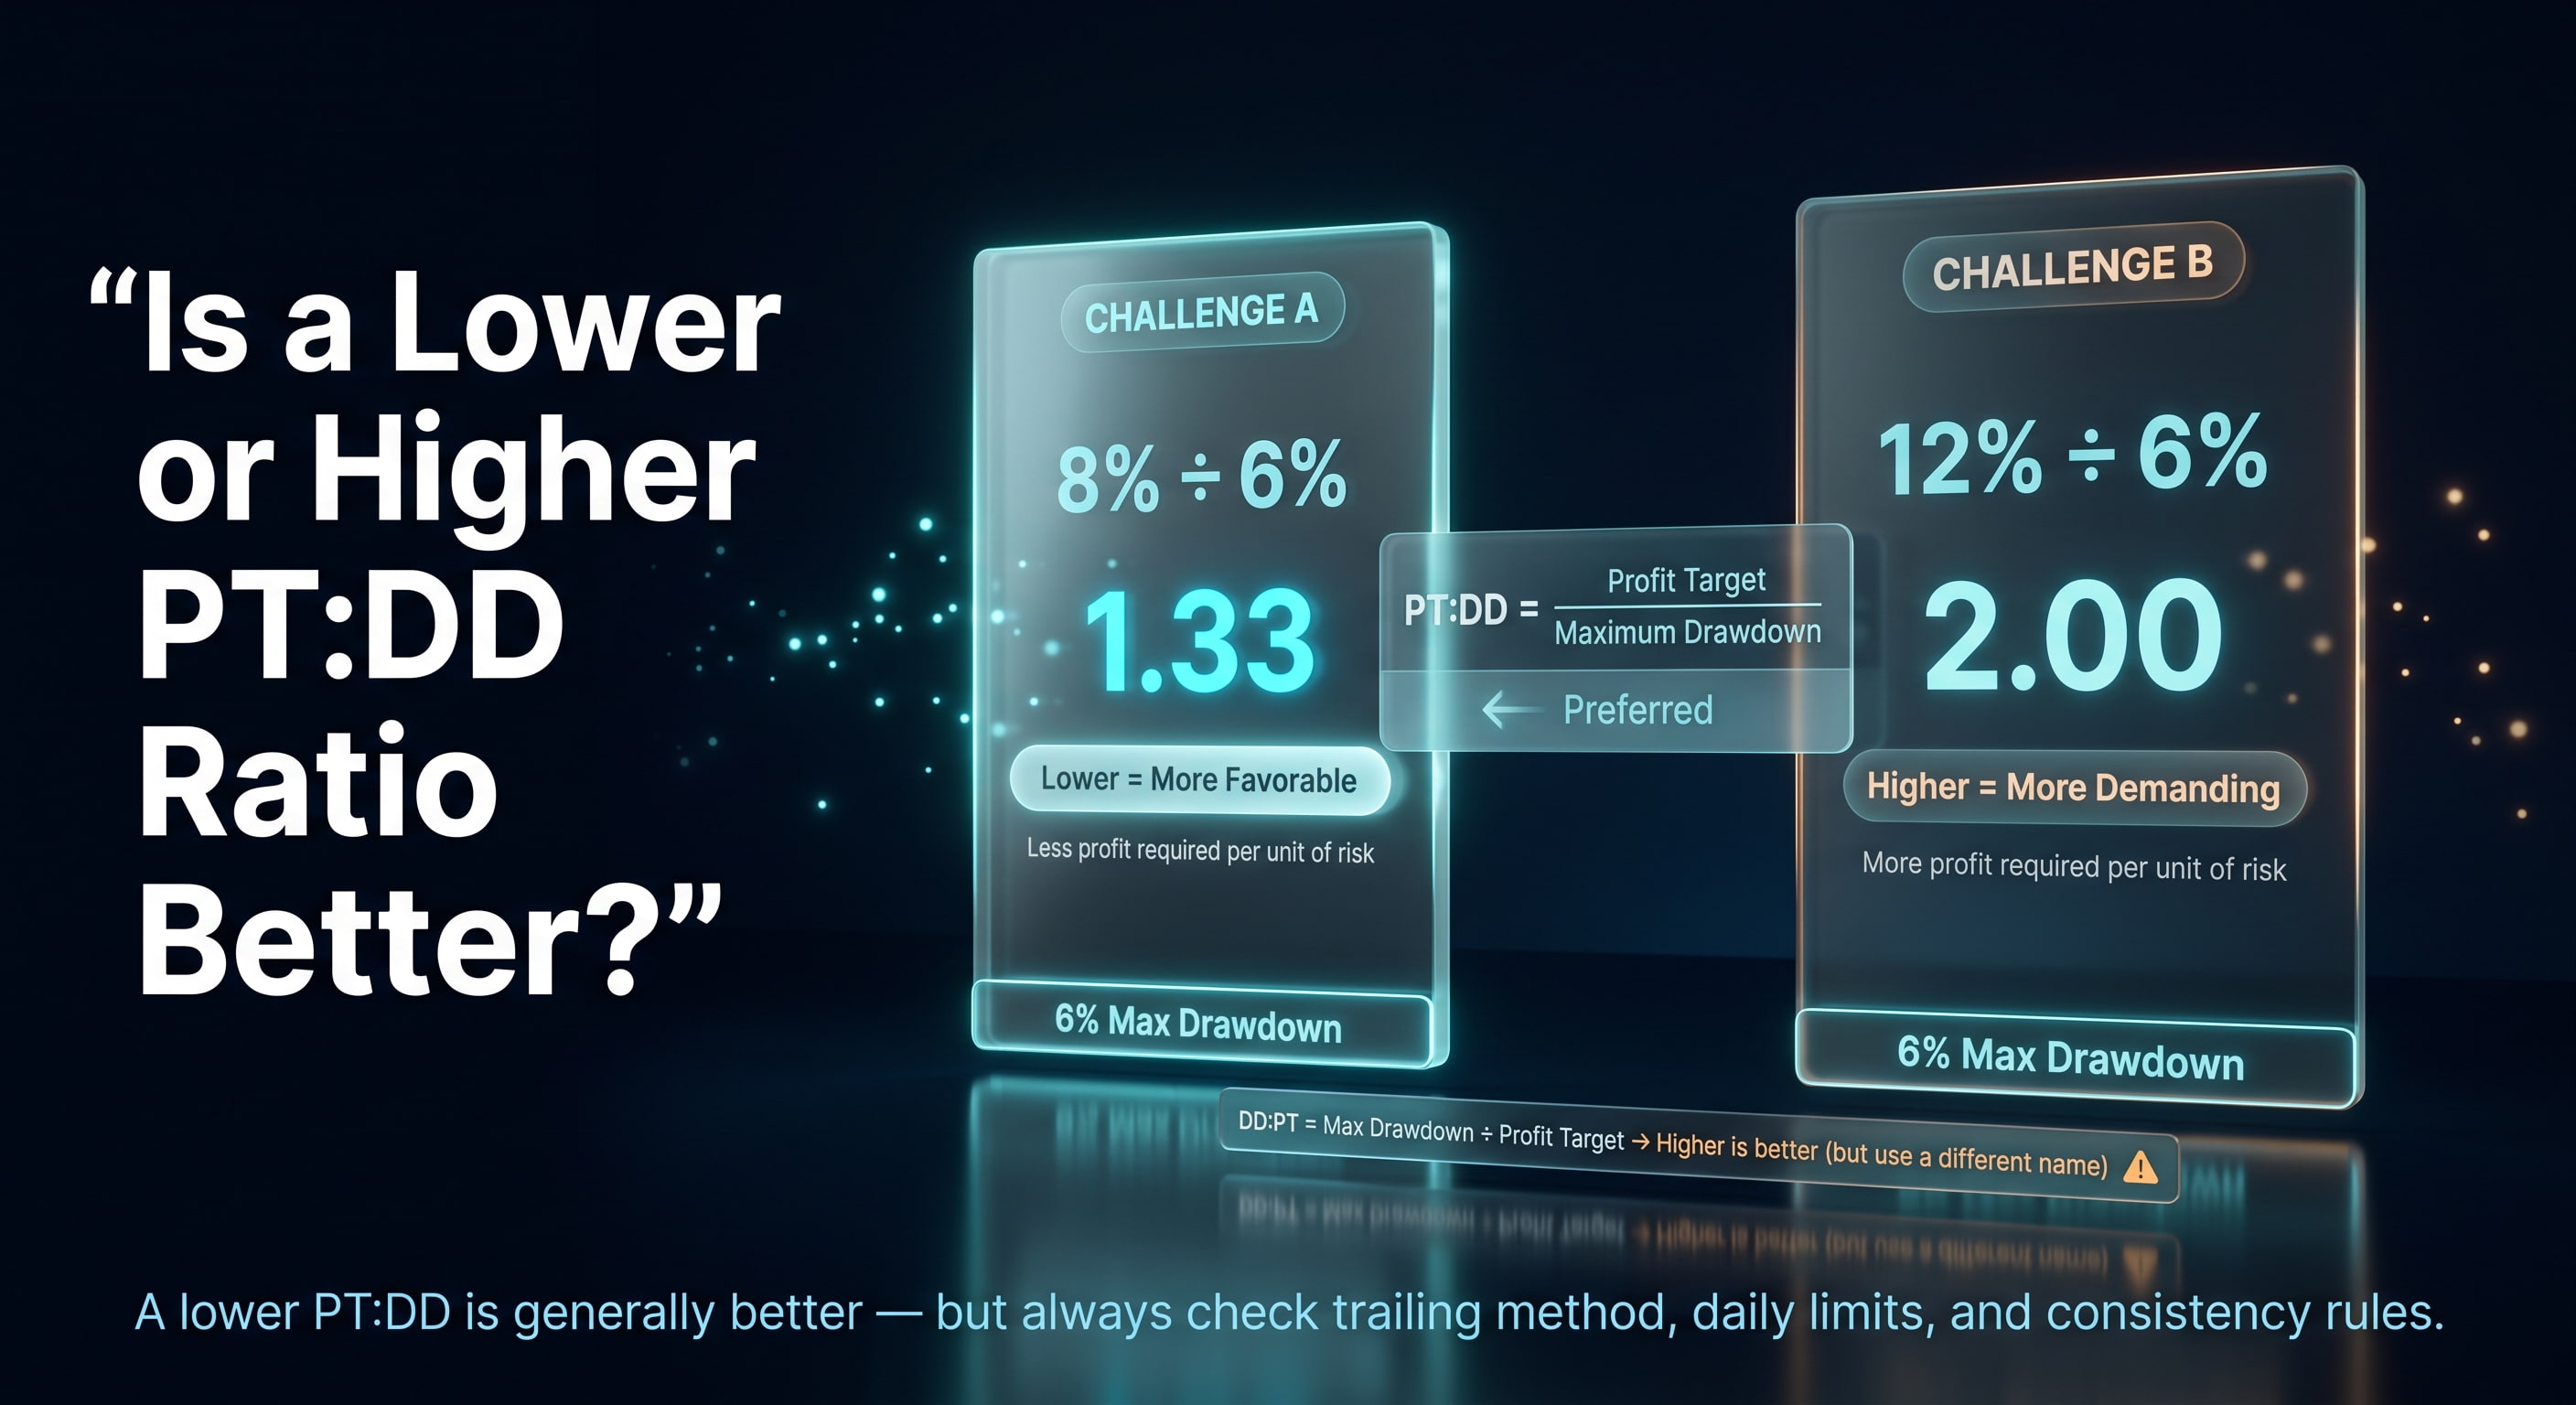
When PT:DD is calculated as profit target divided by maximum drawdown, a lower ratio is generally more favorable because less profit is required for each unit of permitted loss. However, the ratio should never be evaluated without checking the drawdown method and the rest of the challenge rules.
Consider two challenges with the same 6% maximum drawdown:
Challenge A requires an 8% profit target: 8 ÷ 6 = 1.33
Challenge B requires a 12% profit target: 12 ÷ 6 = 2.00
Challenge A requires less profit relative to the same loss allowance. On the ratio alone, it therefore provides a less demanding objective.
The direction changes if someone uses the reciprocal formula:
DD:PT = Maximum Drawdown ÷ Profit Target
Under that convention, a higher figure is generally more favorable. A 9% target and 6% drawdown would produce:
6 ÷ 9 = 0.67
That figure should be called DD:PT, not PT:DD. Using both formulas under the same name creates confusion and can reverse the conclusion of a comparison.
Neither convention is inherently wrong, but the formula must be stated clearly and used consistently. This article uses profit target divided by maximum drawdown throughout.
A lower PT:DD still does not prove that a challenge is easier. A low ratio combined with aggressive equity based trailing drawdown, a tight daily loss limit, or a strict consistency rule may be more restrictive than a higher ratio with simpler rules.
Why PT:DD Is Not the Same as Trade Risk to Reward
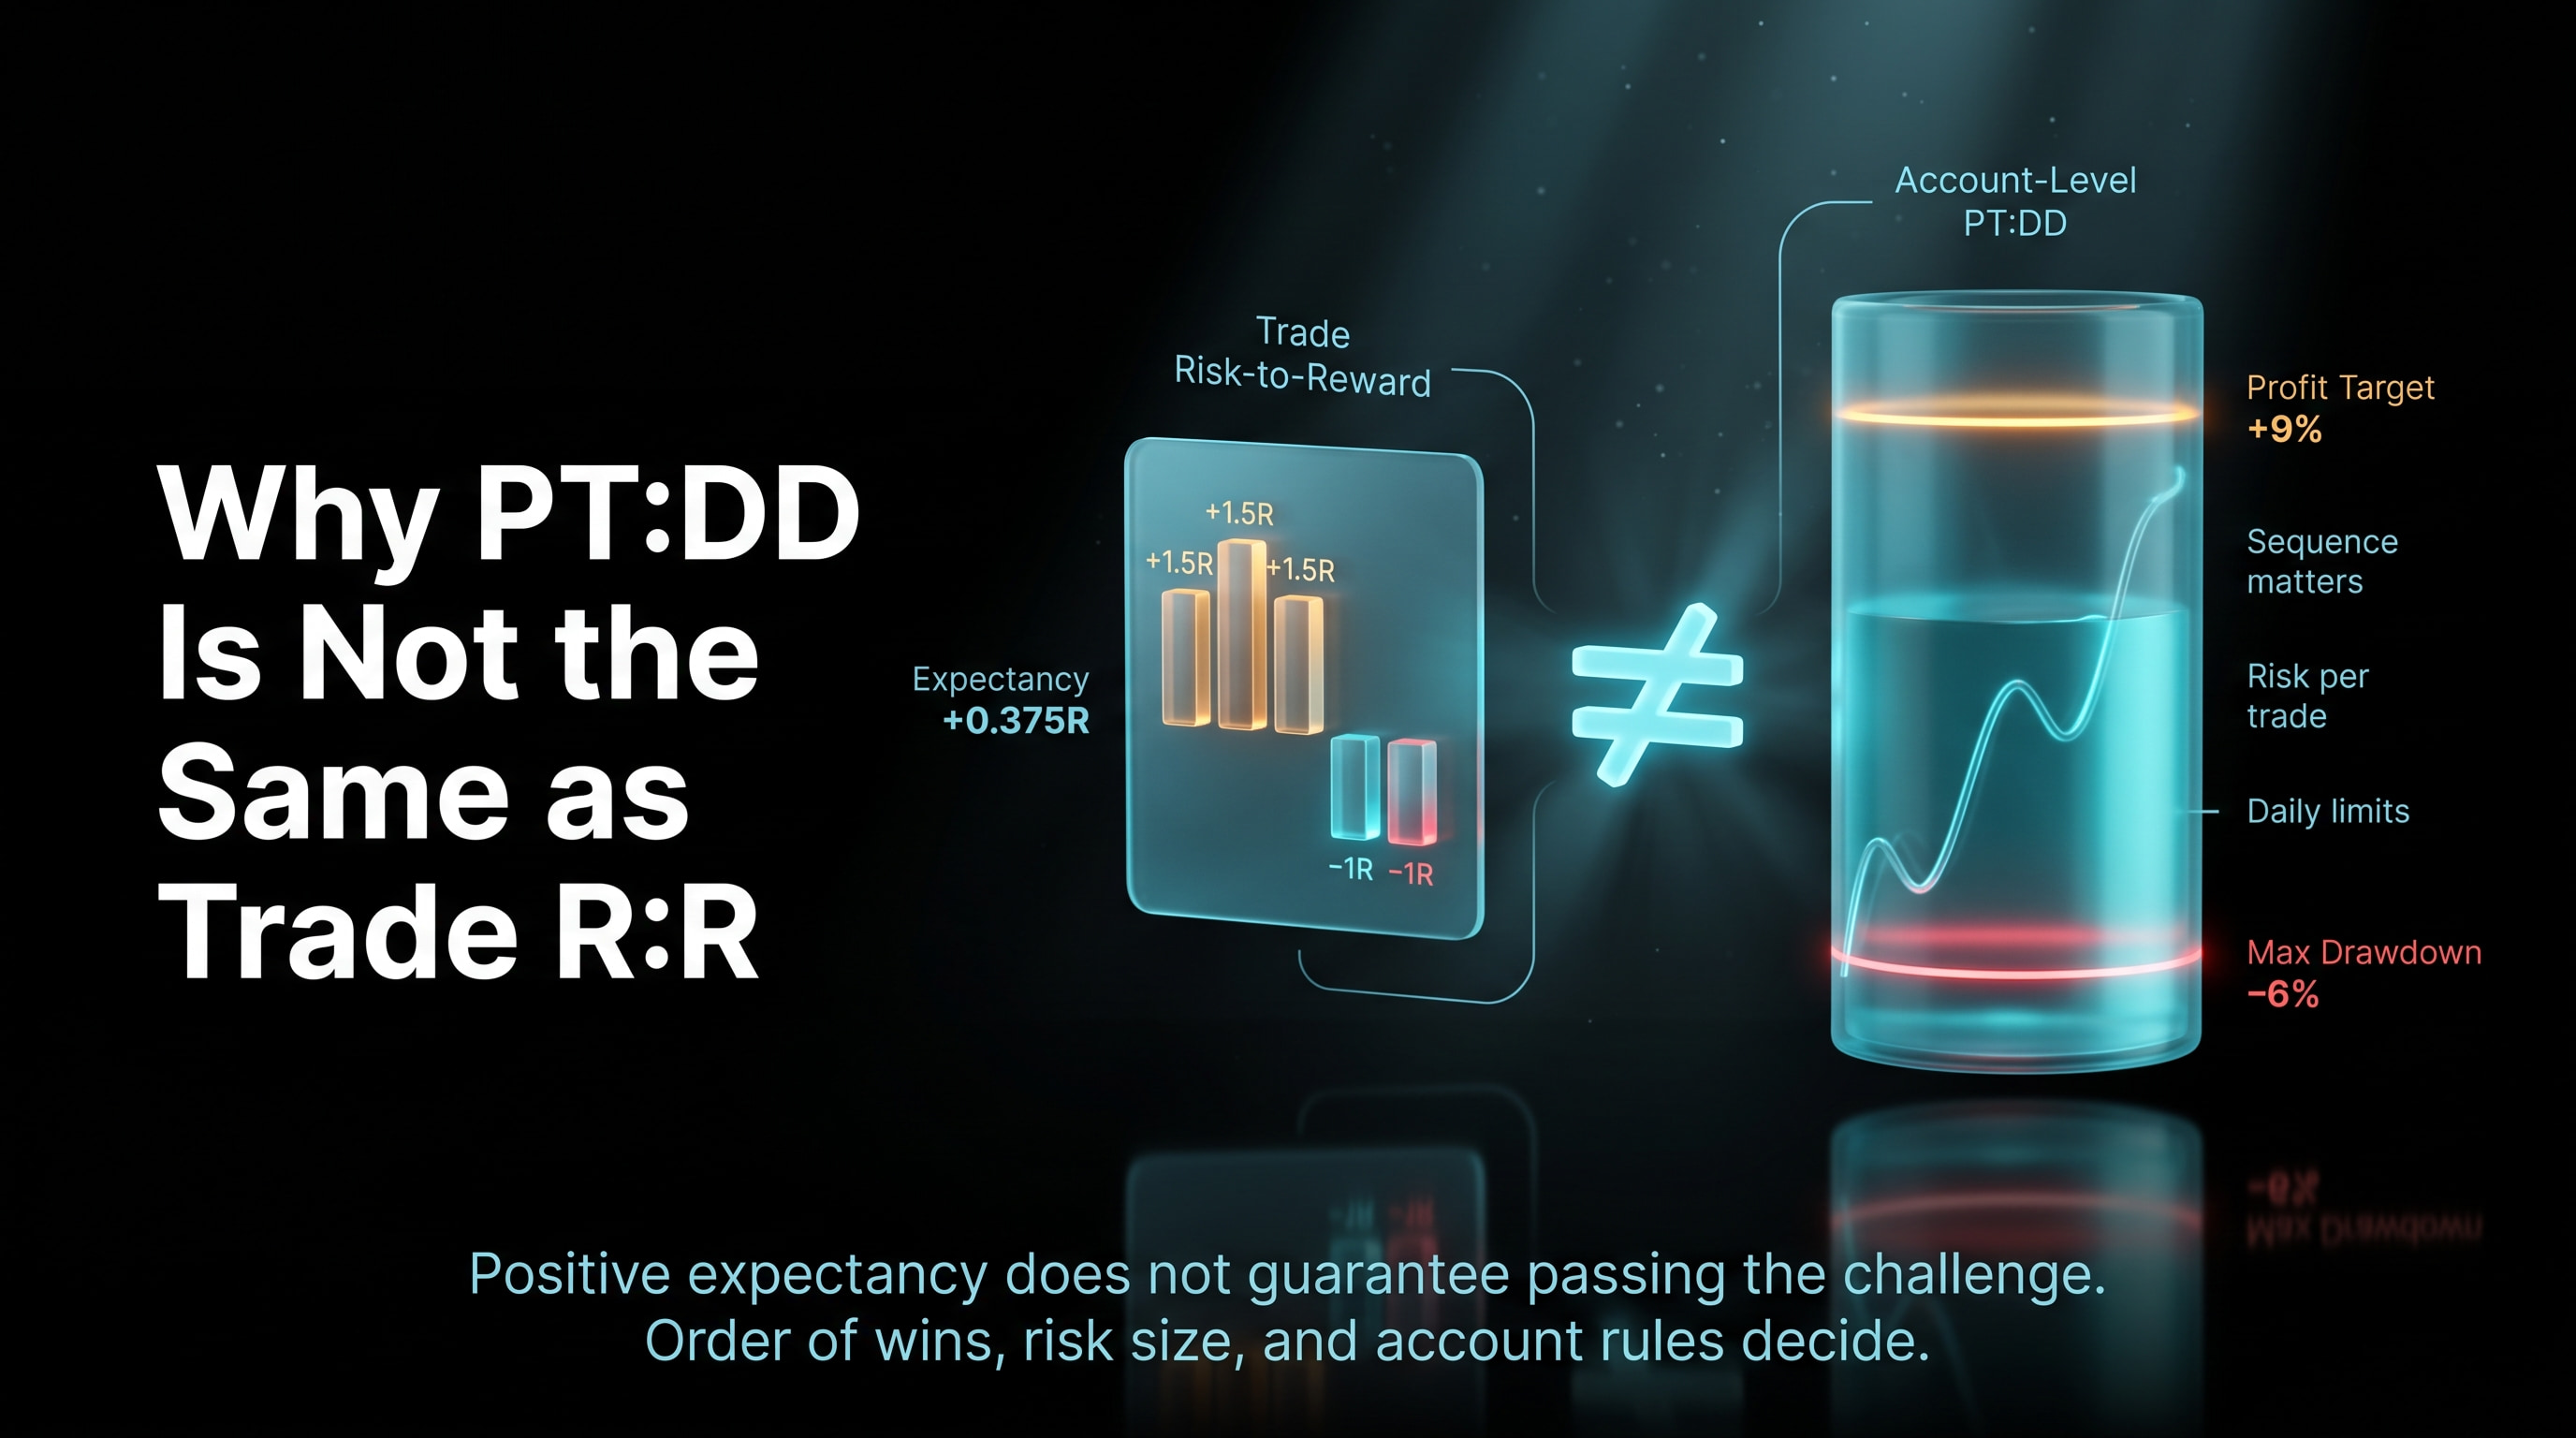
PT:DD and trade risk to reward measure different things. The PT:DD ratio compares two account level restrictions:
The return required to pass an evaluation
The maximum total loss permitted before a breach
Trade risk to reward compares the possible loss and gain on an individual position. A setup with an average win of 1.5R and an average loss of 1R has a different purpose from a challenge PT:DD of 1.50.
Trade expectancy can be estimated using:
Trade Expectancy = (Win Rate × Average Win) − (Loss Rate × Average Loss)
Suppose a strategy has:
A 55% win rate
An average winning trade of 1.5R
An average losing trade of 1R
Its theoretical expectancy before trading costs would be:
(0.55 × 1.5R) − (0.45 × 1R) = 0.375R per trade
That is positive expectancy, but it does not guarantee that the trader will reach a 9% target before breaching a 6% drawdown.
The outcome also depends on:
Risk per trade
The order of wins and losses
Correlated positions
Daily drawdown restrictions
Commissions and spreads
Slippage
Minimum trading days
Consistency rules
A profitable strategy can still fail a challenge if its normal losing sequence conflicts with the account rules. Conversely, an aggressive strategy may pass once through favorable variance without being sustainable.
PT:DD evaluates the challenge structure. Trade expectancy evaluates the strategy. A useful comparison must consider both.
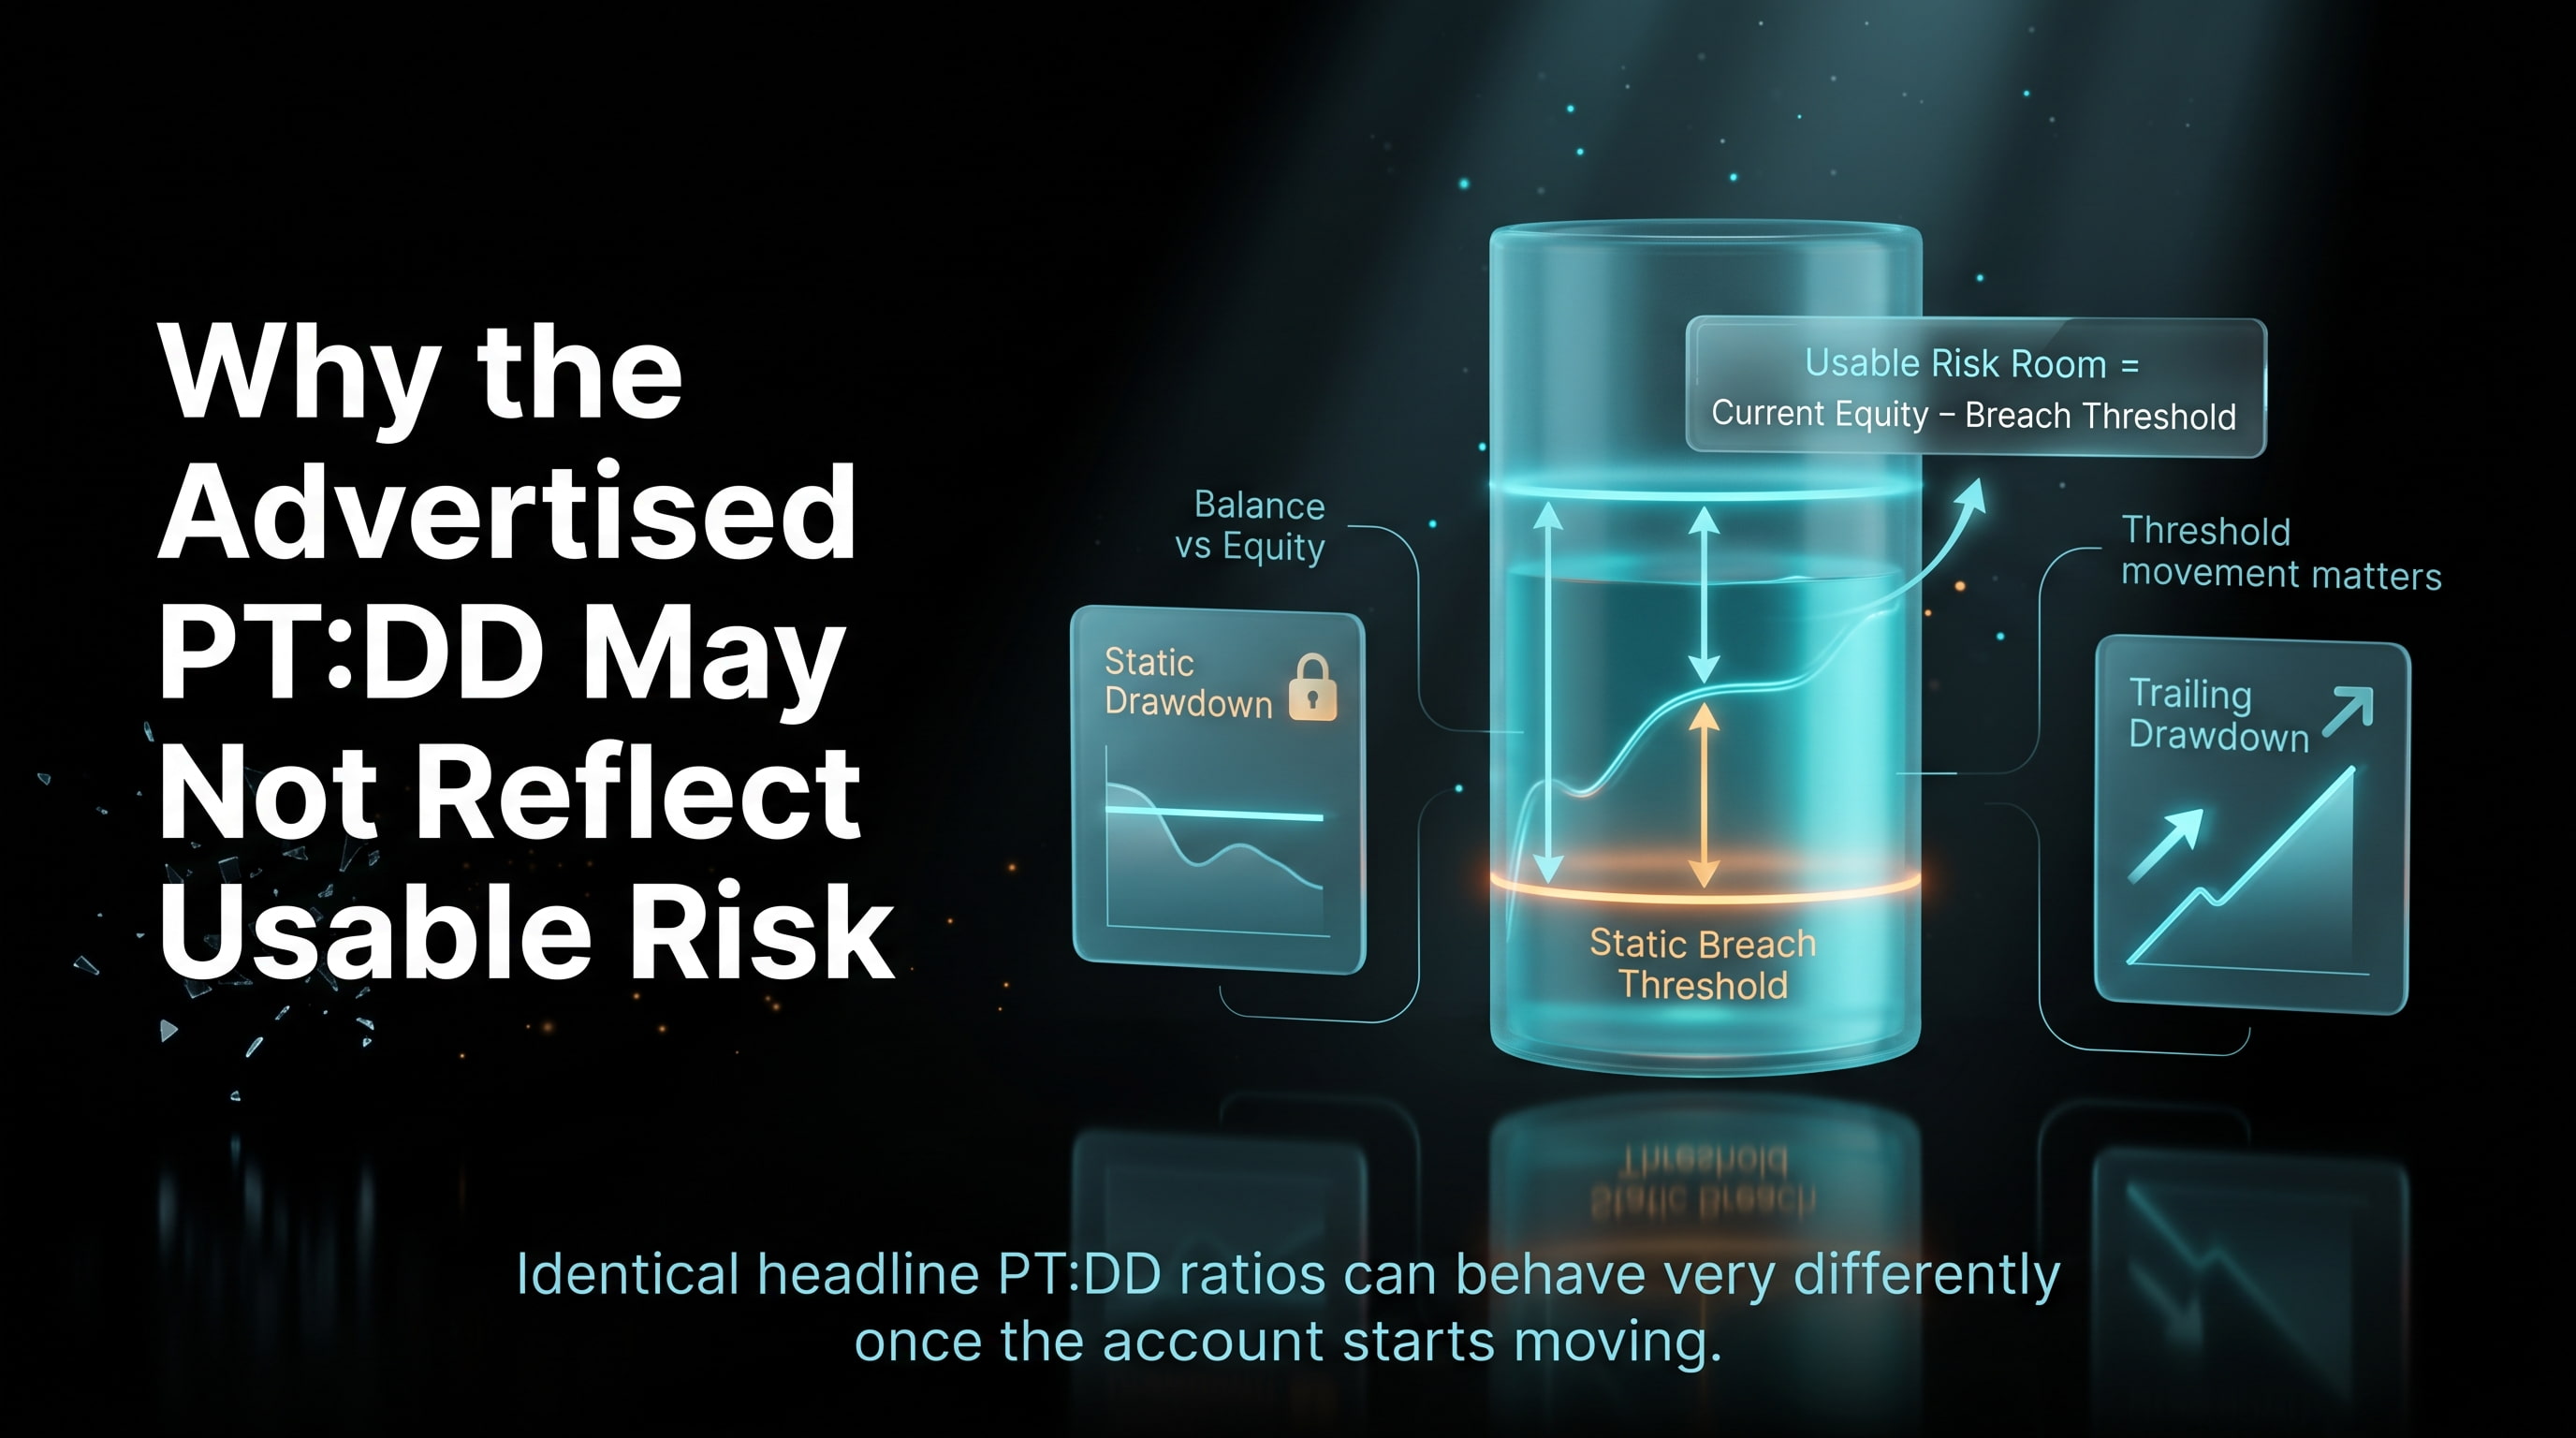
Why the Advertised PT:DD May Not Reflect Usable Risk
The advertised PT:DD is a starting ratio. It uses the original profit target and maximum drawdown, but it does not show how much loss capacity remains at every point in the evaluation.
A more practical calculation is:
Usable Risk Room = Current Equity − Current Breach Threshold
For a static drawdown, the breach threshold normally remains fixed during the applicable phase. As the account gains value, the distance between current equity and the fixed threshold can increase.
For a trailing drawdown, the threshold moves upward after new balance or equity highs. The account may show a positive return while retaining only a limited distance from the breach level.
This distinction explains why two challenges with identical headline PT:DD ratios can behave differently in practice.
It is also important to separate two questions:
Does the breach threshold remain static or move upward?
Is the account tested using balance or equity?
Static versus trailing describes how the threshold moves. Balance versus equity describes which account value is monitored. These are related but separate parts of the rule.
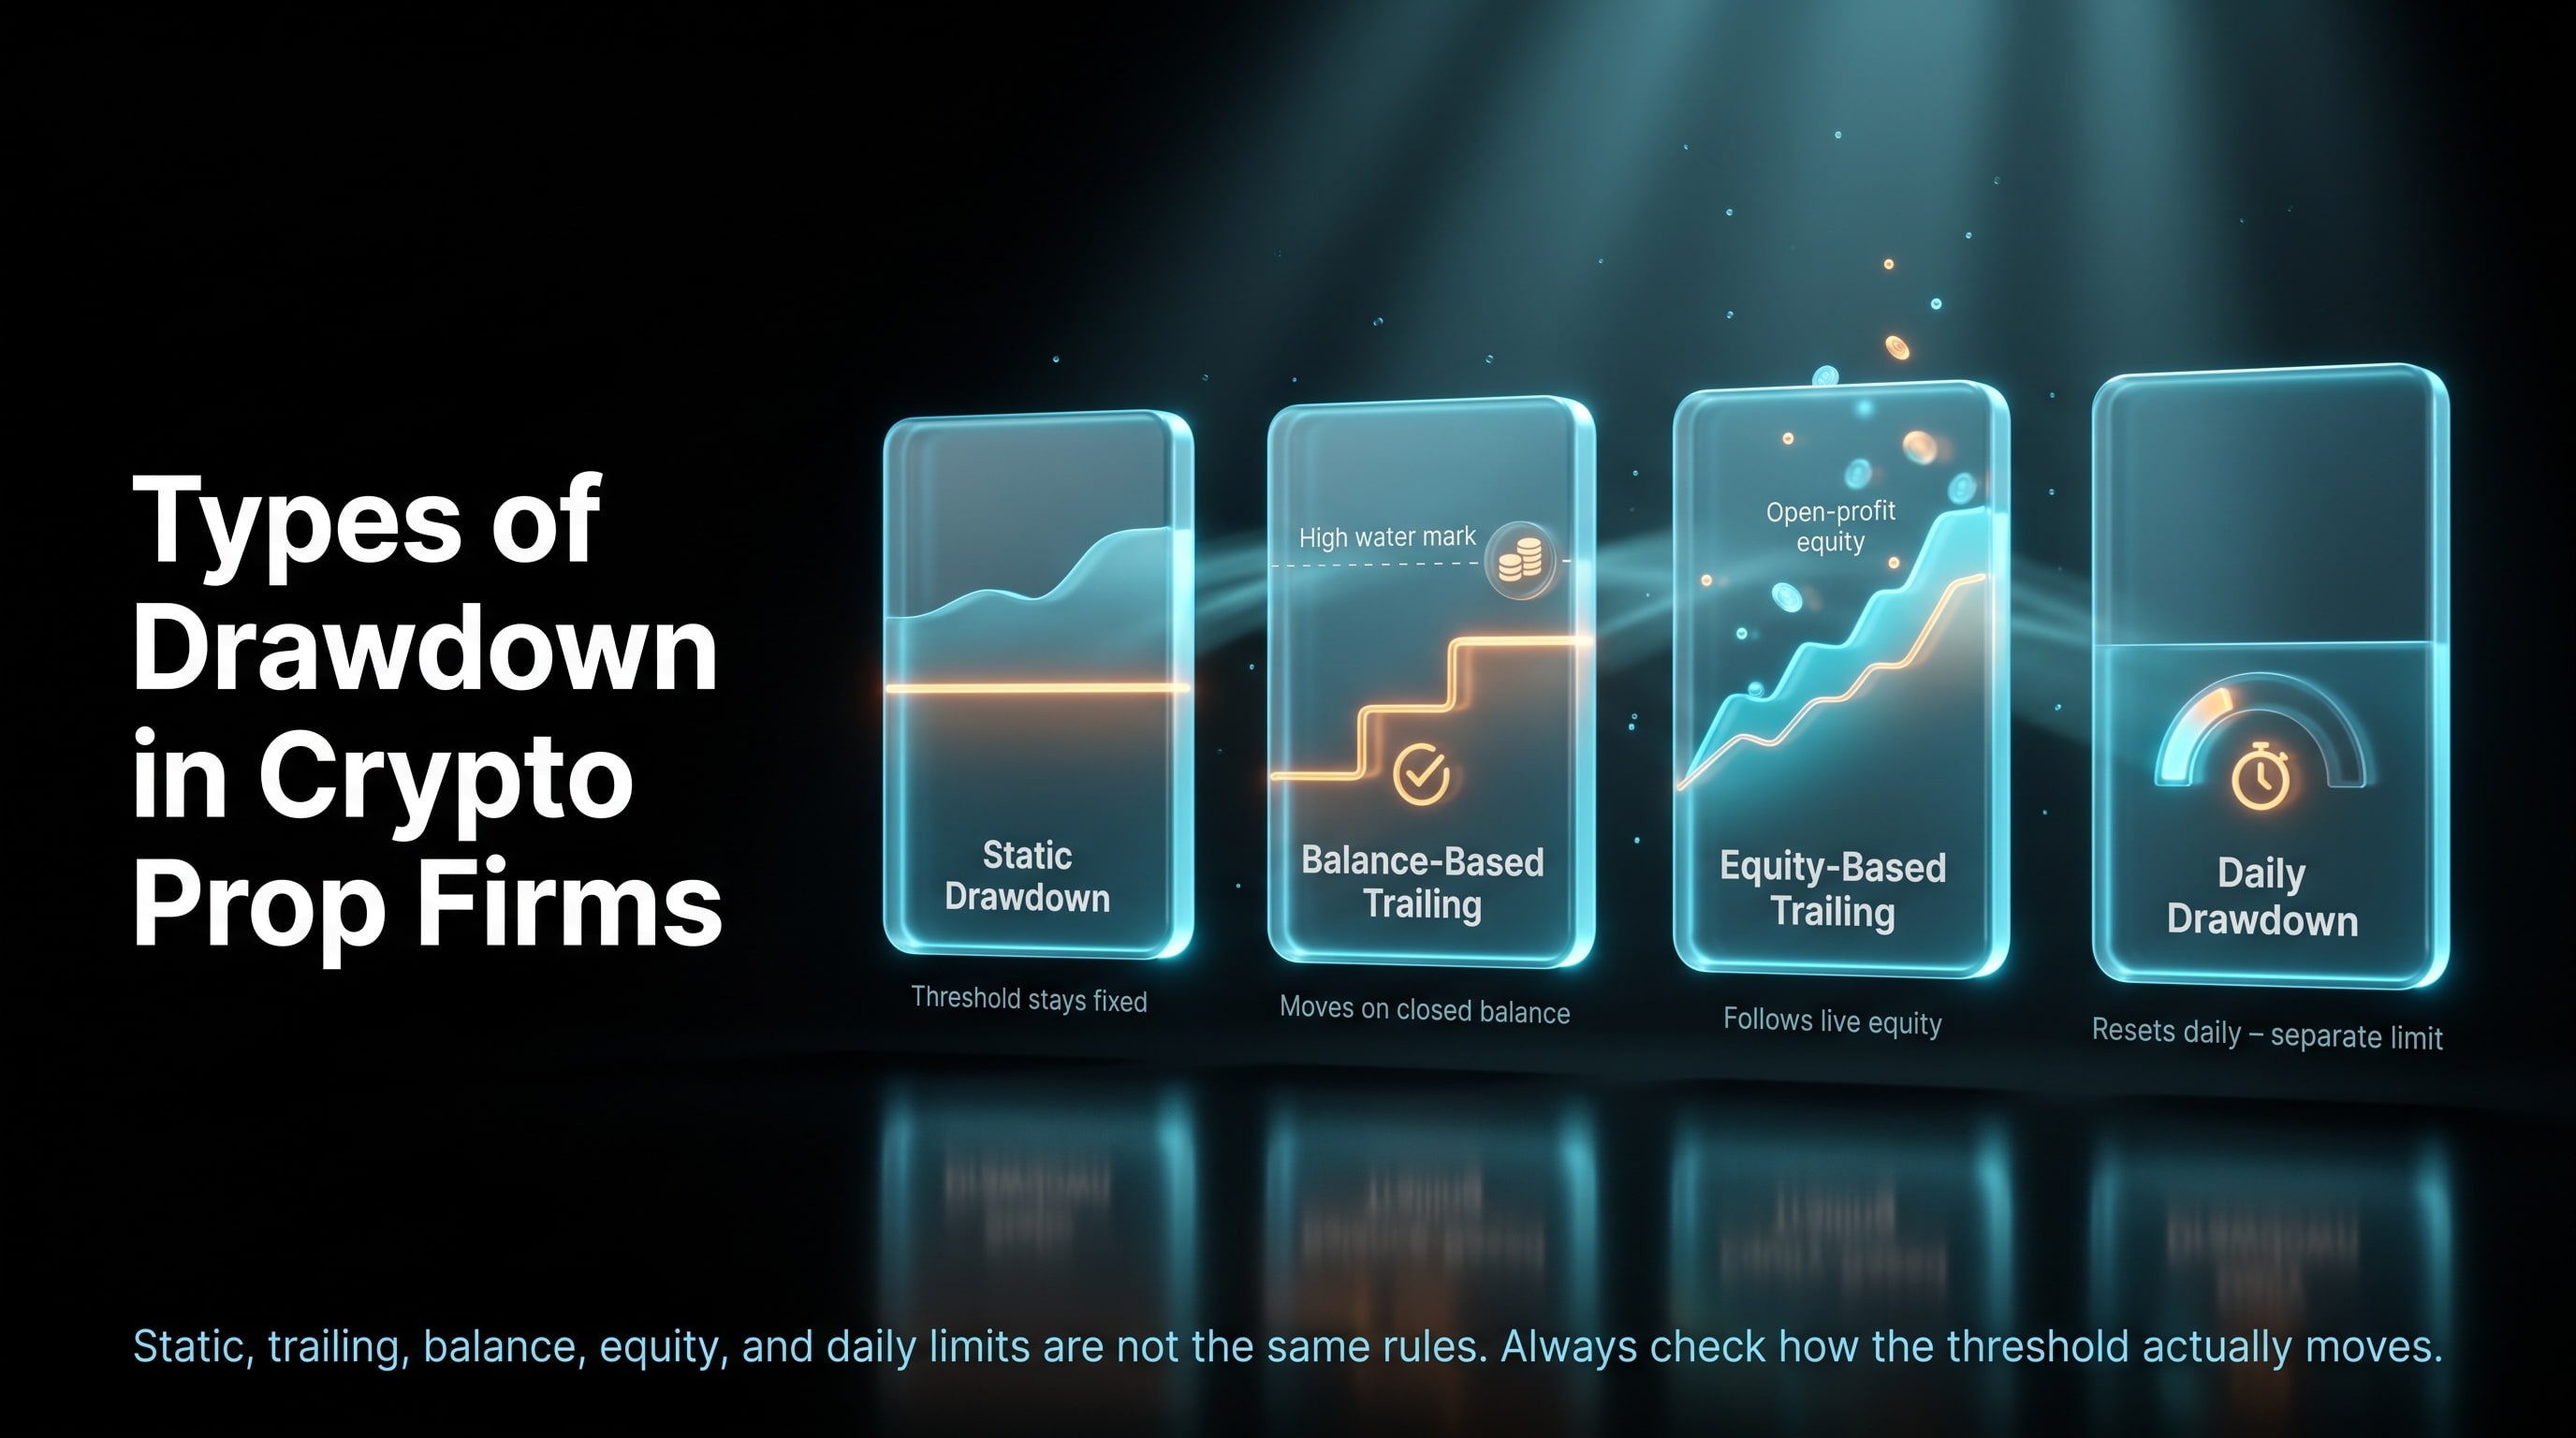
Types of Drawdown in Crypto Prop Firms
Static Drawdown
A static drawdown uses a breach threshold that remains fixed relative to the starting account value during the applicable phase.
For example, a $100,000 account with a 6% static maximum drawdown may have a fixed breach threshold of $94,000:
$100,000 − $6,000 = $94,000
If the account increases to $105,000, the threshold remains at $94,000. The distance between the current account value and the breach level has therefore increased.
Static does not necessarily mean that only closed balance matters. A firm can use a fixed threshold while still checking live equity against that threshold. The detailed terms should specify whether open losses can trigger a breach.
Balance Based Trailing Drawdown
A balance based trailing drawdown generally moves after closed profits increase the account’s highest balance.
Suppose a $100,000 account has a $5,000 trailing allowance. If the highest applicable closed balance reaches $104,000, the new threshold may become:
$104,000 − $5,000 = $99,000
Floating profit would not normally move a strictly balance based threshold. However, providers can calculate the high water mark intraday, at the end of the day, or after a position closes.
Some trailing thresholds stop moving after reaching a defined level. Others continue trailing during the entire evaluation or funded stage. The locking rule can materially change the usable risk room.
Equity Based Trailing Drawdown
An equity based trailing drawdown can follow the highest value of balance plus open profit and loss.
Suppose an account with a $5,000 trailing allowance temporarily reaches $106,000 in live equity while a position is open. The threshold could rise to $101,000, even if the position later closes with the balance at only $103,000.
That would leave $2,000 between the closing balance and the threshold:
$103,000 − $101,000 = $2,000
This is why open profit can matter under an equity based model. A temporary favorable move may raise the threshold before the profit is secured.
The exact outcome depends on whether the drawdown is measured continuously, at the end of the day, or after specific account events.
Daily Drawdown
Daily drawdown limits how much the account can lose within one trading day or calculation period. It is separate from maximum total drawdown and should not be used in the primary PT:DD formula.
A trader can remain far above the total breach threshold and still violate the daily limit during one volatile session.
Before comparing daily limits, check:
Whether the calculation uses balance, equity, or both
Whether it starts from the previous day’s balance or equity
Whether floating losses count
Which timezone controls the reset
Whether open positions are revalued at reset
Whether a breach pauses trading or fails the account
The phrase “daily drawdown resets every day” can be misleading. The calculation reference may reset, but a breach may still permanently end the evaluation.
A $100,000 Example: Static vs. Trailing Drawdown
Consider the following simplified challenge:
Starting balance: $100,000
Profit target: 10%, or $10,000
Maximum drawdown: 5%, or $5,000
PT:DD: 10 ÷ 5 = 2.00
Static threshold: fixed at $95,000
Simple balance trailing assumption: threshold remains $5,000 below the highest closed balance, no trailing lock is applied in this example.
Current Balance: $100,000
Remaining Profit Target: $10,000
Static Threshold: $95,000
Static Risk Room: $5,000
Trailing Threshold: $95,000
Trailing Risk Room: $5,000
Current Balance: $104,000
Remaining Profit Target: $6,000
Static Threshold: $95,000
Static Risk Room: $9,000
Trailing Threshold: $99,000
Trailing Risk Room: $5,000
Current Balance: $106,000
Remaining Profit Target: $4,000
Static Threshold: $95,000
Static Risk Room: $11,000
Trailing Threshold: $101,000
Trailing Risk Room: $5,000
Current Balance: $108,000
Remaining Profit Target: $2,000
Static Threshold: $95,000
Static Risk Room: $13,000
Trailing Threshold: $103,000
Trailing Risk Room: $5,000
At a balance of $108,000, the account needs another $2,000 to reach the target.
Under the static model, it has $13,000 between the current balance and the $95,000 breach threshold. That equals:
13% of the starting balance
Approximately 12.04% of the current balance
Under the simplified trailing model, the breach threshold has moved to $103,000. The remaining risk room is $5,000:
5% of the starting balance
Approximately 4.63% of the current balance
The original PT:DD remains 2.00 in both cases, but the path toward the target is different. The static model allows the buffer to expand as closed profit increases, while the trailing model maintains a narrower distance from the moving threshold.
This example does not prove that every static challenge is easier than every trailing challenge. A trailing drawdown may lock at a specific point, and a static challenge may contain tighter daily or consistency rules. The full rule set still matters.
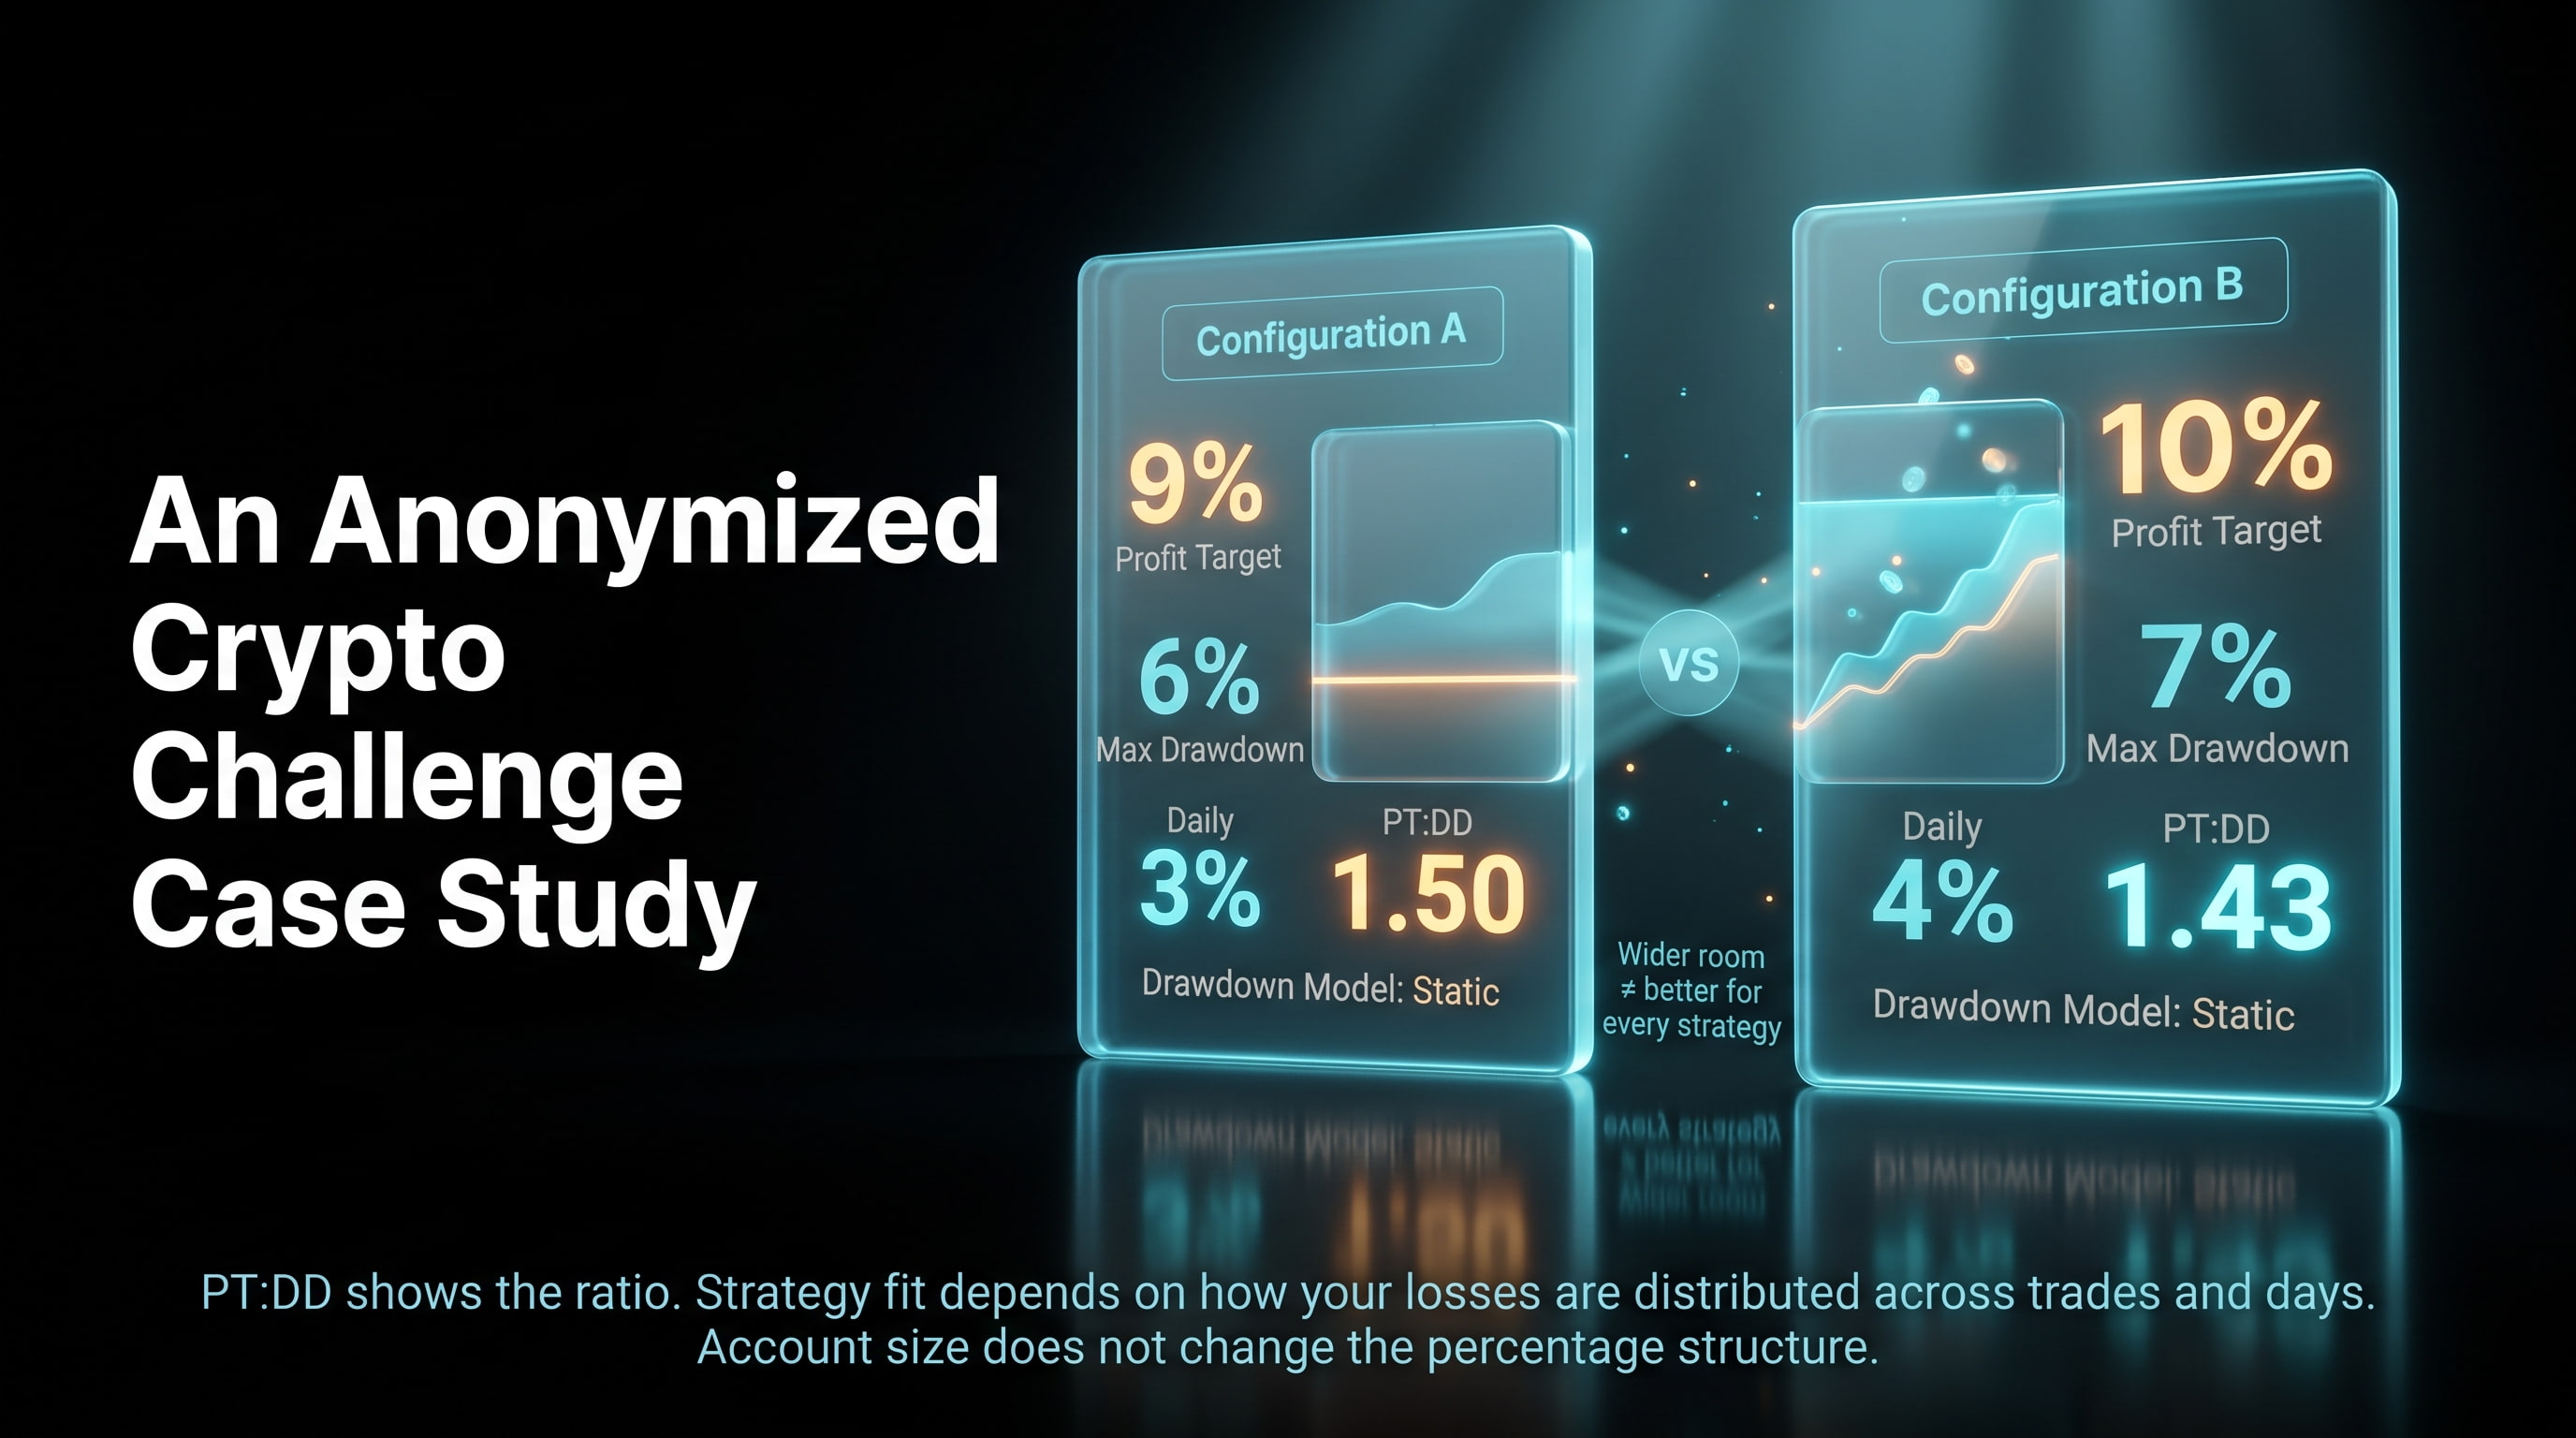
An Anonymized Crypto Challenge Case Study
Consider two single phase configurations within a crypto focused evaluation model:
Rule: Profit Target
Configuration A: 9%
Configuration B: 10%Rule: Maximum Drawdown
Configuration A: 6%
Configuration B: 7%Rule: Daily Drawdown
Configuration A: 3%
Configuration B: 4%Rule: Drawdown Model
Configuration A: Static
Configuration B: StaticRule: PT:DD
Configuration A: 1.50
Configuration B: 1.43
Configuration B has a slightly lower PT:DD:
10 ÷ 7 = 1.43
It also provides a wider maximum and daily drawdown, although the trader must reach a larger 10% target.
Configuration A requires a smaller profit target but offers less daily and total loss capacity. A trader using tight intraday risk controls may prefer the lower target, while a strategy with wider stops may place more value on the additional drawdown room.
Neither configuration is automatically better for every strategy. PT:DD indicates the relationship between the target and total drawdown, but personal strategy fit depends on how losses are distributed across trades and trading days.
Account size does not change the percentage ratio. A 9% target and 6% drawdown always produce a PT:DD of 1.50, whether the nominal account size is $5,000 or $100,000. Larger accounts change the dollar amounts, not the relative challenge structure.
Seven Questions to Ask Before Choosing a Crypto Prop Challenge
1. What is the PT:DD for each phase?
Calculate the ratio separately for every evaluation phase. Avoid combining targets unless the comparison method does the same for every challenge.
2. Is the maximum drawdown static or trailing?
A headline percentage is incomplete without knowing whether the breach threshold remains fixed or moves upward.
3. Is drawdown monitored using balance or equity?
Equity based monitoring includes open profit and loss. A position can therefore trigger a breach before it closes.
4. How is daily drawdown calculated?
Check the reference value, reset time, timezone, treatment of floating P&L, and consequences of a breach.
5. Does the trailing threshold eventually lock?
A trailing drawdown that stops moving at the starting balance or another predefined level behaves differently from one that continues indefinitely.
6. Are there time or consistency restrictions?
Minimum trading days, maximum profitable day percentages, position size limits, and time limits can make a favorable PT:DD less useful.
7. What trading costs and payout conditions apply?
Spreads, commissions, slippage, payout thresholds, profit splits, and withdrawal rules are not included in PT:DD. They still affect the practical value of the account.
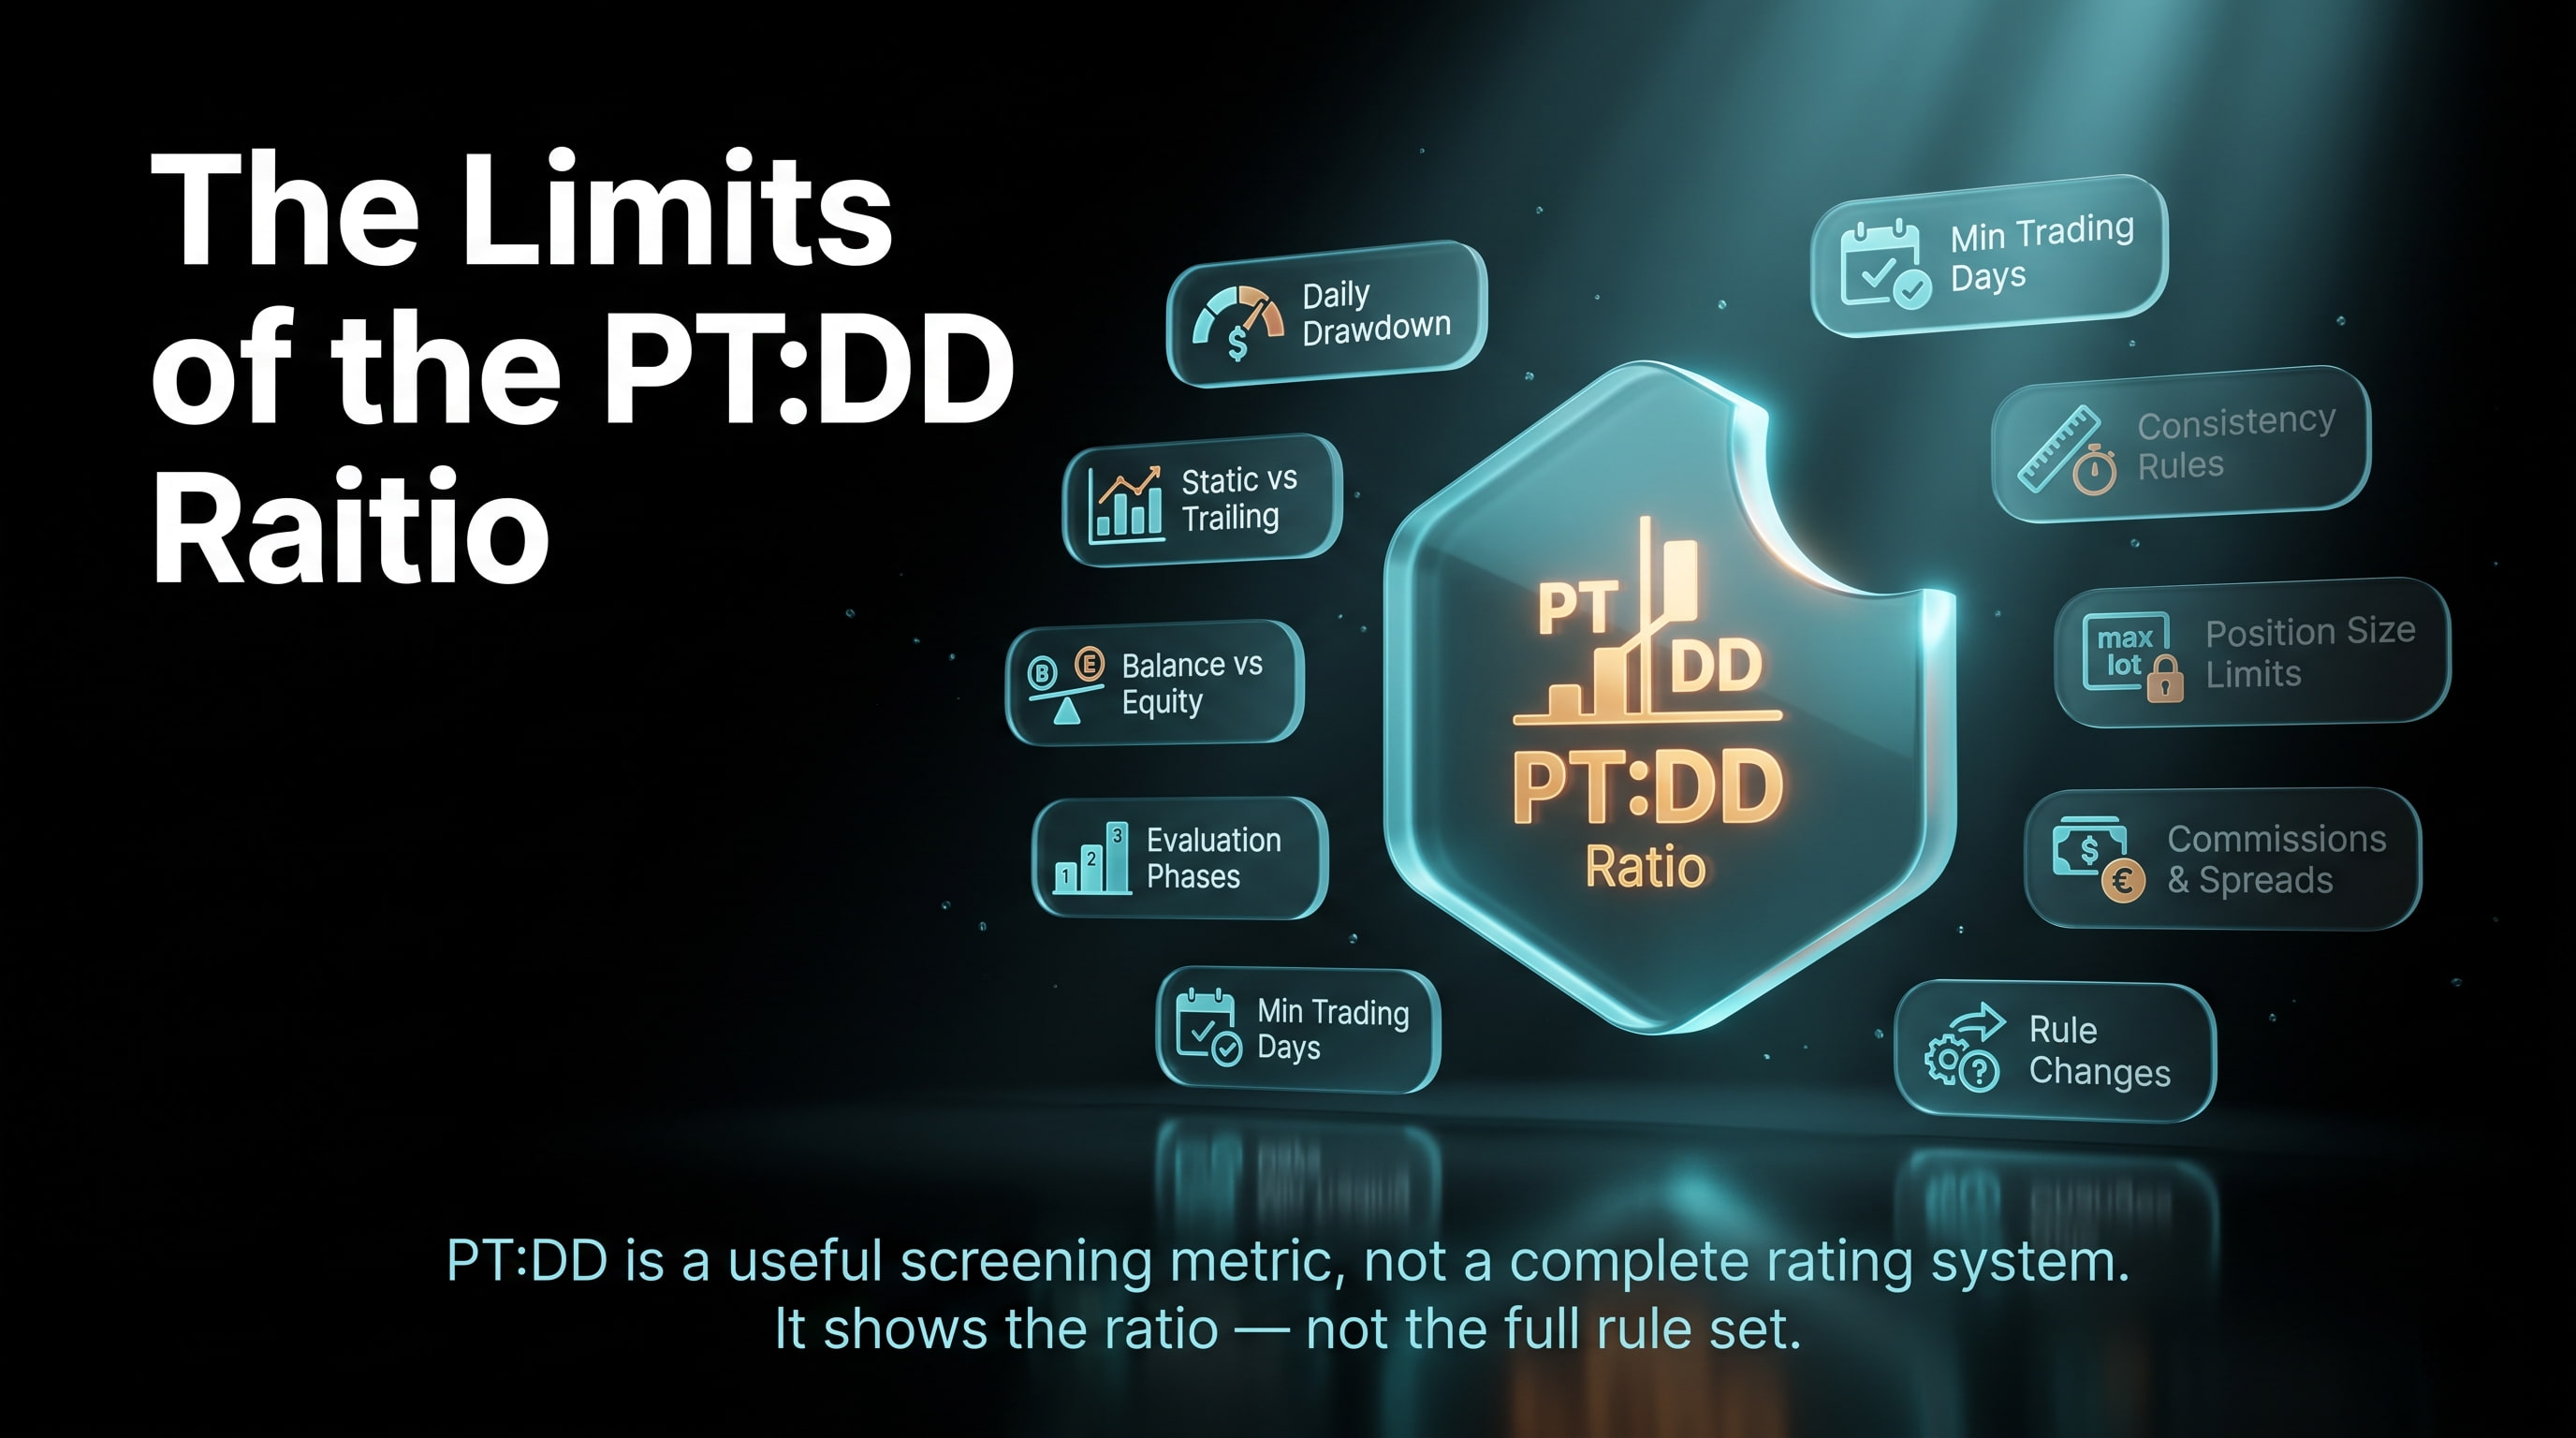
The Limits of the PT:DD Ratio
PT:DD is useful because it reduces two important rules to one comparable number. Its simplicity is also its main limitation.
The ratio does not account for:
Daily drawdown
Static versus trailing mechanics
Balance versus equity monitoring
Number of evaluation phases
Minimum trading days
Maximum trading periods
Consistency rules
Position size restrictions
Commissions and spreads
Payout eligibility
Differences between evaluation and funded account rules
It also does not measure execution quality, platform reliability, customer support, or whether rules have changed since the comparison was published.
For that reason, PT:DD should be treated as a screening metric rather than a complete rating system. It can identify configurations worth examining, but it cannot determine challenge quality on its own.
Common Mistakes When Interpreting PT:DD in Crypto Prop Challenges
The PT:DD ratio is simple to calculate, but small differences in terminology and challenge rules can produce misleading comparisons. Avoiding the following mistakes makes the ratio a more reliable screening tool.
Reversing the Formula Without Renaming the Ratio
PT:DD should be calculated consistently as:
Profit Target ÷ Maximum Drawdown
Under this formula, a 9% target and 6% maximum drawdown produce a ratio of 1.50.
The reciprocal calculation produces:
Maximum Drawdown ÷ Profit Target = 6 ÷ 9 = 0.67
That result should be labeled DD:PT. Switching between the two formulas without changing the name can reverse the interpretation of which challenge is more favorable.
Assuming a Higher PT:DD Is Always Better
When PT:DD is calculated as profit target divided by maximum drawdown, a lower figure generally means less profit is required for each unit of total permitted loss.
For example:
8% ÷ 8% = 1.00
9% ÷ 6% = 1.50
10% ÷ 5% = 2.00
If all other rules are identical, the 1.00 ratio creates a smaller relative target than the 2.00 ratio. The idea that “higher is always better” applies only when the reciprocal DD:PT formula is being used.
Comparing Different Evaluation Stages as If They Were Identical
A one phase challenge should not automatically be compared with the combined targets of a two phase evaluation.
Suppose a two phase model requires 8% in phase one and 5% in phase two. Adding the targets and treating the result as a single 13% objective ignores the fact that each phase normally starts with a new account state and a separate drawdown limit.
For a more accurate comparison, calculate PT:DD separately for each phase and then consider how many phases the trader must complete.
Ignoring How the Drawdown Threshold Moves
Two challenges can advertise the same profit target and maximum drawdown while providing very different amounts of usable risk.
A static threshold normally remains fixed relative to the starting account value. A trailing threshold can move upward after new balance or equity highs. As a result, identical headline PT:DD ratios may produce different risk conditions as the account approaches its target.
The ratio should therefore be reviewed alongside the drawdown model, calculation frequency, high water mark definition, and any locking rule.
Assuming a Larger Account Has a Better PT:DD
Account size changes the dollar value of the target and drawdown, but it does not change the percentage ratio when the rules remain proportional.
For example, a 9% target and 6% maximum drawdown produce a PT:DD of 1.50 on both a $10,000 and a $100,000 account.
The larger account has greater dollar exposure, but the relative target to drawdown relationship is unchanged. Account size should therefore be selected based on position sizing, monetary risk tolerance, and cost, not because it appears to offer a better percentage ratio.
Calling a Ratio “Good” Without Reviewing the Full Rule Set
There is no universally good PT:DD ratio.
A value closer to 1 generally requires less profit relative to the total drawdown than a value closer to 2. However, the lower ratio may still come with restrictive daily limits, equity based trailing drawdown, consistency rules, position size caps, or multiple evaluation phases.
A PT:DD ratio should only be described as favorable within a defined comparison. The challenges must use the same formula, phase structure, drawdown model, and similar trading conditions. Without that context, labels such as “best” or “most trader friendly” are not supported by the ratio alone.

Using PT:DD as a Crypto Prop Trading Screening Tool
PT:DD turns the profit target and maximum drawdown into a useful starting metric. Under the profit target divided by drawdown convention, a lower ratio generally means less profit is required for each unit of total permitted loss.
The headline number, however, does not show how the risk conditions may change during the evaluation. Daily limits, trailing mechanics, equity monitoring, consistency rules, and trading costs can all reduce the usable risk available on the path to the target.
A practical comparison therefore requires two steps: calculate the nominal PT:DD, then examine how the drawdown rules operate in real trading conditions. The ratio can identify which challenge deserves closer review, but it cannot determine the best provider or predict whether an individual trader will pass.
The most suitable structure is not simply the one with the lowest ratio. It is the one whose profit requirement, usable risk room, and operating rules remain compatible with the trader’s tested strategy.
Disclaimer: This article is for educational purposes only and does not constitute financial advice. Crypto prop firm rules can change, so traders should verify the current terms and calculation methods before purchasing an evaluation.
About the Creator
Sophie
Trader focused on Price Action & Order Flow.
Into crypto, fast execution, controlled risk, and quality setups.
Passing funded accounts and refining my trading every day.
Enjoyed the story? Support the Creator.
Subscribe for free to receive all their stories in your feed.
Comments
There are no comments for this story
Be the first to respond and start the conversation.