
Markets Weekly Overview for October 18 - 24
Markets Weekly Overview for October 18 - 25


We make up a weekly medium-term trade list based on CFTC reports and technical analysis.
The overview provides a description of the technical condition of the market on the most popular financial instruments, as well as information on the large speculators’ actions according to the last COT reports and the previous period.
If you want to use CFTC reports in your trading practice, you should understand that for an objective assessment of the situation it’s not enough to have the data of the last report. The dynamic is more important, in other words, comparing the statistics of large speculators’ actions in the current period with the previous one, so we mention both values.
Key topics
• Trade list for the current week
• E-Mini S&P500 (ESZ21)
• Dollar Index (DXY)
• Euro (EURUSD)
• Swiss Franc (USDCHF)
• British Pound (GBPUSD)
• Japanese Yen (USDJPY)
• WTI Crude Oil (CLZ21)
• Canadian Dollar (USDCAD)
• Gold (XAUUSD)
• Silver(XAGUSD)
• Australian Dollar (AUDUSD)
• New Zealand Dollar (NZDUSD)
• Russian Rouble (USDRUB)
• Conclusions
E-Mini S&P500 (ESZ21)
The resistance level was broken on the Daily timeframe on Thursday, the trend is bullish now and the impulse wave develops. A pullback buying opportunity will appear after the correction formation on the Daily timeframe. Long positions will remain relevant until the market is above the nearest support level on the Daily timeframe, the lows of October 11 – 14.
COT indicator increases. CFTC reports indicate that large speculators are buying and the professionals’ opinion corresponds to the market technical picture.

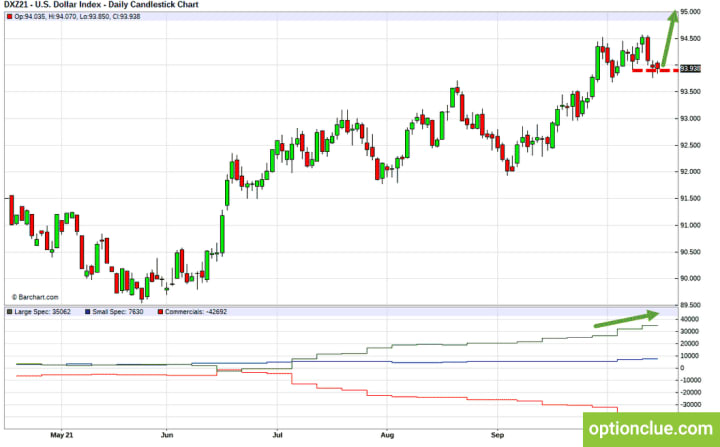
Dollar Index (DXY)
The market remains in the uptrend. The correction came to an end last week and the pullback buying opportunity was formed. Long positions will remain relevant until the market is above the nearest support level on the Daily timeframe, the lows of October 7 – 12.
COT indicator increases. CFTC reports indicate that large speculators are buying the dollar, hedgers are selling and the professionals’ opinion corresponds to the Daily trend direction.
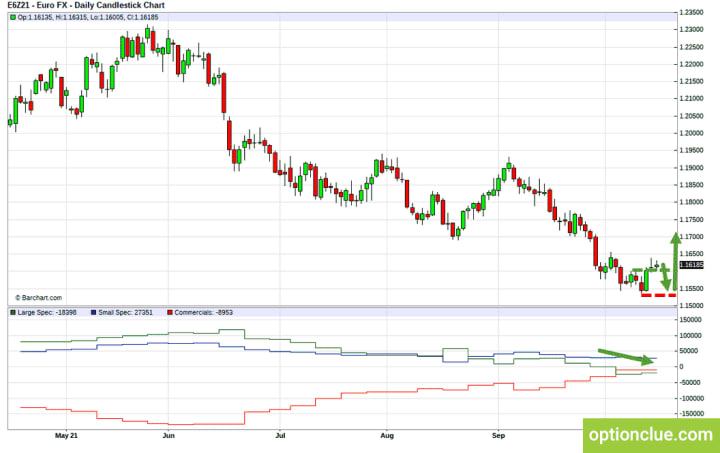
Euro (EURUSD)
The resistance level was broken on the Daily timeframe on Wednesday, the trend is bullish now and the impulse wave develops. A pullback buying opportunity will appear after the correction formation on the Daily timeframe. Long positions (EURUSD) will remain relevant until the market is above the nearest support level on the Daily timeframe, the lows of October 11 – 14.
COT indicator increased but didn’t reverse. Large speculators are selling Euro and the professionals’ opinion doesn’t correspond to the market technical picture and it makes sense to reduce the position size when an entry point appears in the trend direction.
Swiss Franc (USDCHF)
The support level was broken on the Daily timeframe on Wednesday, the trend is bearish now and the impulse wave develops. A pullback selling opportunity will appear after the correction formation on the Daily timeframe. Short positions (USDCHF) will remain relevant until the market is below the nearest resistance level on the Daily timeframe, the highs of October 11 – 13.
COT indicator decreases. Large speculators are selling franc and the professionals’ opinion doesn’t correspond to the market technical picture and it makes sense to reduce the position size when an entry point appears in the trend direction.

British Pound (GBPUSD)
The resistance level was broken on the Daily timeframe on Thursday, the trend is bullish now and the impulse wave develops. A pullback buying opportunity will appear after the correction formation on the Daily timeframe. Long positions (GBPUSD) will remain relevant until the market is above the nearest support level on the Daily timeframe, the lows of October 11 – 14.
COT indicator increased but didn’t reverse. CFTC reports indicate that large speculators are selling Pound and the professionals’ opinion doesn’t correspond to the Daily trend direction and it makes sense to reduce the position size when an entry point appears in the trend direction.

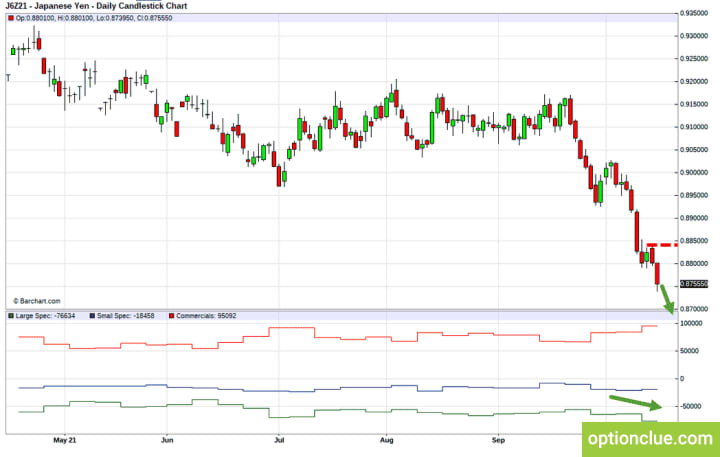
Japanese Yen (USDJPY)
USDJPY currency pair remains in the bullish trend. The correction came to an end last week and the pullback buying opportunity was formed. Long positions (USDJPY) will remain relevant until the market is above the nearest support level on the Daily timeframe, the lows of October 13 – 15.
COT indicator decreases. Large speculators are selling Yen and the professionals’ opinion corresponds to the Daily trend direction.
WTI Crude Oil (CLZ21)
The market remains in the bullish trend and the impulse wave develops. A pullback buying opportunity will appear after the correction formation on the Daily timeframe. Long positions will remain relevant until the market is above the nearest support level on the Daily timeframe, the lows of October 6 – 8.
COT net position indicator increases. Large speculators are buying oil. Professionals’ opinion corresponds to the Daily trend direction.

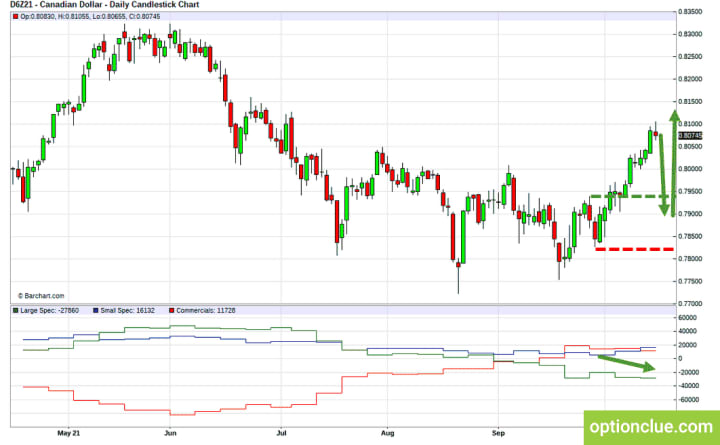
Canadian Dollar (USDCAD)
The market remains in the bearish trend and the impulse wave develops. A pullback selling opportunity will appear after the correction formation on the Daily timeframe. Short positions (USDCAD) will remain relevant until the market is below the nearest resistance level on the Daily timeframe, the highs of September 28 – October 4.
COT indicator decreases. CFTC reports indicate that large speculators are selling the Canadian dollar and hedgers are buying and the professionals’ opinion doesn’t correspond to the market technical picture and it makes sense to reduce the position size when an entry point appears in the trend direction.
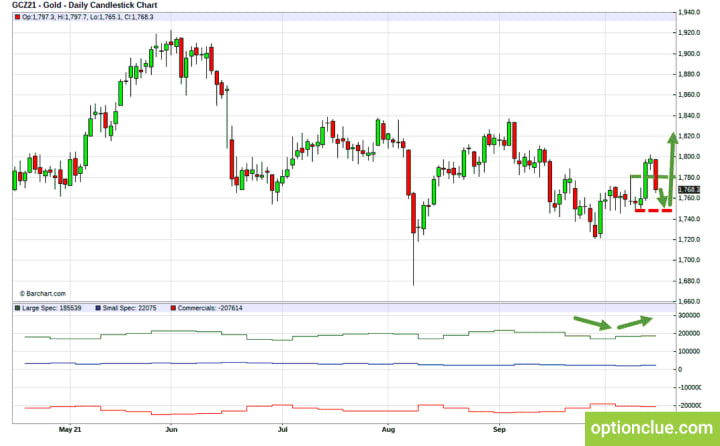
Gold (XAUUSD)
The resistance level was broken on the Daily timeframe on Wednesday, the trend is bullish now and the correction wave develops. A pullback buying opportunity will appear after the correction completion on the Daily timeframe. Long positions will remain relevant until the market is above the nearest support level on the Daily timeframe, the lows of October 7 – 13.
COT indicator reversed. Large speculators are buying gold and the professionals’ opinion corresponds to the market technical picture.
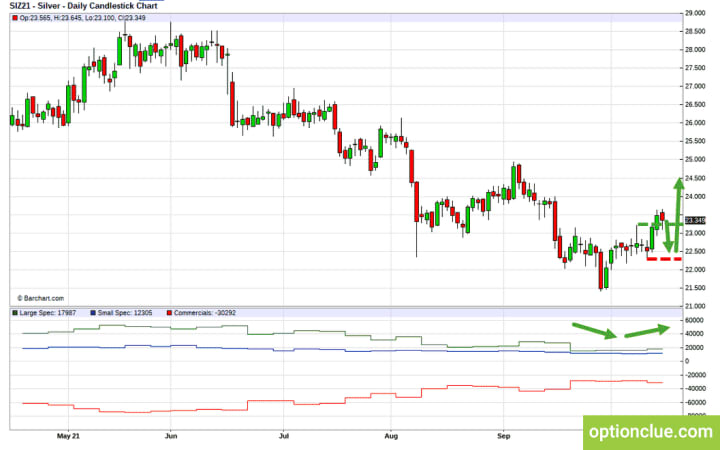
Silver (XAGUSD)
The resistance level was broken on the Daily timeframe on Thursday, the trend is bullish now and the correction wave develops. A pullback buying opportunity will appear after the correction completion on the Daily timeframe. Long positions will remain relevant until the market is above the nearest support level on the Daily timeframe, the lows of October 11 – 13.
COT indicator reversed. At the same time, CFTC reports indicate that large speculators are buying and hedgers are selling and the professionals’ opinion corresponds to the market technical picture.
Australian Dollar (AUDUSD)
The market remains in the bullish trend and the impulse wave develops. A pullback buying opportunity will appear after the correction formation on the Daily timeframe. Long positions (AUDUSD) will remain relevant until the market is above the nearest support level on the Daily timeframe, the lows of October 6 – 7.
COT net position indicator increased but didn’t reverse. Large speculators are selling and hedgers are buying. Professionals’ opinion doesn’t correspond to the Daily trend direction and it makes sense to reduce the position size when an entry point appears in the trend direction.

New Zealand Dollar (NZDUSD)
The resistance level was broken on the Daily timeframe on Thursday, the trend is bullish now and the impulse wave develops. A pullback buying opportunity will appear after the correction formation on the Daily timeframe. Long positions (NZDUSD) will remain relevant until the market is above the nearest support level on the Daily timeframe, the lows of October 5 – 11.
COT indicator increased but didn’t reverse. CFTC reports indicate that large speculators are selling and the professionals’ opinion doesn’t correspond to the market technical picture and it makes sense to reduce the position size when an entry point appears in the trend direction.

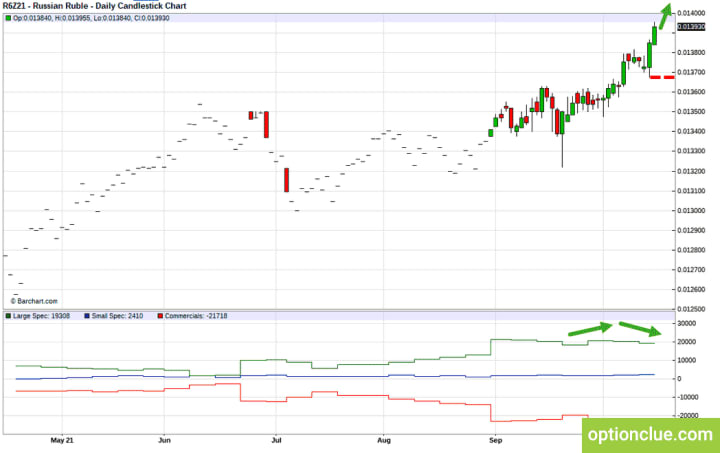
Russian Rouble (USDRUB)
USDRUB currency pair remains in the bearish trend. The correction came to an end last week and the pullback selling opportunity was formed. Short positions (USDRUB) will remain relevant until the market is below the nearest resistance level on the Daily timeframe, the highs of October 11 – 14.
COT indicator reversed. Large speculators are selling rouble and the professionals’ opinion doesn’t correspond to the Daily trend direction and it makes sense to reduce the position size when an entry point appears in the trend direction.
Conclusions
In terms of medium-term trading, financial instruments with the correction close to completion on the Daily timeframe and with potentially the most promising risk-reward ratio are Dollar Index and USDJPY.
In the near future, gold and silver can become noteworthy depending on the market correction depth.
Other financial instruments in the trade list may be also interesting, but in these markets pullback signals on the Daily timeframe are likely to occur no earlier than a week.
More information on the topic:
• The role of support and resistance levels in the trading plan
• Trading tactics. Breakout trading and pullback trading
• How to use CFTC reports in trading. General concepts
• How to use CFTC reports in trading. The logic of large speculators
Good luck in trading!
About the Creator
Keep reading
More stories from Anna Miroshnichenko and writers in Trader and other communities.
Markets weekly overview for October 11-17
We make up a weekly medium-term trade list based on CFTC reports and technical analysis. The overview provides a description of the technical condition of the market on the most popular financial instruments, as well as information on the large speculators’ actions according to the last COT reports and the previous period.
By Anna Miroshnichenko3 years ago in Trader
How to become an Amazon Merch seller!!
In today's digital age, opportunities for creative entrepreneurs to showcase their talents and earn a living abound. One such platform that has gained significant popularity is Amazon Merch, an innovative program that allows individuals to design and sell their own merchandise directly on Amazon. From T-shirts and hoodies to pop sockets and mugs, Amazon Merch offers a wide range of products for creators to showcase their unique designs and reach a global audience.
By Willow Peddy4 days ago in Trader


Comments
There are no comments for this story
Be the first to respond and start the conversation.