
Crypto Markets Analytics for August 9
Crypto Markets Analytics for August 9


We make up a crypto markets overview containing the detailed technical analysis on Bitcoin and top altcoins. The market analysis is performed on the Daily timeframe.
Bitcoin (BTC/USDT)
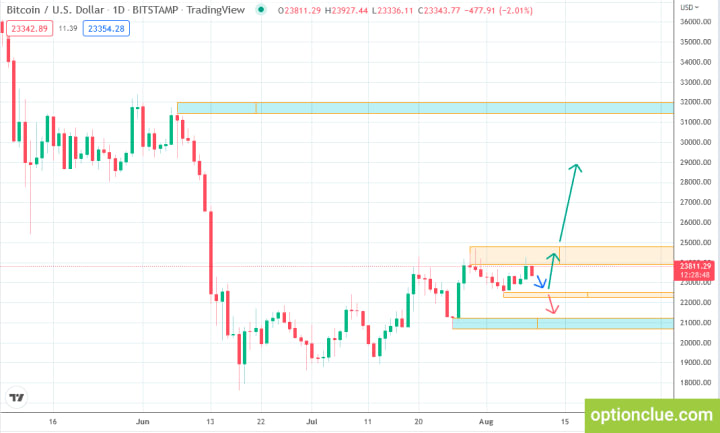
The market is in the uptrend on the Daily timeframe starting from July 19, after breaking through the upper border of the resistance level – $21,955.
The price hit the resistance level yesterday and now we observe the correction in the market.
The borders of this resistance are $24,810 – $23,900. This price zone will be the target for the bullish movement continuation after the correction is finished.
In case of successful development of the trend, a more distant target will be on the highs of June 6 – 8, where the next resistance is located with the borders of $31,965 – $31,400.
Signals to buy will be relevant until the market is above the nearest support level on the Daily timeframe, the lows of August 3 – 5. The borders of this support are $22,254 – $22,512.
Avalanche (AVAX/USDT)
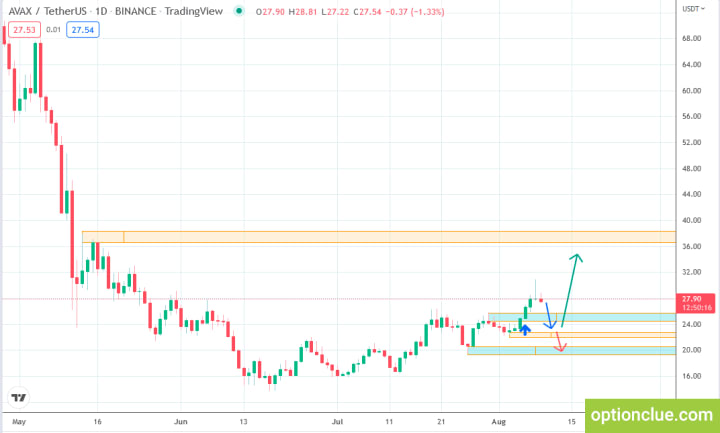
The market remains in the uptrend on the Daily timeframe. Another resistance with the borders of $24.38 – $25.76 was broken on August 6. Now we see the beginning of the correction wave after the bullish impulse formation, but the trend is still bullish on the Daily price chart.
A pullback buying opportunity will appear after the correction completion on the Daily timeframe. The high of the yesterday’s candle may be an intermediate target when the upward movement continues.
If the upward movement develops, the next target will be around the resistance formed on May 13 – 18. This is the price range of $36.54 – $38.38.
Long positions will remain relevant until the market is above the nearest support level on the Daily timeframe, the lows of August 1 – 4. The borders of this support are $21.96 – $22.69.
Binance Coin (BNB/USDT)
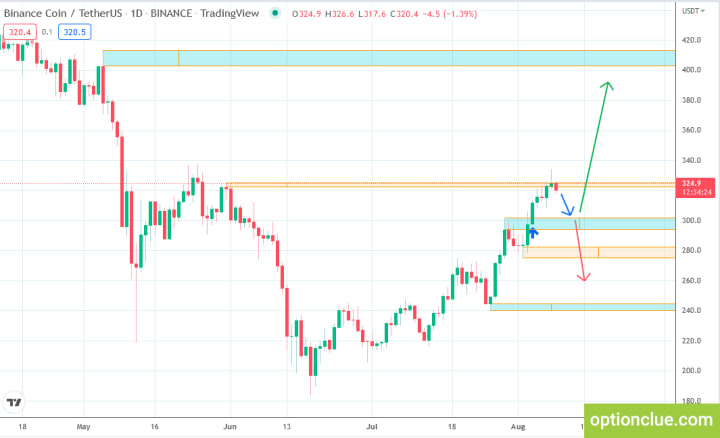
The market is in the uptrend on the Daily timeframe. Yesterday the market hit the resistance level with the borders of $322 – $325. This level was the target in the bullish trend. The market failed to break through this level yesterday and started to correct.
A pullback buying opportunity will appear after the correction completion on the Daily chart.
This correction may form another resistance where the high of August 8 will become its upper border.
When the correction is finished and we see the pullback, this price zone will become the target for the bullish movement.
If the market is closed above this resistance successfully, the price is likely to move forward to the target #2 – it is the resistance level with the borders of $402 – $413 formed on May 4 – 5.
Long positions will remain relevant until the market is above the nearest support level on the Daily timeframe, the lows of July 31 – August 2. The borders of this support are $275 – $282.5.
NEAR (NEAR/USDT)
NEAR is in the bullish trend on the Daily timeframe. Another high of $4.70 was updated on August 5. Now the correction may start in the market.
A pullback buying opportunity will appear after the correction formation on the Daily timeframe. The correction which has just started may form another resistance where the high of August 8 will become its upper border.
The main target for the bullish movement is the resistance level formed on May 30 – June 1. Its borders are $5.96 – $6.22.
Long positions will remain relevant until the market is above the nearest support level on the Daily timeframe, the lows of July 30 – August 3. The borders of this support are $3.95 – $4.18.
When breaking through the support, the movement potential is limited since the next support is slightly below these levels.

Polkadot (DOT/USDT)
The market is in the uptrend on the Daily timeframe. Another high of $9.27 was updated on August 8. And today the correction has started.
A pullback buying opportunity will appear after the correction is finished and a bullish candle is formed on the Daily timeframe. According to the price chart it may happen in a couple of days.
If the upward movement continues, then the price can move towards the main target #2. It is the resistance level formed on May 29 – June 1. This target is around $10.44 – $10.78.
The longs will remain relevant until the market is above the nearest support level on the Daily timeframe, the lows of August 1 – 4.

Bottom Line
In terms of medium-term trading, tokens with the correction close to completion on the Daily timeframe and with potentially the most promising risk-reward ratio are Bitcoin and Polkadot.
Many tokens have already broken the bearish trend and are moving up. Some of them have reached the first targets.
In the near future, many tokens will provide excellent opportunities to enter the market with a huge reward / risk ratio.
We used support and resistance levels for the analysis in this market overview.
FYI. We are building an indicator that will automatically plot key levels on all timeframes on all popular tokens..
About the Creator
Keep reading
More stories from Anna Miroshnichenko and writers in Trader and other communities.
Markets Weekly Overview for August 8 - 14
We make up a weekly medium-term trade list based on CFTC reports and technical analysis. The overview provides a description of the technical condition of the market on the most popular financial instruments, as well as information on the large speculators’ actions according to the last COT reports and the previous period.
By Anna Miroshnichenko2 years ago in Trader
The best refrigerators to buy dice now!
In our modern homes, refrigerators are more than just appliances. They have become the guardians of our food, ensuring its freshness and safety. Over the decades, these devices have undergone remarkable evolution, both in terms of functionality and design, to meet the changing needs of consumers and technological advances. Today, we are witnessing the emergence of innovative refrigerators, such as the «GEDTECH High Freezer Refrigerator - GE217DPSL Silver - capacity 217L - Class E [Energy Class E]» offering generous capacity and optimized energy efficiency, the “CHIQ CBM159LEBD Low Frost 157 Litre (109 + 48) Freezer Refrigerator, Low Noise, Fast Cooling, Small Footprint. [Energy Class D]”, which stands out for its low noise level and small footprint, as well as the «FRIGELUX Fridge freezer low RC168BE» combining simplicity and performance. These examples illustrate the diversity and innovation that characterizes the refrigerator market today, while highlighting the growing emphasis on energy efficiency and practicality. In this article, we will explore the evolution, different typologies, recent innovations and environmental issues of refrigerators, while taking a look at the future of this essential technology in our homes
By Alicia Lhotellier5 days ago in Trader
Integrated marketing
Integrated Marketing Dispatches( IMC) is a strategic approach that ensures all marketing dispatches are cohesive, harmonious, and work together to support a brand's communication across colorful channels. In moment's dynamic and connected business, where consumers are bombarded with information from multiple sources, IMC has come essential for companies to effectively reach their target followership and achieve their marketing objects. At its core, IMC involves the integration of colorful communication tools, similar as advertising, public relations, direct marketing, deals creation, and digital marketing, to deliver a unified communication to consumers. By coordinating these rudiments, companies can produce a flawless brand experience that resonates with consumers and drives engagement and fidelity. One of the crucial benefits of IMC is that it allows companies to maximize the impact of their marketing sweats by using the strengths of each communication tool. For illustration, while advertising helps make brand mindfulness on a large scale, public relations can enhance credibility and trust by securing positive media content. Meanwhile, direct marketing enables substantiated communication with individual guests, while digital marketing offers precise targeting and real- time engagement openings. also, IMC enables companies to maintain thickness in their messaging across different channels, which is pivotal for erecting brand identity and recognition. harmonious branding helps consumers develop a clear understanding of what a brand stands for and fosters trust and fidelity over time. Whether a consumer encounters a brand's communication on social media, TV, or in- store, they should admit a harmonious communication that reflects the brand's values and positioning. Another advantage of IMC is its capability to produce community among colorful marketing channels, performing in a accretive effect that amplifies the overall impact of the crusade. When different communication tools are strategically integrated, they support each other, creating a more important and memorable brand experience for consumers. For illustration, a company may launch a TV announcement crusade to make mindfulness, rounded by social media elevations to encourage engagement and drive business to the website. By coordinating these sweats, the company can induce lesser brand visibility and engagement than if each channel were used singly. In addition to enhancing brand mindfulness and engagement, IMC also facilitates better dimension and evaluation of marketing effectiveness. By integrating different communication tools, companies can track the performance of each channel and assess how they contribute to overall crusade objects. This allows marketers to optimize their strategies in real- time, allocating coffers to the most effective channels and refining messaging to more reverberate with their target followership. still, enforcing IMC effectively requires careful planning, collaboration, and collaboration across different departments and stakeholders within an association. It involves aligning marketing objects, messaging, and creative means across colorful channels while icing thickness in brand positioning and identity. This frequently requires breaking down silos between departments similar as marketing, advertising, public relations, and deals to foster collaboration and integration. also, with the rapid-fire elaboration of technology and the proliferation of new communication channels, the geography of IMC is constantly evolving. Companies must stay nimble and acclimatize their strategies to influence arising trends and technologies to stay applicable and competitive. From social media and influencer marketing to immersive gests and stoked reality, there are endless openings for brands to engage with consumers in innovative ways and produce memorable brand gests . In conclusion, Integrated Marketing Dispatches is a strategic approach that integrates colorful communication tools to deliver a cohesive and harmonious brand communication across multiple channels. By coordinating sweats across advertising, public relations, direct marketing, deals creation, and digital marketing, companies can maximize the impact of their marketing sweats, enhance brand mindfulness and engagement, and drive business results. still, successful perpetration requires careful planning, collaboration, and adaption to evolving consumer trends and technologies.
By vinoth kumar3 days ago in Trader
The Longest Minute
A minute. Sixty seconds to say goodbye. That’s all the time that I had left with him as the needle slid into his leg. I stared into his drooping eyes, looked at the blood-tainted saliva dripping from the corner of his mouth. They said that this was the best thing that we could do for him, a last kind act for a best friend…but if that were the case, then why did my heart feel so heavy?
By Stephanie Hoogstad6 days ago in Fiction


Comments
There are no comments for this story
Be the first to respond and start the conversation.