

Hello,
Welcome to this analysis about Bitcoin and the daily timeframe perspectives. Bitcoin in recent times has moved into a pivotal determination zone from where further developments will show its upcoming destinies. In this case, we need to see the changing dynamics in Bitcoins fundamental landscape as on the one side technological developments are moving forward while new regulatory movements are set in the such as the U.S. as well as the E.U. implementing a regulatory framework that is looking for several diverging developments to be implemented in Bitcoin and Cryptocurrency as an asset-class. On a more Long-Term-Perspective these establishments are likely to have an increased positive impact as Bitcoin and Cryptocurrency are becoming increasingly mainstream however on the more Middle-Term-Perspectives it is also of high importance to look at the technical factors as well. Therefore I detected the major formation Bitcoin is forming here and what we can derive from it for the upcoming destinies.
Determining Developments:
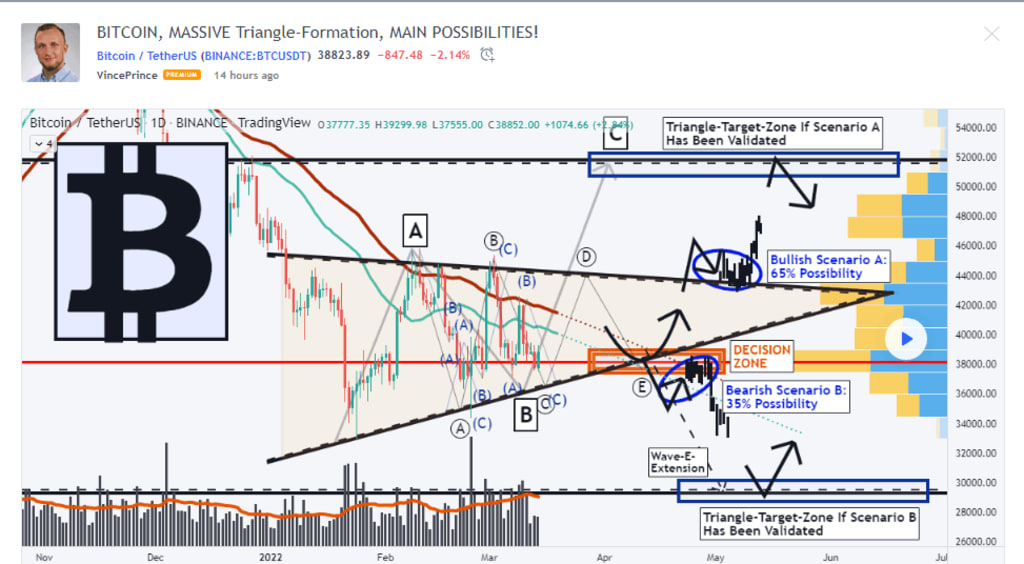
As when looking at my chart now we can watch there how Bitcoin moved into a huge range between 33.000 and 46.000 USD level, these two levels are the momentous boundaries in this whole range. Besides that Bitcoin is now building this paramount triangle formation where the lower boundary is steeper than the upper boundary. Within this triangle formation Bitcoin has the coherent wave-count with the waves A to C almost completed and now we can see that Bitcoin is setting up to form the wave D and the wave E. In the upcoming times, with the completion of the wave count, it is likely that the wave E finalizes within the main Decision-Zone marked in my chart in orange, from this level the final decisive movements will setup and Bitcoin will either conclude scenario A with breaking out above the Upper-Boundary as seen in my chart or the scenario B with breaking out below the lower boundary and also below the Decision-Zone.
Upcoming Destinies:
Taking all these factors into the consideration now it will be highly pivotal to await the final confirmations before moving to further conclusions. Nevertheless, as the factors are showing us now the bullish scenario A has with 65% a higher possibility to emerge than the bearish scenario with a possibility of 35%. This is given due to the fact that Bitcoin still has substantial support within the Point-Of-Control marked with the red line in my chart and also by past price action. Therefore when the scenario finalizes it will activate the upper Target-Zone as shown in my chart between the 50.700 and the 52.200 USD level. The objected possibilities can also change if Bitcoin shows up with increased bearish pressure and volume while completing the wave-count and in this case when Bitcoin does so and scenario B gets more likely the range between 29.700 and 30.200 USD will be activated as the Target-Zone if Bitcoin should complete the Triangle into this direction.
The SPX, Relief-Rally Incoming, Resistance Remains Present!
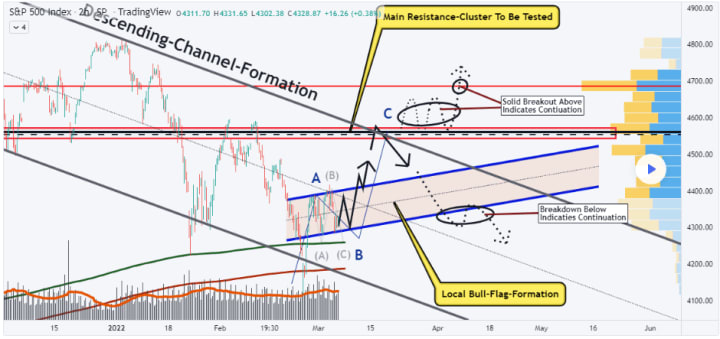
Welcome to this analysis about the S&P 500 Index and the 2-hour timeframe perspectives. Recently the index managed to bounce initially in the structure in the 1400-EMA marked in red in my chart and is forming this main bull-flag-formation in the structure marked in blue from where an initial relief rally is now positive as the FED also firstly stopped with increasing interest rates. When the Index the next time manages to breakout out of the bull-flag-formation above the upper boundary this will setup the further impulse into the upper boundary nevertheless the index in this case still has a strong resistance-cluster marked in my chart where several crucial resistances are coming together. Paired with this remaining resistance and the FED potentially taking up increasing the interest rates again as well as decreasing the massive balance sheet this can lead to a pivotal pullback and in this case it will be highly decisive on how the Index reacts to the remaining resistance. If the index pulls back heavily off the resistance this can lead to a bearish continuation to the downside otherwise when the Index manages to remain in the structure and build up above the bull flag this can potentially also indicate a breakout above the upper boundary of the channel, for now it is necessary to await these major developments before moving to further conclusions.
About the Creator
ADEEL KHAN
am a Writer
Keep reading
More stories from ADEEL KHAN and writers in Trader and other communities.
Stardew Valley
INTRODUCTION: Stardew Valley is a free-to-play country-life role-playing game! You've inherited your grandfather's old Stardew Valley agricultural land. You Are set out to start your new life with some hand-me-down tools and a few coins. Can you learn to fend for yourself and convert these overgrown fields into a thriving home? It won't be simple. The ancient customs of life have all but vanished since the Joja Corporation arrived in town. The community centre, which was formerly the town's most dynamic centre of activity, is now in ruins. However, the valley appears to be ripe with possibilities. With a little hard work, you may be the one to bring Stardew Valley back to its former glory!
By ADEEL KHAN2 years ago in Gamers
Choose an extremely standard jacket for short people
1. Advantages of long coats Great advantages Long coats are often used in winter to keep the body warm. Furthermore, it also hides the shortcomings of wide hips, a not-so-slim bust… Moreover, it also creates a gentle personality for women.
By THAI PHUNG4 days ago in Trader


Comments
There are no comments for this story
Be the first to respond and start the conversation.