
Best MACD Trading Strategy with over 85% Win Rate
Investing Strategies

In the bustling world of trading, I had always been on the lookout for strategies that could offer a significant edge. One day, while browsing through trading forums and watching numerous videos, I stumbled upon a MACD strategy that promised a high win rate. Skeptical but intrigued, I decided to delve deeper.
The Magic of the MACD Strategy
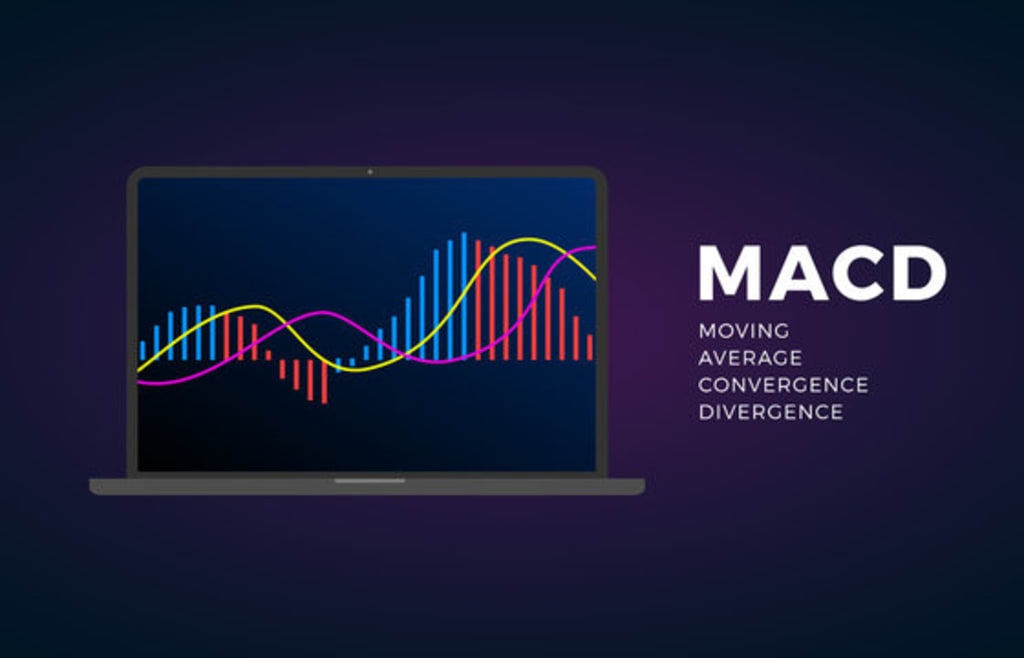
The Moving Average Convergence Divergence (MACD) indicator is widely recognized among traders for its ability to identify trends. It consists of four main components: the MACD line, the signal line, the histogram, and the zero line. The MACD line, typically a 12-day moving average, and the signal line, a 26-day moving average, help to spot potential trend changes. The histogram visualizes the difference between these two lines, while the zero line acts as the central baseline.
To begin, I added the MACD indicator to my trading chart. The MACD line crossing above the signal line indicated upward momentum, while crossing below suggested downward momentum. The histogram’s size reflected the strength of these movements, growing larger as the difference between the MACD and signal lines increased.
However, using the MACD indicator alone proved insufficient. While it excelled in trending markets, it often faltered during sideways movements, signaling false entries. To overcome this limitation, I needed to incorporate additional tools.
Adding the 200-Day Moving Average
The first enhancement was the 200-day moving average. This long-term trend indicator provided a clearer picture of the market’s overall direction. If the price was above the 200-day moving average, it signaled an uptrend; if below, a downtrend.
By combining the MACD with the 200-day moving average, I refined my strategy: I would only enter long trades when the MACD lines crossed below the zero line, and the price was above the 200-day moving average. Conversely, for short trades, the MACD lines needed to cross above the zero line, with the price below the 200-day moving average. This ensured I traded in alignment with the broader market trend, significantly improving my odds.
Integrating Price Action with Support and Resistance
Despite the improvements, I noticed the strategy still generated false signals in sideways markets. To address this, I decided to incorporate price action techniques, focusing on key support and resistance levels where prices typically reversed.
I began by identifying key support and resistance zones on my chart, where the price had previously bounced or reversed. For instance, if the price had repeatedly hit a certain level and bounced back, it marked a strong support. I then waited for the price to return to these levels.
Once the price approached a key support level, I would watch for the MACD lines to cross below the zero line, signaling a potential upward bounce. Conversely, at a resistance level, I waited for a downward cross above the zero line. This combination ensured I only traded at significant price points, filtering out false signals in low-momentum, sideways markets.
Putting It All Together
With my enhanced strategy, I felt ready to put it to the test. Here’s how it worked in practice:
- Identify the Trend: Using the 200-day moving average, I determined the overall market trend. I only considered long trades if the price was above this line and short trades if below.
- Wait for MACD Signals: I monitored the MACD for crossover signals below the zero line for long trades and above it for short trades. This indicated potential momentum shifts.
- Confirm with Price Action: I watched for the price to approach identified support or resistance levels. Only when the MACD confirmed these levels with a crossover did I enter a trade.
- Set Stop Loss and Take Profit: For added safety, I set my stop loss just beyond the 200-day moving average, using it as a protective barrier. My take profit was set at 1.5 times the risk, ensuring a favorable risk-reward ratio.
A Practical Example
One day, while trading a popular stock, the price was comfortably above the 200-day moving average, indicating an uptrend. I identified a strong support level where the price had previously bounced. As the price approached this level again, the MACD lines crossed below the zero line, signaling a potential upward move.
Confident in my setup, I entered a long trade, placing my stop loss just below the 200-day moving average. The trade played out perfectly; the price bounced off the support, and I exited with a tidy profit as it climbed higher, achieving my 1.5 profit target.
Conclusion
This refined MACD strategy, combined with the 200-day moving average and key price action levels, transformed my trading approach. It allowed me to capitalize on strong trends while filtering out false signals in sideways markets.
The journey of discovering and perfecting this strategy was a reminder that successful trading requires continuous learning and adaptation. If you're looking to enhance your trading skills, I highly recommend giving this MACD strategy a try.
About the Creator
Dave Karpinsky, PhD, MBA
A world traveler, educator, consultant, entrepreneur, husband and a father sharing his experience and wisdom. Join me as I weave my narrative, offering a window into a life lived fully and passionately. Please subscribe :-)
Enjoyed the story? Support the Creator.
Subscribe for free to receive all their stories in your feed. You could also pledge your support or give them a one-off tip, letting them know you appreciate their work.
Keep reading
More stories from Dave Karpinsky, PhD, MBA and writers in Trader and other communities.
Ten Best Trading Indicators after 10 years of Trading
Creating an effective trading strategy involves more than just picking stocks or reading charts; it requires the right tools and indicators to make informed decisions. Here’s a story about my journey to discover the 10 best stock indicators that have proven to be invaluable in trading.
By Dave Karpinsky, PhD, MBA3 days ago in Trader


Comments
There are no comments for this story
Be the first to respond and start the conversation.