
Beginner’s Guide to Non-Repainting TradingView Indicators
I lost $4,200 in a single afternoon because I trusted a 'perfect' signal that didn't actually exist. Stop falling for the visual smoke and mirrors of repainting indicators and start trading with reality.

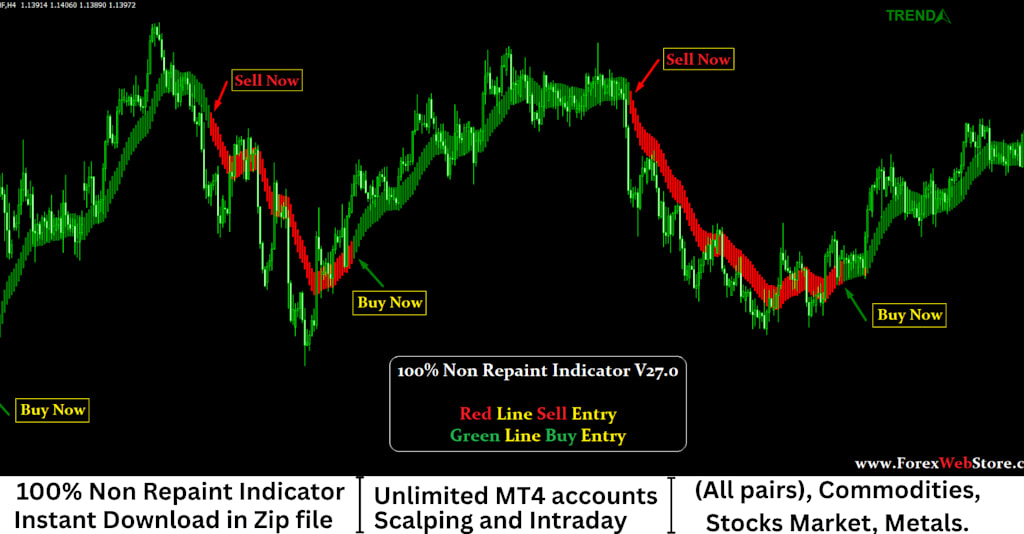
The Brutal Truth About TradingView Indicators: Why Your 'Winning' Strategy Is Probably a Lie
I lost $4,200 in a single afternoon because I trusted a 'perfect' signal that didn't actually exist. Stop falling for the visual smoke and mirrors of repainting indicators and start trading with reality.
The Day I Realized My Charts Were Gaslighting Me
I remember that Tuesday vividly. The coffee was stale, the room was dim, and my screen was glowing with the most beautiful buy signal I had ever seen. A bright green arrow sat perfectly at the bottom of a wick. It was the Holy Grail. I went in heavy. I’m talking 'risk the rent' heavy. Ten minutes later, the price tanked. I looked back at the chart, confused. The green arrow was gone. It hadn't just moved; it had vanished into thin air, leaving me holding a bag of worthless pips and a bruised ego. That was my introduction to the world of repainting.
If you’ve spent any time on TradingView, you’ve likely seen them. The '90% Win Rate' scripts that look flawless on a historical chart. They catch every bottom and nail every top. But here’s the kicker: they’re cheating. They’re looking into the future, waiting for the price to move, and then retroactively placing the signal where it should have been. It’s visual fraud. And for a beginner, it’s the quickest way to blow an account.
Understanding the 'Lookahead' Trap in Technical Analysis
Let’s get technical for a second, but I’ll keep it raw. Most of these scammers use something in Pine Script called 'lookahead.' It’s a function that allows the indicator to check what happened on the next candle before deciding to show a signal on the current one. Imagine playing a hand of poker where you get to see the river card before you decide to fold or bet on the flop. Of course your 'history' looks good. You knew the outcome.
But real trading happens in the now. You don't get the luxury of knowing what the 4:00 PM candle looks like when it's only 3:45 PM. Non-repainting TradingView indicators are different. They print a signal, and once that candle closes, that signal is locked in stone. If it was wrong, it stays wrong. It’s honest. It’s ugly. And it’s exactly what you need to actually survive this market.
How to Spot a Fake Signal From a Mile Away
So, how do you protect your capital? First, stop looking at screenshots. Anyone can cherry-pick a chart. Instead, you need to use the 'Bar Replay' tool on TradingView. This is your best friend. Load the indicator, hit replay, and watch how it behaves as the candles form. If signals appear, disappear, or jump from one candle to another, it’s a repainter. Toss it in the bin.
Another red flag? Check the source code if it's open. If you see keywords like request.security with lookahead=barmerge.lookahead_on, run. That script is essentially a time traveler, and unless you have a DeLorean, you can’t trade its signals in real-time. We need reliable day trading strategies, not fairy tales.
Why Lag Is Better Than Lies
Most beginners hate lag. They want the signal at the exact moment the price turns. But here’s the truth: all honest indicators lag. They have to. They are mathematical derivatives of price and volume. They need data to form a conclusion.
When you use a non-repainting buy sell indicator, you might enter a few pips later than the 'perfect' entry, but you’re entering based on confirmed data. I’d rather be late to a real party than early to a heist where I’m the victim. Acceptance of lag is the first sign of a maturing trader. It means you’ve stopped chasing ghosts and started respecting the math.
The Psychological Toll of 'Perfect' Backtests
There’s a hidden danger to these repainting scripts: they destroy your confidence. You see a script that works 10/10 times in the past. You try to trade it live and lose five times in a row. You start thinking you are the problem. You think you’re clicking too slow or your internet is bad. No. The script is lying to you. This cycle leads to 'revenge trading' and eventually, quitting altogether.
I’ve seen brilliant people walk away from the financial markets because they were measuring their performance against a baseline that literally didn't exist. Don't let a poorly coded script gaslight you into thinking you're a bad trader. The market is hard enough without your own tools working against you.
Building a Strategy with Non-Repainting Tools
So, what does a real setup look like? It’s usually a combination of things. You want a TradingView strategy that uses price action first, then confirms with an indicator. Maybe it's a Volume Weighted Average Price (VWAP) combined with a solid RSI or a well-coded MACD. These are the workhorses of the industry because they don't change their mind.
Think about it. A moving average doesn't suddenly decide it didn't cross over yesterday just because the price dropped today. It stays put. That consistency allows you to gather real data. It allows you to calculate a real 'Expectancy.' If you know your strategy wins 60% of the time over 100 trades, you can manage your risk. You can’t manage risk on a signal that might vanish if the wind blows the wrong way.
Steps to Verifying Your Indicators
The Bar Replay Litmus Test: Always watch the indicator live or in replay mode for at least 50 candles.Check the 'Closed' Status: Ensure the indicator logic only triggers on barstate.isconfirmed. This ensures the candle is finished before the signal is final.Diversify Your Confirmation: Never rely on a single arrow. Use horizontal support and resistance levels to filter your forex trading signals.
The Path Forward: Trading with Your Eyes Open
Trading is a profession of probabilities, not certainties. The moment you look for a 'perfect' indicator, you’ve already lost. You’ve opened the door for scammers to sell you repainting junk.
Instead, look for tools that give you an edge—a slight statistical advantage. It won’t look as pretty on the chart. There will be red 'Loss' labels. But those red labels are your best teachers. They show you where the market didn't respect the pattern, allowing you to tighten your stop loss and protect your bankroll.
Stop chasing the green arrows that disappear. Start looking for the data that stays. It’s less flashy, but it’s the only way to build a career in this game. You don't need a magic wand; you need a compass. And a compass that changes North every time you turn your head isn't a tool—it's a trap. Stick to non-repainting indicators, trust your backtesting, and for heaven's sake, keep your position size sane while you learn the ropes.
About the Creator
Pooja Verma
Forexwebstore.com Discover the Best Forex Indicators for a Simple Strateg. This page features key technical indicators for the most popular currency pairs in real time.
Enjoyed the story? Support the Creator.
Subscribe for free to receive all their stories in your feed.
Comments
There are no comments for this story
Be the first to respond and start the conversation.