
Google Shopping Ads Market Analysis for Sports & Outdoor
Find the latest trends in Market especially Sports & Outdoor Category for Google Shopping Ads.


Sports & Outdoor Market has always been extremely competitive especially when SERP, Shopping, or even SEO is compared. This market analysis was conducted to take a closer look into trends and competition on Google Shopping.
For this analysis, around 300K ads from 3K+ advertisers/sellers were collected on 805 highly competitive broad-match-type opportunity keywords for the “Sports & Outdoors” category in January 2021 using Search Intelligence tool. The product information like advertiser name, brand, price, region, rank, annotations, labels, etc. was gathered to analyze the ad’s performance on Google Shopping during the month.
Analyzing the ad coverage on devices, the data showed that 24% of the ads were seen on desktops and 76% of ads were seen on mobile devices. This provides more areas of opportunity for retailers to improve the visibility of ads on desktops. Also, looking into ads distribution type 99% of ads were PLAs and only 1% of ads were Showcase ads. Retailers can focus more on improving their presence for Showcase Ads.
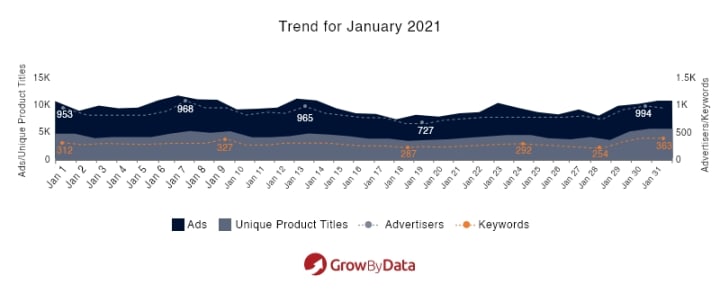
Ads Trend for January
The Advertising Monitoring Software collected the ads data from 4 different regions – East, Midwest, Southwest, and Northwest from January 1st to January 31st, 2021. As you can see from the trend graph below, the number of ads seen fluctuated quite a bit during the month. Typically, the ads increased close to the weekend (Thursday, Friday) and then went lower after the weekends.
Total Ads: 299,858 Total Advertisers: 3,071 Number of keywords: 805 Ad Titles: 31,862
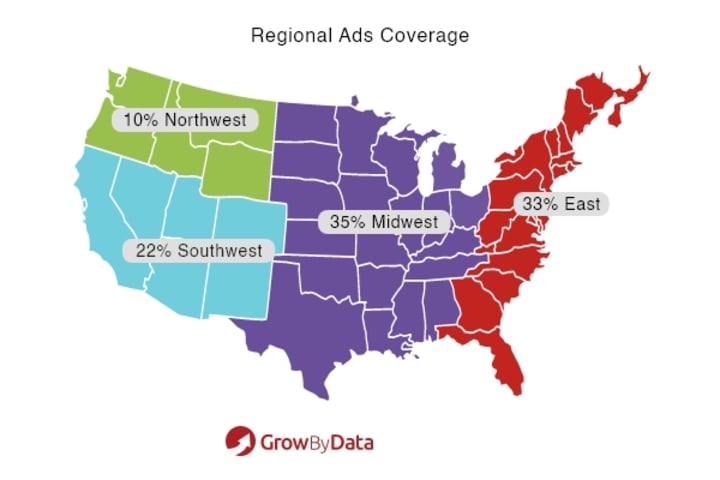
Regional distribution of Ads
Performing the Regional Analysis, the Midwest region had the highest ad visibility (35%) followed by the East region (33%), and the Southwest region (22%). The Northwest region had the least ad visibility (10%). Having greater ad visibility in a certain region helps in increasing the ad impressions for that region. It also means that there may be an opportunity for advertisers to work on ways of increasing ad visibility in other regions.
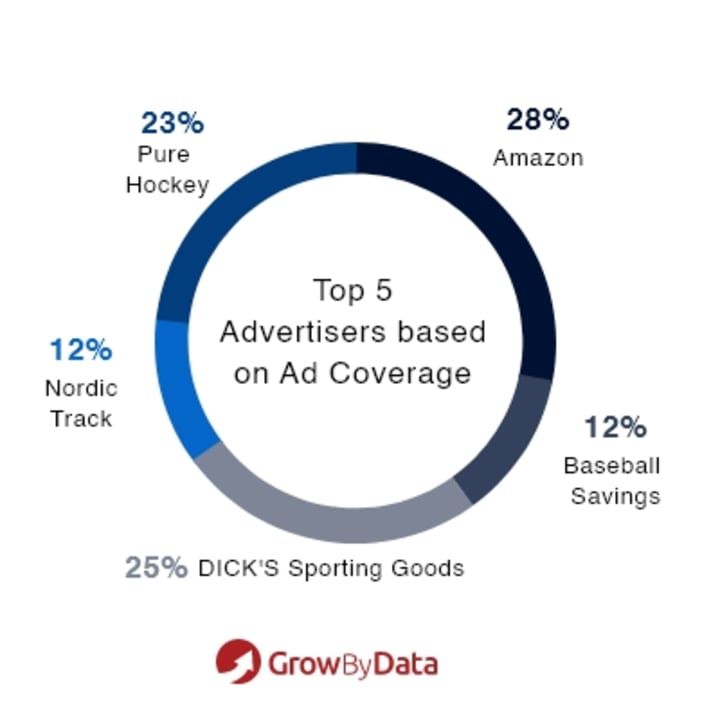
Top 5 Advertisers based on Ad Coverage
The graph below shows the top 5 advertisers based on the total ad coverage in the category. Among the top 5 advertisers, Amazon.com had the highest ad coverage (28%) followed by DICK’S Sporting Goods (25%), Pure Hockey (23%), Baseball Savings (12%), and NordicTrack (12%). You can see that Baseball Savings.com and NordicTrack have a lot more opportunities to improve to gain more coverage in the category.
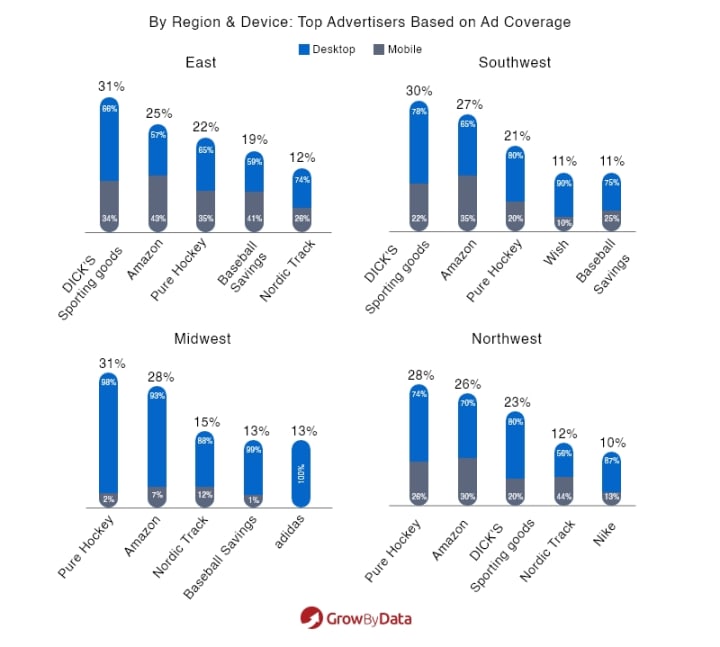
Per Region: Top 5 Advertisers based on Ad Coverage
Looking into the top 5 advertisers in each region, the data showed advertisers like Amazon.com and Pure Hockey were placed in the top 5 list in all 4 regions with Pure Hockey having the highest ad coverage in 2 of the regions. From the graph below, you can see that Wish and Nike are in the top 5 in only one region each which provides them plenty of space for improvement in that region. It also means that they have growth opportunities in other regions as well.
The graph below also shows ad coverage of advertisers based on the devices from each of the 4 regions. The data showed that the East region had a higher percentage of their ads seen on desktops and the Southwest region had a higher percentage of their ads seen on mobile devices.
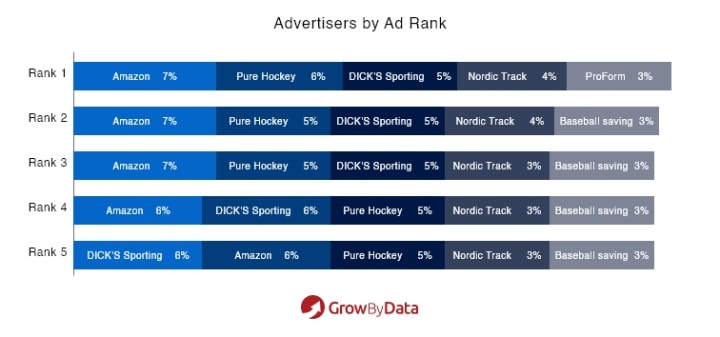
Advertisers by Ad Rank
The top 5 advertisers based on the highest percentage of ads they have at each rank in the Sports & Outdoor category is shown in the graph below. Amazon.com had the highest percentage (over 30%) of their ads showing up in the top 5 ranks while ProForm was able to occupy only 3 % of ads only in the top 5.
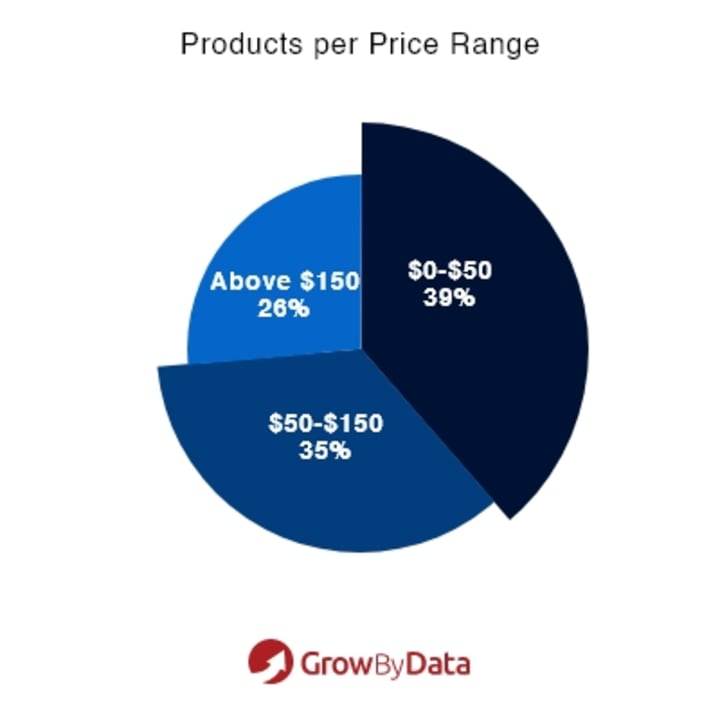
Products per Price Range
Analyzing the products per price range, the highest percentage of products were in the $0-$50 price range, followed by the $50-$100 price range. The Above $150 price range had the least number of products. Retailers can use this information to make decisions on which range (price) of products they should advertise to increase visibility on Google Shopping.
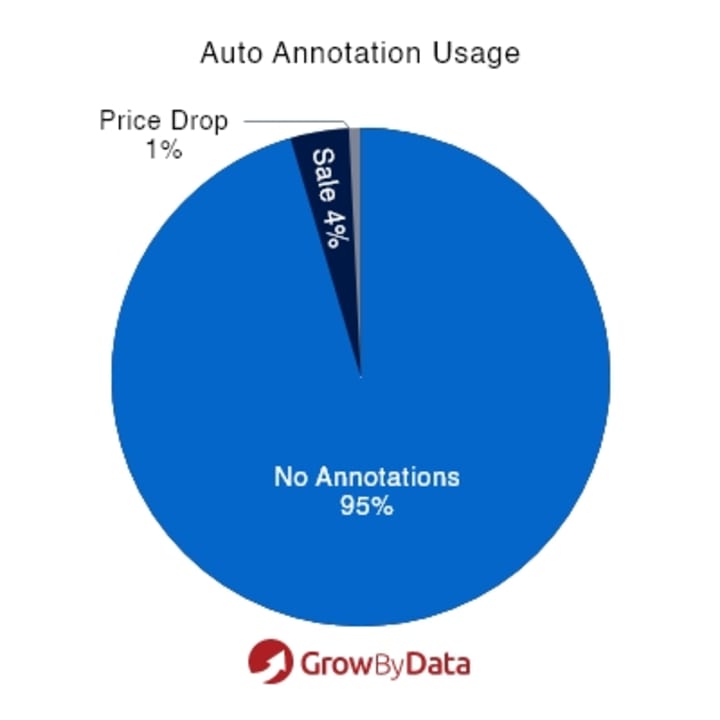
Use of Auto Annotations
The ads for this category used auto annotations such as ‘sale’ and ‘price drop’. Around 95% of the ads did not have any annotations. 1% of the ads had the ‘price drop’ annotation and 4% of the ads had the ‘sale’ annotation. Retailers can use these auto-generated Google Shopping annotations on ads to stand out on the ad auction.
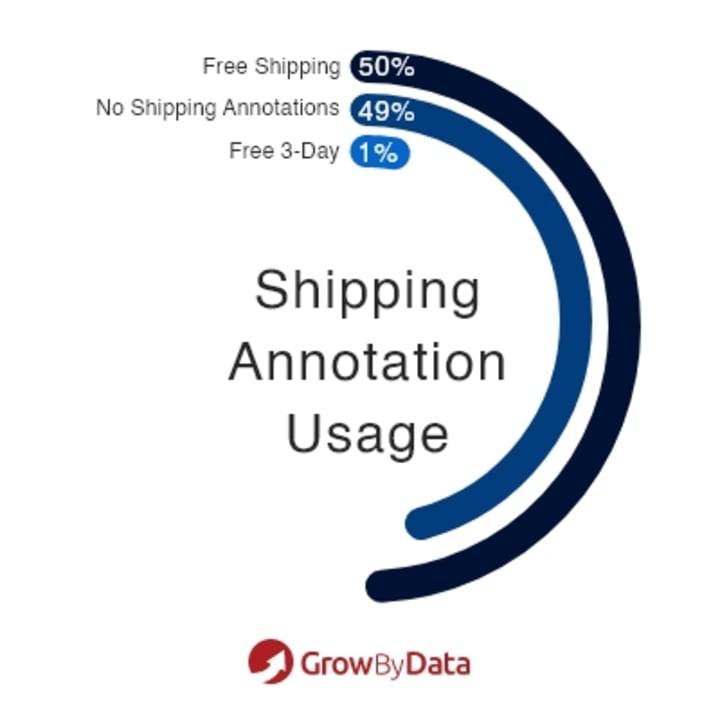
Use of Shipping Annotations
Looking at the data on the use of shipping annotations; over 50% of the ads had shipping annotations and 49% of the ads had no shipping annotation on them. ‘Free Shipping’ was the most popular option. Retailers can make the shopping experience a convenient one by utilizing “free shipping” annotations.
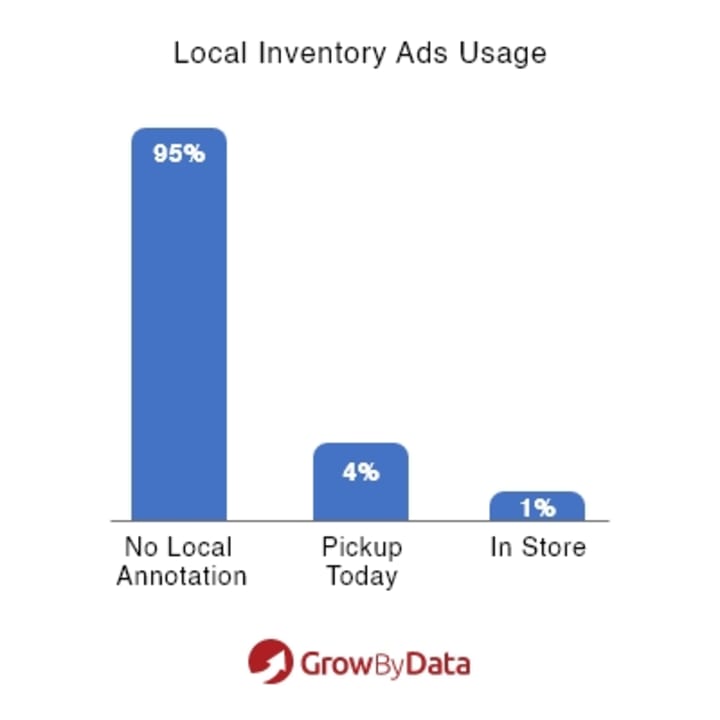
Use of Local Inventory Ads
In terms of Local Inventory Ads, Tags such as ‘Pickup Today’ were available on 4% of the ads and tags like ‘In-Store’ were available on 1% of the ads during this period. 95% of the ads had no local inventory annotations. This can be a good opportunity for retailers to improve their ad impressions from local and nearby consumers as very few ads were found with inventory tags.
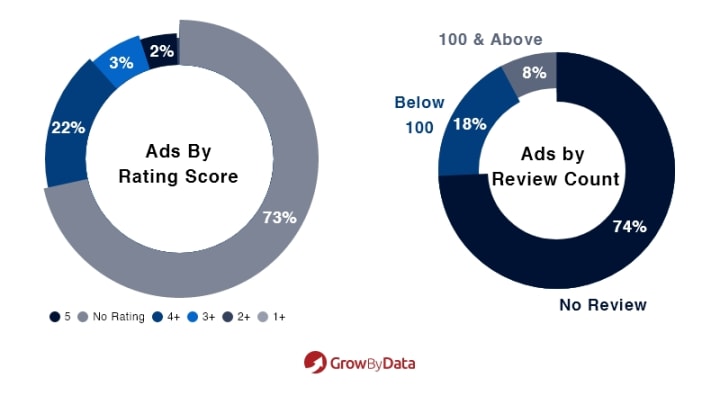
Use of Ratings and Reviews
Further analyzing the contents of the ads, data showed 22% of the ads had a rating score of more than 4, 3% of ads had a rating score of more than 3, and 2% of ads had a rating score of 5. The data also showed that 8% of the ads had a review count of more than 100 and 18% of the ads had a review count of less than 100 on Google Shopping for the Sports & Outdoor category.
Conclusion
These data were collected using Competitive Marketing Intelligence Software. The above graphs show the overall trends of Ads in Google Shopping, top advertisers, types of ads, and their visibility in the Sports & Outdoor category. Amazon and Pure Hockey can be considered as TOP ADVERTISERS for the Sports & Outdoor Category acquiring the largest percentage of ads during the month. Doing a Market analysis of Google Shopping Ads can be beneficial for Retailers and Brands to know more about their status against the competition and create their strategy afterward. Some of the findings are collected using GrowByData search monitoring software.
About the Creator
Prasanna Dhungel
Managing Partner GrowByData - Marketing Intelligence for Brands & Agencies to Boost Performance
Keep reading
More stories from Prasanna Dhungel and writers in Journal and other communities.
3 Reasons Brands Must Monitor Google Shopping
Google Shopping is an e-commerce channel which is growing exponentially. About 92.6% of search traffic goes to Google and retailers are pushing to get listed and maximize clicks from the channel. With this in mind, below are 3 reasons why brands must monitor Google Shopping to maximize opportunities.
By Prasanna Dhungel3 years ago in Journal
Another Factor That Separates Sages From Masters
Read to the End to Help "Change The World" with our Earth Week Impact Launch Initiative! --- In my article The 8 Stages to a Quality Career, I detailed each of the steps one must go through to advance to the highest levels in any Industry.
By Cody Dakota Wooten, C.B.C.7 days ago in Journal
Symptoms, Causes and Treatment of Congestive Heart Failure
Congestive heart failure is one of the significant causes of death in Indian people nowadays. The report showed that 10 million Indians, especially senior citizens and males are facing this health issue mostly.
By ILS Hospital7 days ago in Journal
Final Call
She flings her arms around my neck and squeezes me like she’s never going to let me go. My head spins as her lips brush against my cheek. She must be able to feel my heart thumping in my chest. I shuffle backwards and ram my hands into my coat pockets, watching her reach down and heave the rucksack across her shoulders.
By Caroline Craven3 days ago in Fiction


Comments
There are no comments for this story
Be the first to respond and start the conversation.