
Detect Google Shopping Ads Movers & Shakers with Search Intel
Google Shopping is an extremely competitive and volatile advertising platform, but it is a very popular choice for online retail customers, especially in the United States. Retailers therefore compete and spend a lot of advertising dollars to get the maximum ad coverage, keyword coverage, and above-the-fold rank coverage.


Google Shopping is an extremely competitive and volatile advertising platform, but it is a very popular choice for online retail customers, especially in the United States. Retailers therefore compete and spend a lot of advertising dollars to get the maximum ad coverage, keyword coverage, and above-the-fold rank coverage. With a real-time bid optimization algorithm in place, retailers can improve their coverages at every hour across the various locations, making the platform very volatile. Thus, monitoring your ads with real-time data is very important to gain an edge against your competitors.
The Search Intelligence tool from GrowByData helps you monitor your ad coverage, and can alert you on your ads’ volatility. The tool gives you Ad Intelligence analytics and reports that help to track your Google shopping ads, as well as your competitors’ ad coverage and changes across multiple regions, devices, and hours. You can track whose ad visibility has improved over time and who is losing visibility. The estimated total search volume of the 1.1K Apparel & Accessories keywords that we have selected for this “movers and shakers” analysis in the USA per Google AdWords Keyword Planner tool, is around 104 Million.
The Importance of a Movers & Shakers Analysis:
As an advertiser, monitoring Ad Coverage change percentages tracks the volatility of your Ads across all regions and devices. Keyword and rank coverage volatility points out fluctuations in your potential market share, suggesting the visibility fluctuation of your various products which might be due to factors like your competitor’s aggressive advertising campaigns (increase bids), lucrative promotion, and competitive prices, displacing your keyword impression and rank. Alongside, it also indicates potential errors and issues within your shopping feeds.
This Search Intelligence Google Shopping Ads movers and shakers report will help you perform a comprehensive ad, keyword, and ad position coverage analysis showing trends, improvements, and optimization areas of your ads campaign, alongside monitoring you versus your competitors’ ads. It can help you drill down to dissect reports on region, device, and keyword level, to find out pinpoint action items to optimize and boost your ad campaign.
Shopping Ads Coverage Analysis of Top 5 Advertisers
Kay Jewelers, SHEIN, Angara.com, Macy’s, and Zales are the top 5 advertisers based on total ads impression count. The graph below shows their percentage change in ad coverage, keyword coverage, and ad position, compared to the previous month.
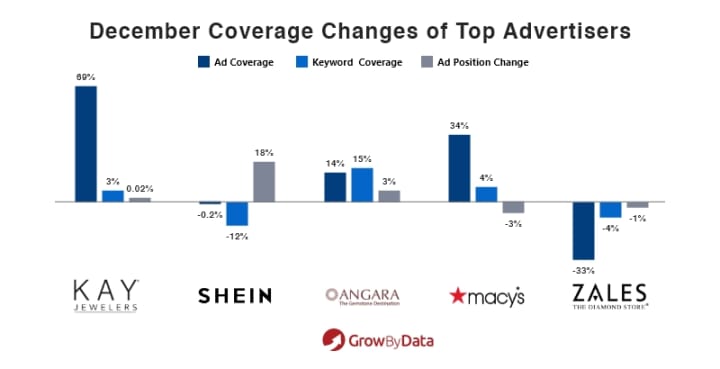
Kay Jewelers saw a 69% increase in their overall ad coverage in December, implying its ad coverage has increased compared to last month. It could also mean that they increased the number of products they were advertising, which can be monitored with the Competitive Marketing Mix Report. They are improving in their keyword coverage as well as a slight uptick in average rank; showing positive performance in this campaign.
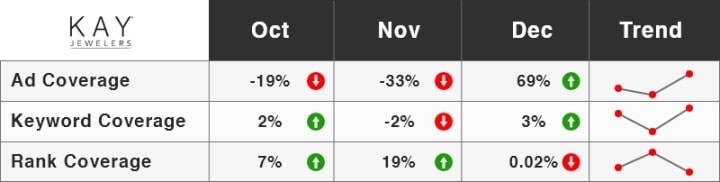
The table below compares Kay Jewelers’ percentage change in ad coverage, keyword coverage, and rank coverage over the last quarter of 2020. It shows that they have been improving their average rank each month, although the improvement in October and November was much better than in December. They were losing ad coverage in October and November but drastically improved it in December. Also, their keyword coverage had been fluctuating monthly (although not by too much).
SHEIN saw the biggest gain in their ad position. If we just looked at the increase in their ad position, the two reasons for this could be that they increased their bids, or they were using more promotions and ad extensions to stand out from their competitors. However, considering they lost 12% ad coverage and 0.2% keyword coverage while gaining average ad position, points to the fact that the loss in coverages may be the reason for the overall ad position increment. The drill-down report to Region, Device, and Keywords could help SHEIN to identity the optimization areas on this campaign.
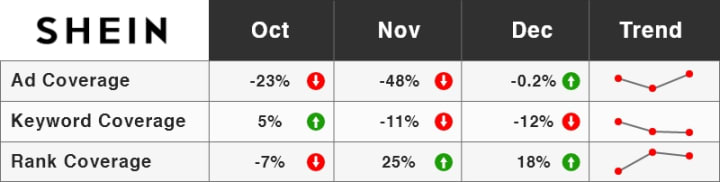
The table below shows the month-to-month changes on the coverages for SHEIN. It shows that SHIEN had been steadily improving its average rank in November and December while losing keyword coverage and ad coverage during the same period.
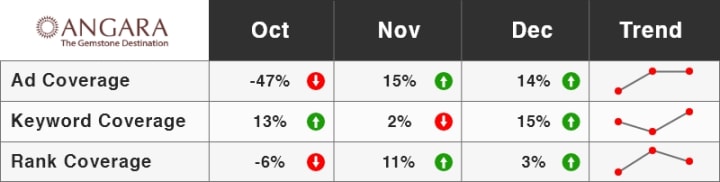
Like Kay Jewelers, Angara.com also had an improvement on all three coverages with a 3% increase in average ad rank, a 14% increase in ad coverage, and a 15% increase in keyword coverage.
The month-to-month analysis table below shows that Angara.com had seen a positive trend on all three coverages in November and December.
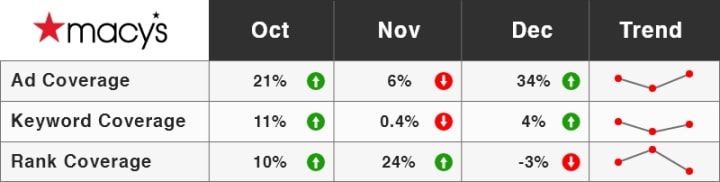
Macy’s ads had seen the second-largest growth in ad coverage behind Kay Jewelers, with a 34% increase in December. Their keyword coverage though had improved by 4% and it had slightly decreased an average ad rank of -3%.
The month-to-month analysis table below implies Macy’s overall ad coverage and keyword coverage across the region and devices had been improving throughout the last quarter of 2020, but they had only lost their average position slightly in December.
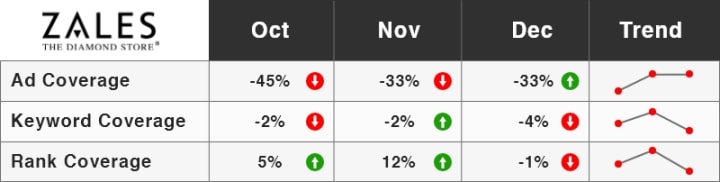
Similarly, Zales’ ads seemed most volatile amongst the top 5, with a -33% decrease in ad coverage, -4% decrease in keyword coverage, and a -1% decrease in rank coverage in December.
Looking at the month-to-month change analysis, they had consistently been losing ad coverage in the last quarter of 2020. This means that their ads had been extremely volatile in terms of showing up on the Google Shopping Ad auction.
Appendix:
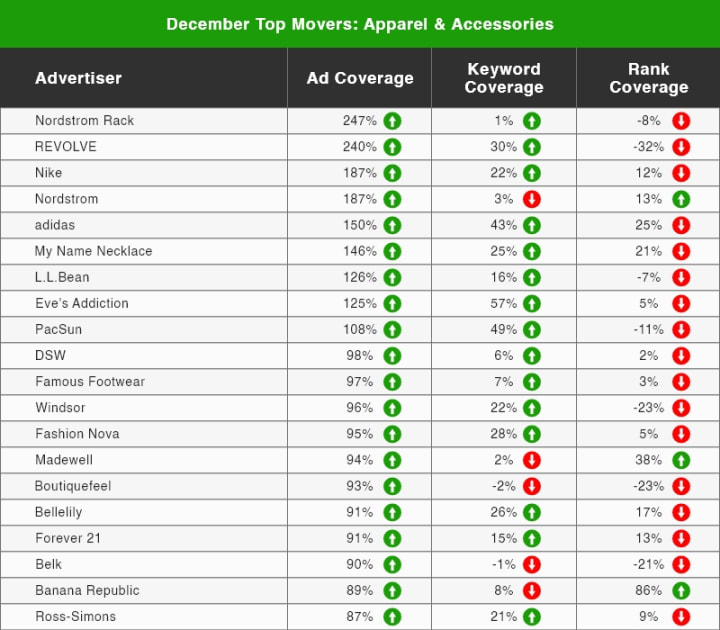
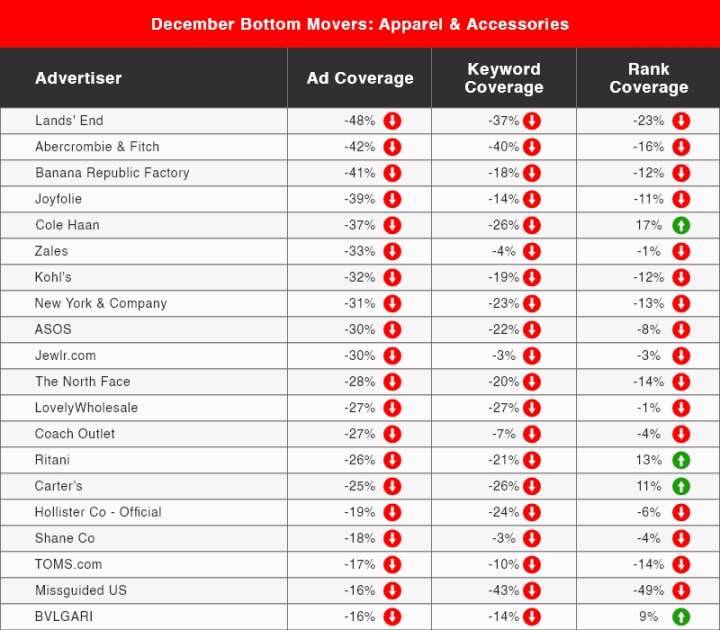
Below are our Top 20 Movers and Top 20 Bottom movers Report for the Apparel & Accessories category for December from our Search Intelligence tool. Please note that the report below considered total percentage change, while the top 5 advertisers above are selected based on the number of ad impressions recorded. Search Intelligence allows you to analyze competitors based on various static and dynamic dimensions like top advertiser by ad impression, region, device & more.
Top Movers Apparel & Accessories:
Bottom Movers Apparel & Accessories:
Originally published at https://growbydata.com on March 21, 2022.
About the Creator
Prasanna Dhungel
Managing Partner GrowByData - Marketing Intelligence for Brands & Agencies to Boost Performance
Keep reading
More stories from Prasanna Dhungel and writers in Journal and other communities.
How to maximize ROAS on Google Shopping ? – Guide to Managers
Google Shopping Ads are a crucial channel for e-commerce stores that drive tons of traffic and sales. This type of ad shows the product image, product title, and price alongside special offers, reviews, and other extensions & annotations that make it easier for a customer to find the right offers they are looking for. Certainly, customers in their messy shopping journey refer to Google to find products they are searching to purchase. Google also gives this important space in their SERP results for this ad type for customer e-commerce related search queries. Around 85% of eCommerce search query ads of this ad type are seen above the fold. Therefore, this ad type is very popular among customers and retailers can expect consistent returns from this ad type. Due to this high level of effectiveness, all online retailers including e-commerce giants like Amazon and Walmart have spent huge dollars on this platform making this a super competitive retail e-commerce advertising option hence difficult to maintain a good average ROAS.
By Prasanna Dhungel2 years ago in Journal
Did We Manifest AI Due to Collective Human Attitudes on Work?
Food for thought indeed. There is a mighty fine line between "AI is taking our jobs" as a downright conspiracy theory, to something that is true and proven in some (if not many) occupations; from cashiers to illustrators, and robotic surgery to name, let alone robot lawyers for real. Furthermore, this article is not designed to create more fear and uncertainty than what is already circulating in the cosmos, but rather to view AI and the world of work from a different perspective.
By Justine Crowley22 days ago in Journal
Vocal Bonus Leaderboard: 04/24/2024
Welcome to the weekly update of the Leaderboard! We're thrilled to showcase Vocal's most discussed stories, popular picks, and rising stars. Let's dive into this past week's standout contributors and their remarkable achievements.
By Vocal Teama day ago in Resources


Comments
There are no comments for this story
Be the first to respond and start the conversation.