
VWAP analysis in share market
Multi time frame VWAP analysis
VVWAP, or Volume Weighted Average Price, is a trading indicator used by traders and investors to determine the average price of a security over a specific period of time, with emphasis placed on the volume of trades made during that period.
VWAP is calculated by adding up the dollar value of all trading periods (i.e. the price multiplied by the number of shares traded) and then dividing by the total shares traded during the period. This helps to identify the true average price of a security, as it takes into account both the price and the volume of trades.
One of the main uses of VWAP is in algorithmic trading, where it can be used as a benchmark for determining the fair value of a security. It can also be used as a reference point for determining the trend of a security, as well as a potential support or resistance level.
Another key use of VWAP is in institutional trading, where it can be used as a benchmark for determining the performance of a portfolio manager. It can also be used as a reference point for determining the trend of a portfolio, as well as a potential support or resistance level for that portfolio.
VWAP is also commonly used by traders and investors to identify potential buy and sell points. For example, if the price of a security is trading below its VWAP, it may be considered a potential buy opportunity, while if the price is trading above its VWAP, it may be considered a potential sell opportunity.
It's important to note that while VWAP can be a useful indicator, it should not be used as the sole basis for making trading or investment decisions. It is always important to consider other factors such as technical analysis, fundamental analysis, and market sentiment when making any trading or investment decisions.
In summary, VWAP is a powerful trading indicator that can be used to determine the average price of a security over a specific period of time, with emphasis placed on the volume of trades made during that period. It can be used as a benchmark for determining the fair value of a security, as well as a reference point for determining the trend of a security or portfolio. It is a very helpful tool for algorithmic trading, institutional trading and for traders and investors to identify potential buy and sell points, however it should always be used in conjunction with other analysis.
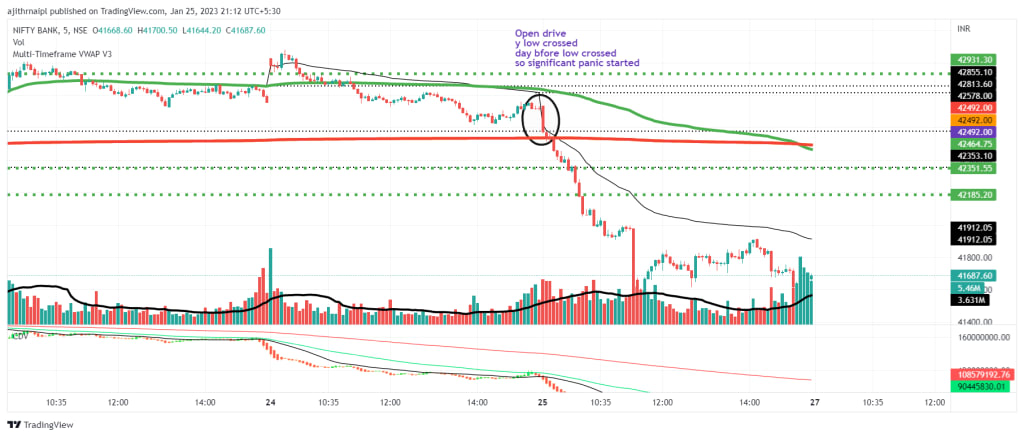
Confluence of Daily, Weekly, Monthly, and Yearly VWAP (Volume Weighted Average Price) is a technique that uses multiple time frame analysis to identify potential entry and exit points in the stock market. It is based on the idea that when the VWAP from different time frames aligns or converge, it can indicate a stronger level of support or resistance and a higher likelihood of a price reversal.
Here is a general guide on how to use confluence of Daily, Weekly, Monthly, and Yearly VWAP:
Calculate the VWAP for each time frame: First, calculate the VWAP for the stock for the daily, weekly, monthly, and yearly time frames. This can be done using a spreadsheet or a technical analysis software that supports VWAP calculations.
Plot the VWAP on a chart: Once the VWAP has been calculated, plot it on a chart for the stock. This will allow you to see how the VWAP has changed over time and identify trends and patterns.
Look for confluence: Look for instances where the VWAP from different time frames aligns or converges. For example, if the daily, weekly, and monthly VWAP are all trending upward, this may indicate a strong level of support and a potential buying opportunity. Conversely, if the daily, weekly, and monthly VWAP are all trending downward, this may indicate a strong level of resistance and a potential selling opportunity.
Use the analysis to make trading decisions: Once you have identified confluence, use the analysis to make trading decisions. For example, if the daily, weekly, monthly, and yearly VWAP are all trending upward, this may indicate a strong buying opportunity. Conversely, if the daily, weekly, monthly, and yearly VWAP are all trending downward, this may indicate a strong selling opportunity.
It is important to note that the confluence of Daily, Weekly, Monthly, and Yearly VWAP is just one of many techniques used to analyze stocks and it should be used in conjunction with other technical
About the Creator
Keep reading
More stories from Devi Ajith and writers in Education and other communities.
Rich Dad Poor Dad
"Rich Dad, Poor Dad" is a personal finance book written by Robert Kiyosaki, which advocates for financial independence through investing in assets such as real estate and small businesses. The book is written in the form of a memoir, with Kiyosaki contrasting the financial advice he received from his "rich dad" (a friend of his father's) with that of his own father, whom he refers to as his "poor dad."
By Devi Ajithabout a year ago in Education
Utilizing Data Science Methods for Optimized A/B Testing
Expanding on the topic of A/B trying out and its integration with facts technological know-how offers an possibility to delve deeper into every issue, offering greater comprehensive insights for readers. Let's make bigger each subsection of the primary body to provide a extra designated knowledge:
By Gour Sinha5 days ago in Education
Genomics technology
Genomics technology has revolutionized the field of biology, medicine, and beyond by allowing scientists to study the entire genetic makeup of organisms. This technology encompasses various techniques and tools aimed at deciphering, analyzing, and manipulating the complete set of genes or the genome of an organism. With advancements in genomics, researchers have gained unprecedented insights into the genetic basis of traits, diseases, evolutionary relationships, and much more.
By Mithun Gain7 days ago in Education
We'z Walking on a Path Ruled By Numbers
This road has felt endless, yet limited; every step tracked. Inching away along this path, I feel trapped. Confined. Left to this narrow passage that may one day amount to something greater. Time is not a concept. Only distance. From start to finish, I laugh and cry and attempt to convince myself that this is worth it. I cannot stray. I must keep going. Every step etched, is a step taken, is measured as more than before. I cannot even recall how I got here. Maybe I don’t even really exist. Just another tick marking off a perceived presence. Of what though? I am just another line drawn. Nothing more, nothing less.
By Oneg In The Arctic3 days ago in Fiction


Comments
There are no comments for this story
Be the first to respond and start the conversation.