
TATA VIRTUAL EXPERIENCE PROGRAM SOLUTIONS
TASK 3 SOLUTIONS

The Tata Group is a global company operating in over 100 countries across six continents, whose mission is 'to improve the lives of the communities we serve around the world, through long-term independent creation enter the value based on Trusted Leaders' 128 billion by 2021 -22 With revenues of $9.6 billion, these companies collectively employ more than 935,000 people. There are 29 publicly listed Tata companies – many are market leaders in their respective industries.
This virtual experience program is available at one of our companies, Tata Insights and Quants or Tata iQ. You will gain insight into how our passionate multidisciplinary experts solve some of the most complex business problems using data visualization solutions, such as Tableau and Power BI and create amazing stories with the data they generate the foothills of the mountains.
The program will show you the problems that are solved on a daily basis at Tata Insights & Quants and will try to simulate the challenges that you will face.
To get in touch with the Tata team for more information, please email [email protected].
TASK 3
Creating Effective Visuals
Apply your under and create visuals based on business scenarios.
In this task, you will create the visuals around four of the questions that the CEO and CMO have requested. You can use either Tableau or Power BI to create the visuals.
Data cleanup
Before you can begin the analysis, make sure that the data is cleaned properly. You have noticed that the data contains some returns to the store which are provided in negative quantities and there are unit prices which were input in error. You will need to perform the following steps to clean this data.
Create a check that the quantity should not be below 1 unit
Create a check that the Unit price should not be below $0
Please note that in order to apply the checks that have been mentioned above, you would need to use conditional formulas where the logic would state that if the conditions are met then the tool should exclude the data from analysis. You can also use data transformation methods to get rid of the bad data. Both these methods are provided in the resources section. Once this is done, the data will be good to be used for further analysis. Please note that this data should be cleaned up before attempting any question.
STEPS FOR DATA CLEANING
In Power Query Editor, click on the table containing the data.
Select the "Add Column" tab.
Create a check that the quantity should not be below 1 unit:
a. Click on "Custom Column" in the Add Column tab.
b. In the formula bar, enter the following formula: if [Quantity] >= 1 then "Valid" else "Invalid".
c. Rename the new column as "Quantity Check".
d. Click OK to create the column.
Create a check that the Unit price should not be below $0:
a. Follow the same steps as above, but use the following formula in the Custom Column dialog: if [UnitPrice] >= 0 then "Valid" else "Invalid".
b. Rename the new column as "Unit Price Check".
c. Click OK to create the column.
Remove the rows with invalid data:
a. Click on the "Filter" icon next to the "Quantity Check" column header.
b. Uncheck the "Invalid" option to exclude rows with invalid quantities.
c. Click OK to apply the filter.
d. Repeat the same steps for the "Unit Price Check" column to remove rows with invalid unit prices.
Question 1
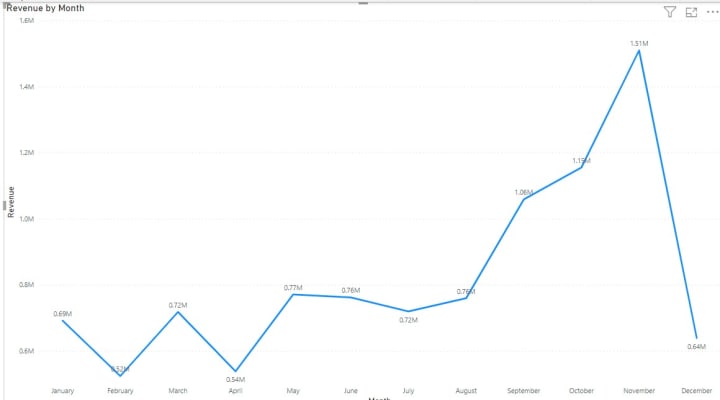
The CEO of the retail store is interested to view the time series of the revenue data for the year 2011 only. He would like to view granular data by looking into revenue for each month. The CEO is interested in viewing the seasonal trends and wants to dig deeper into why these trends occur. This analysis will be helpful for the CEO to forecast for the next year.
Question 2
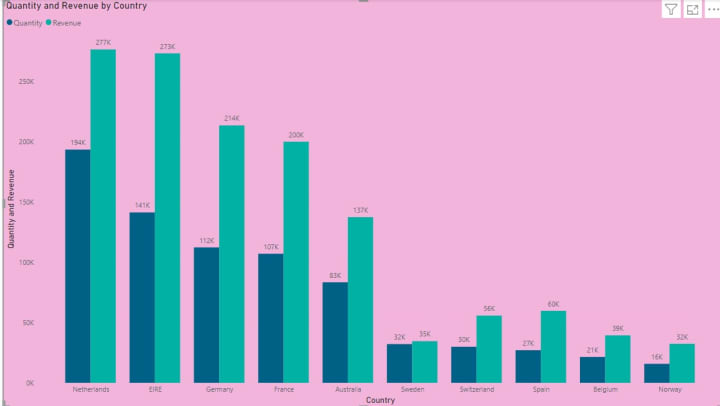
The CMO is interested in viewing the top 10 countries which are generating the highest revenue. Additionally, the CMO is also interested in viewing the quantity sold along with the revenue generated. The CMO does not want to have the United Kingdom in this visual.
Question 3
The CMO of the online retail store wants to view the information on the top 10 customers by revenue. He is interested in a visual that shows the greatest revenue generating customer at the start and gradually declines to the lower revenue generating customers. The CMO wants to target the higher revenue generating customers and ensure that they remain satisfied with their products.
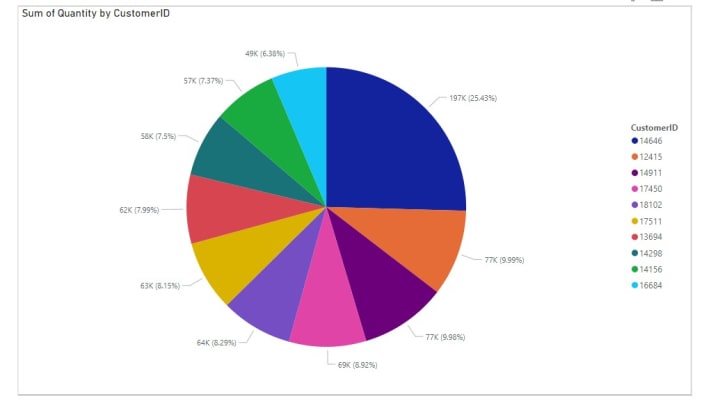
You can also make use of bar and column charts to visualize the data.
Question 4
The CEO is looking to gain insights on the demand for their products. He wants to look at all countries and see which regions have the greatest demand for their products. Once the CEO gets an idea of the regions that have high demand, he will initiate an expansion strategy which will allow the company to target these areas and generate more business from these regions. He wants to view the entire data on a single view without the need to scroll or hover over the data points to identify the demand. There is no need to show data for the United Kingdom as the CEO is more interested in viewing the countries that have expansion opportunities.

TASK 1 SOLUTIONS -> https://vocal.media/education/tata-virtual-experience-program-solutions
TASK 2 SOLUTIONS -> https://vocal.media/education/tata-virtual-experience-program-solutions-l02r0ia0?utm_source=Iterable&utm_medium=email&utm_campaign=
TATA VIRTUAL EXPERIENCE PROGRAM LINK : https://www.theforage.com/virtual-internships/prototype/MyXvBcppsW2FkNYCX/Data-Visualisation-Empowering-Business-with-Effective-Insights?ref=ZDpWiY9Dv6fWoRRTF
About the Creator
Vidhiya S B
An exceptional individual driven by a passion for data analysis and technical content creation. Sharing my learnings here. Subscribe for more.
Enjoyed the story? Support the Creator.
Subscribe for free to receive all their stories in your feed. You could also pledge your support or give them a one-off tip, letting them know you appreciate their work.
Keep reading
More stories from Vidhiya S B and writers in Education and other communities.
TATA VIRTUAL EXPERIENCE PROGRAM SOLUTIONS
The Tata Group is a global company operating in over 100 countries across six continents, whose mission is 'to improve the lives of the communities we serve around the world, through long-term independent creation enter the value based on Trusted Leaders' 128 billion by 2021 -22 With revenues of $9.6 billion, these companies collectively employ more than 935,000 people. There are 29 publicly listed Tata companies – many are market leaders in their respective industries.
By Vidhiya S Babout a year ago in Education
Defeating Self-Doubt: A Comprehensive Guide for Musicians
Self-doubt is an almost universal experience among musicians, whether they are beginners or seasoned professionals. It can stifle creativity, hinder performance, and even lead to giving up on music altogether. The relentless pressure to be perfect, the fear of judgment, and the constant comparisons can create a paralyzing environment for any artist. However, self-doubt can be managed and overcome with the right strategies. This comprehensive guide aims to provide musicians with the tools they need to defeat self-doubt and thrive in their musical journey. By adopting practical methods and mindset shifts, musicians can reclaim their confidence and passion for music.
By Music Industry Updates4 days ago in Education
2023 The Year of Women and Fridging
2023 was an incredible year for women in film. Between Beyonce and Taylor’s concert movies, Barbie and 1 single woman getting nominated for best director at the Oscars there was a lot to celebrate. But just like with anything the universe seeks balance and in 2023 we nerds also experienced something on page and screen that we should have evolved out of decades ago. In the year of Barbie we had not 1, but 2 incidents of fridging in the comic book universe. Both came from Marvel and both are inexcusable. I would love to celebrate how far representation in this field has come, really I would. But I can not do that if we are still making the same mistakes. I am not going to celebrate that there is now less sexual assault in comics. I am not going to celebrate that fridging is less common. I am not going to celebrate that women are infantilized less often in comics. I will not celebrate less. Not in 2024 when every grown person on the planet should know better. I will not be celebrating less. I will celebrate when women are ALWAYS treated like human beings, fictional or not.
By Alexandrea Callaghan6 days ago in Geeks


Comments (1)
Check out my TASK 4 SOLUTION HERE : https://www.youtube.com/watch?v=DsT_V_3MYMQ