
7 Trends In Indian Higher Education Every Indian Must Know
For the development of a nation and its society, three types of capital are essential — physical, financial and human.


Of these, in today's era of knowledge economy-led growth, human capital will have the most significant impact on socio-economic growth for decades to come.
Development of human capital starts with our education system. Every year since 2011, Ministry of Human Resource Development has compiled extensive data via the All India Statistics on Higher Education (AISHE). A survey of AISHE brings to light interesting trends in India's higher education that can be capitalised on to drive our development of human capital.
1. India Has Successfully Built Capacity, Now Focus Is On Quality And Enrolment
Total enrolment in India’s higher education (HE) in 2018-19 was 3.74 crore, rising from 2.91 crore in 2011-12 at a compound annual growth rate (CAGR) of 3.6 per cent, as shown in Table 1. We have caught up with China’s enrolment of 3.8 crore in 2018 and will soon have the largest education system in the world.
We have 51,649 educational institutions, of which 993 are universities. China’s gross enrolment ratio (GER) in higher education is expected to cross 50 per cent in 2020, whereas India is at 26.3 per cent — indicating potential and capacity for growth. Gross enrolment ratio in this case is equal to the number of students enrolled in higher education divided by total population multiplied by 100.
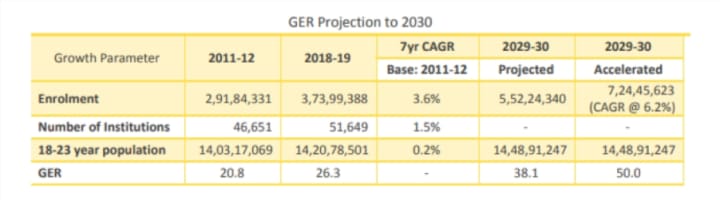
Various stakeholders like Federation of Indian Chambers of Commerce and Industry (FICCI) through their 2013 report on “Vision 2030 for Higher Education” and the National Education Policy 2019 place India's potential to grow its GER to 50 per cent in the year 2030.
A seven-year enrolment CAGR of 3.6 per cent projects total enrolment to 5.5 crore in 2029-30. The 18-23-year population projects to 14.5 crore in 2029-30.
With these projections, the GER will only rise to 38.1 per cent.
With the 2030 target of GER of 50 per cent, we can back-calculate the required total enrolment figure to be 7.24 crore. For this to happen, enrolment must grow at 6.2 per cent CAGR starting now to arrive at 7.24 crore in 2030, which is 2.6 percentage points higher than the current CAGR of 3.6 per cent.
Currently, we average 724 students per institution. At the 2030 projection of 7.24 crore students, while retaining 51,649 institutions, we grow to 1,400 students per institution — very reasonable. Of course, there is tremendous variance across states, but on average, India has an adequate base infrastructure. It would be more productive and efficient hence, to focus on brownfield expansion. Enhancing our institutions and improving quality and GER is the need of the hour.
2. Women Enrolment Is Rising Exponentially
About 1.92 crore men and 1.82 crore women enrolled for higher education in 2018-19. Since 2011-12, male enrolment grew at 2.5 per cent CAGR and that of women at an incredible 4.9 per cent CAGR.
Women are increasingly turning toward higher education with clearer aspirations. As more educated women join the workforce, the 2020-30 decade is set to see the rise of the Indian woman.
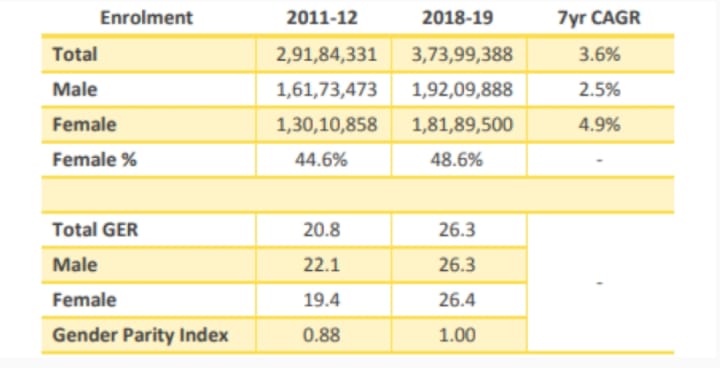
Male enrolment is slowing down. Between 2017-18 and 2018-19, it only moved by 5,000 whereas women enrolment rose by 7.5 lakh. Women are now 48.6 per cent of enrolled students, up from 44.6 per cent in 2011-12.
This is a pan India phenomenon. Even within the Muslim community with the lowest
enrolment ratios in the country, women’s enrolment, at 8.7 per cent CAGR, is rising faster than that of men at 6.7 per cent. 2018-19 is the first year that female GER at 26.4 rose above male GER, which stagnated at 26.3, bringing the Gender Parity Index to 1.0 for the first time.
3. Domain Expertise Is In Flux
Growing economies need expertise across numerous domains — science and technology, finance and commerce, healthcare, education, law, business administration, and so on. So, what are our students studying?
In 2018-19, the top five fields enrolled 1.09 crore (BA and BA Hons), 52.6 lakh (BSc and BSc Hons), 40.3 lakh (BCom), 37.7 lakh (BTech and BE), and 12.2 lakh students (BEd).
MBBS students made up 2.7 lakh while the remaining fields made up 1.2 crore combined. A total of 90.9 lakh graduated.
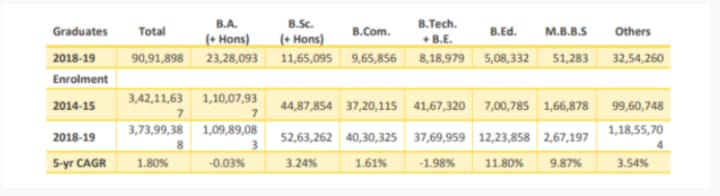
Over the last five years, enrolment in BA and BA (Hons) degrees — the most widely-studied field in India — is stagnating at a negative 0.03 per cent CAGR. This may indicate that as the diversity of domain subjects increases, India's youth is diverging from traditional pursuits.
Enrolment in BSc and BSc (Hons) degrees is growing at 3.24 per cent CAGR.
India has produced 53.5 lakh BSc and BSc (Hons) graduates from 2014-15 to 2018-19. With enrolment rising, care must be taken to provide graduates with sufficient follow-on opportunities in research and post-graduation.
A worrisome trend, however, is the negative 2 per cent CAGR in enrolment in BTech and BE courses over five years. Technological development is amongst the most decisive drivers of socio-economic growth, and India needs to stimulate enrolment here.
Enrolment in BCom is increasing at 1.6 per cent CAGR and we have produced 45.36 lakh BCom graduates over five years. India is among the world's most exciting financial development sandboxes, and incentivising creative thinking in finance specialists is essential.
Enrolment in MBBS advanced to 2.7 lakh in 2018-19, at a promising 9.9 per cent CAGR. India, with its 130-plus crore population, is building a comprehensive healthcare infrastructure network; we need to develop a critical mass of doctors for this.
BEd enrolment is growing at a rapid 11.8 per cent CAGR. On the other hand, Ministry of Human Resource Development data shows the number of children in school has stabilised. Census and fertility data indicate the number of children is reducing. Teaching requirements thus must be forecasted to avoid over-staffing.
4. Less Than 0.5 Per Cent Of Total Enrolment In PhD Programmes
Specialisation is crucial for a growing economy. It enables productivity improvements in society, and the ability to produce world-class products and services to, both, meet our growing needs and capture global markets.
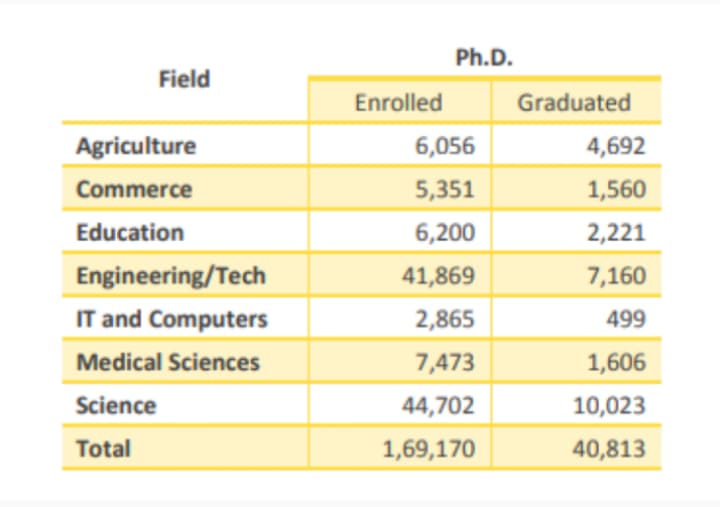
About 1.69 lakh students were enrolled in PhD programmes in 2018-19, amounting to 0.45 per cent of the total enrolment in higher education. China’s number of doctoral students in 2018 was 3.89 lakh, almost double.
A total of 40,813 PhD degrees were awarded in 2018-19, which is also 0.45 per cent of total graduates. India has to improve this rate of specialisation to dominate in research and development, improve our innovation index, and drive socio-economic growth.
The highest number enrolled for a PhD was in the sciences at 44,700 and engineering and technology at 41,900.
Apart from improving numbers in these fields, focus on agriculture innovation (currently 6,000), medical sciences (currently 7,400), and information technology and computers is sorely needed.
India needs more quality researchers with PhDs to lead research and innovation efforts across several disciplines.
5. Affirmative Action Has Yielded Results
Towards the objectives of inclusive enrolment and coverage, affirmative action has undoubtedly yielded results.
Between 2012-13 and 2018-19, enrolment among various groups increased at astounding growth rates — by 17.2 lakh (Scheduled Caste), 7.5 lakh (Scheduled Tribe), 41.8 lakh (Other Backward Class), and 10.1 lakh (minorities).
‘General merit’ enrolment reduced by four lakhs at a CAGR of negative 0.5 per cent. The government’s focus on higher education has enabled rapid development of previously disadvantag
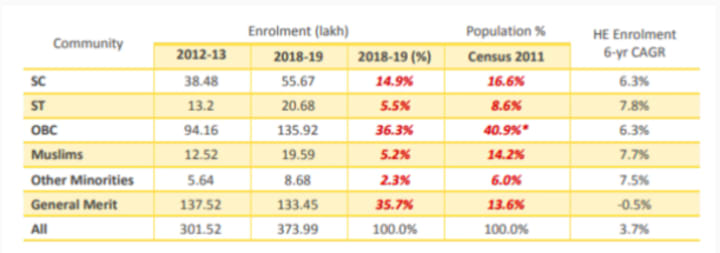
Enrolment proportions for the SC, ST and OBC communities in 2018-19 are close to their population composition:
For the SC community, 14.9 per cent enrolment against 16.6 per cent of the population; remarkably close.
For the ST community, 5.5 per cent enrolment against 8.6 per cent of the population; this, too, is quite close.
For the OBC community, 36.3 per cent enrolment against 40.9 per cent of the population; close, as well.
Minorities, however, have not demonstrated the same progress. They constitute 20.2 per cent of India’s population but are only 7.5 per cent in higher education enrolment.
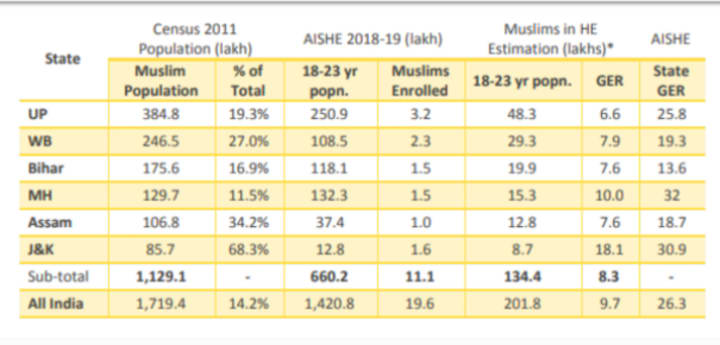
6. Muslims Are Considerably Behind, Must Take Charge Of Their Development
GER is an excellent indication of human capital development within a community. Muslims represent only 5.2 per cent of HE enrolment against being 14.2 per cent of the population.
Since AISHE does not provide GER estimations for Muslims and other minority communities, the authors estimated the above figures using Census 2011 and AISHE enrolment data. There is a stark difference between the overall GER, 26.3 per cent, and estimated Muslim GER, 9.7 per cent.
The five states with the highest Muslim populations as well as erstwhile Jammu and Kashmir (J&K), with a Muslim majority population at 68.3 per cent, also have this big delta. For example, Uttar Pradesh’s GER is 25.8 per cent, but estimated Muslim GER is only 6.6 per cent. Surprisingly, even J&K being a Muslim-majority state has a low Muslim GER, 18.1 per cent, compared to the state GER of 30.9 per cent. There has been a policy failure here, indicating the need for a different approach.
From the government’s side, utilising the budget of the Ministry of Minority Affairs to increase capacity and number of institutions in Muslim-dominated areas is necessary.
The Muslim community must take charge of improving their human capital. When other groups like SC/ST/OBCs have rapidly grown, there is no reason the Muslim community cannot. Muslim women, in particular, have shown an appetite for further learning. Their enrolment grew at 8.7 per cent CAGR; they must be encouraged by building capacity and providing them with greater access.
7. One Common Policy Across India Won’t Work
A snapshot of the higher education bases across representative states shows vast differences. Uttar Pradesh tops the country — with 17.3 per cent of India’s enrolled students in higher education (64.7 lakh of 3.74 crore), 16.8 per cent of graduates (15.3 lakh of 90.9 lakh), and 15.6 per cent of HE institutions (8,077 of 51,649). Maharashtra is next, followed by Tamil Nadu.
In terms of GER, Tamil Nadu leads by far with 49 per cent. No other big state had even crossed 40 per cent in 2018-19.
In general, all southern states, including Maharashtra, have decent GERs above the all-India average.
Apart from Punjab, states in north-central and Gujarat in the west have GERs below the India-average.
Given its large population, Uttar Pradesh has an impressive GER of 25.9 per cent, tracking very close to the all-India average of 26.3 per cent.
Unfortunately, eastern states like Bihar, Jharkhand, and West Bengal have not crossed GER of 20 per cent. Eastern states have a meagre number of institutions, indicating a lack of drive to develop human capital. Immediate planning is required to bring GERs in these states to at least the all-India average of 26.3 per cent by increasing capacity and access.
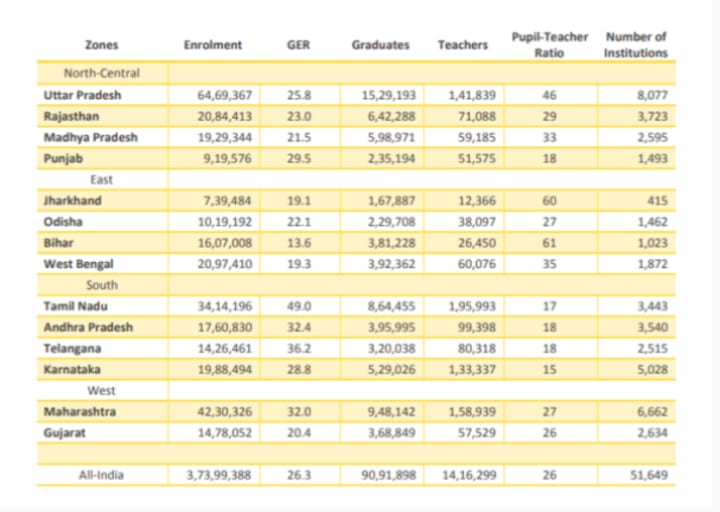
Only four states have teaching staff of more than one lakh for higher education institutions, led by Tamil Nadu. Southern states have an impressive pupil-teacher ratio (PTR) of below 20, led by Karnataka at 15.
On the other end, eastern states like Jharkhand and Bihar have absurdly high PTR of 60-plus. Uttar Pradesh is at 46, but given the large population and enrolment base, the state is showing promising results compared to other population-dense states like Bihar and Jharkhand.
One policy across India for higher education will not yield results. Each state needs a differentiated strategy to respond to its needs to reach GER of 50 per cent by 2030.
All evidence points to higher education and human capital development being the key to socio-economic growth, higher per-capita incomes, a better quality of life, and employability.
Source: Swarajyamag.com
About the Creator
Keep reading
More stories from Student Matters and writers in Education and other communities.
6 Ways to Study Abroad for Free or Cheap.
The secret to offsetting the cost of studying abroad is to remember that much of what you pay to study abroad is for peace of mind and ease. Study abroad programs charge you extra to help you find housing, help enroll in foreign universities, or even facilitate your visa process. By taking on some or all of these tasks on your own, you can make your study abroad experience a whole lot easier.
By Student Matters3 years ago in Education
Unleashing the Potential: Ubuntu Server's Influence on the Digital World
In a world where digital innovation is paramount, Ubuntu Server stands out as a game-changer for businesses and individuals alike. With its user-friendly interface, extensive support network, and robust online environments, Ubuntu Server is revolutionizing the way we navigate the digital landscape. Join us as we explore how Ubuntu Server is unleashing its full potential and transforming the way we operate online. Get ready to experience the power of Ubuntu Server and elevate your digital presence like never before., User-Friendly Interface for Seamless Navigation With its intuitive user interface, Ubuntu Server offers a seamless navigation experience for both beginners and experienced users alike. This user-friendly design allows for effortless exploration of the server's features and functionalities, making it easier to manage and optimize digital environments. Whether you are setting up a website, running applications, or configuring networks, Ubuntu Server's interface ensures a smooth and enjoyable journey through the digital realm., Extensive Support Network for Peace of Mind In addition to its user-friendly interface, Ubuntu Server boasts an extensive support network that provides users with peace of mind. Whether you encounter technical issues, have questions about specific features, or need guidance on optimizing performance, Ubuntu's support resources are there to assist you every step of the way. This robust network ensures that users can rely on timely and knowledgeable assistance, further enhancing their experience with Ubuntu Server. As you harness the power of this supportive ecosystem, you can confidently explore the possibilities of maximizing your digital environment for optimal performance and efficiency with Ubuntu Server's influence on the digital world., Robust Online Environments for Maximum Performance To further enhance your digital infrastructure, Ubuntu Server offers robust online environments designed for maximum performance. By leveraging the power of these environments, users can optimize their systems for efficiency and productivity. From fine-tuning server configurations to implementing cutting-edge solutions, Ubuntu Server's online environments provide the tools and support needed to elevate your digital capabilities. As you harness these resources, you are poised to revolutionize the digital landscape with Ubuntu Server, unlocking new possibilities and potential for your online operations., Revolutionizing the Digital Landscape with Ubuntu Server Innovating the online ecosystem with Ubuntu Server goes beyond just enhancing performance and efficiency. By revolutionizing the digital landscape with Ubuntu Server, organizations can stay ahead of the curve and adapt to the rapidly evolving technological landscape. With its advanced features and customizable options, Ubuntu Server empowers users to create tailored solutions that meet their specific needs and challenges. By embracing the possibilities that Ubuntu Server offers, businesses can truly shape the future of the digital world and pave the way for innovation and growth in the online realm., In a world where digital efficiency is key, Ubuntu Server stands out as a game-changer for businesses and individuals alike. With its user-friendly interface, extensive support network, and robust online environments, Ubuntu Server is paving the way for a more efficient and effective digital landscape. Experience the power of Ubuntu Server today and unleash your full potential in the digital world. Start your journey towards maximum performance and seamless navigation. Remember, the key to success lies in embracing innovation and staying ahead of the curve. As the saying goes, "The only way to do great work is to love what you do." So, why wait? Take the leap and revolutionize your online presence with Ubuntu Server. Don't miss out on the opportunity to elevate your digital game. Start now and see the difference Ubuntu Server can make for you. Your future in the digital world awaits.
By César Rondón Batistaa day ago in Education
Getting a personality is easy.
Getting a personality is as easy as sneaking into Area 51 with Helen Keller as the security guard - super simple, right? Remember when you were a kid and your whole personality was just Harry Potter, frog facts, and being a connect 4 champion? Adults would talk to you for 40 seconds and boom - you were the Harry Potter connect 4 frog kid. But now, you're feeling boring because you can't even list your interests when asked for the 82nd time in a row. It's like you have no hobbies at all. But fear not, getting a personality is a piece of cake, despite what the internet tells you.
By Angelo Rodriguesa day ago in Education


Comments
There are no comments for this story
Be the first to respond and start the conversation.