
A Day at the OptaPro Forum
Sports data company Opta hold an annual forum in London for football analysts, both professional and amateur. Here's what happened at the 2018 event.

Whatever your opinion of football statistics, there's no doubt you will be aware of Opta. They are the official data provider for the Premier League, and their OptaJoe Twitter account has over a million followers.
Opta hold an annual analytics forum in London. Analysts, be they professional or amateur, submit proposals for presentations, and several are chosen to share their work with an invited audience taken from football clubs, bloggers and the media.
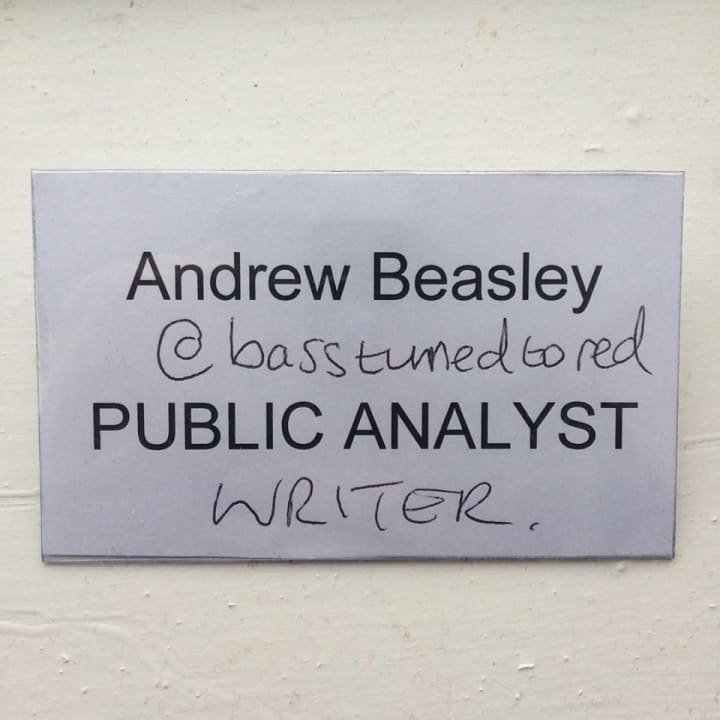
The 2018 edition of the forum took place this week and I was fortunate enough to attend, as I have done since the event was launched in 2014. My first priority upon arriving was to collect my name badge.
The attendees from football clubs had their team's logo on their badges. As the amateur community exists primarily on Twitter, I couldn't help but think that a handle and avatar might be useful for its members.
His analysis suggested Pierre-Emerick Aubameyang might score around five league goals for Arsenal this season. It didn't seem appropriate to shout out that 6-10 was the verdict in a recent Twitter poll I conducted.
John-Mark Sisman was up next. He (and it's almost all 'he' at these things, both on the stage and in the audience) used player tracking data to analyse teams' pressing styles. There's always at least one presentation at every #OptaProForum which uses a voronoi diagram, and this was the first in 2018.
John-Mark tied in video footage, which is always useful and surprisingly rare in the presentations. The data helped him to identify Barcelona's pressing trigger. Knowing what the trigger is represents a good start; stopping them from doing it is likely to be somewhat harder.
As well as presentations in the lecture theatre, there were posters in the break out area which explored further analyses. Two of them were of particular interest to me.
I was drawn to Kevin Shank's work on long throws, as it agreed with an article I wrote last year for The Tomkins Times. He was handed the keys to the data cupboard whilst I went through game-by-game on Stats Zone and manually noted things down. Each to their own, eh?
Ben Woolcock then showed that he is a man after my own heart by doing an interesting analysis on Excel. A lack of super smart computer coding skills needn't be a barrier to working with statistics, and it was great to see an example of that at the forum.
One of the posters from last year's event was expanded into a full blown presentation this year by Martin Eastwood. It was a fascinating look at how tracking data can be used to monitor team shapes. Want to know which of your players is out of line in the back four, and by how much? Martin's your man.
I had to smile when he said "tracking data can provide simple insights." I'm sure it can, but the background work that went into the presentation will have been anything but simple.
The next section of the day was something new for the forum: A question-and-answer session with someone who works in the professional game. Not only that, but someone who should act as an inspiration to amateur analysts everywhere: Devin Pleuler.
Devin was a blogger, then got a job with Opta themselves, before later joining Toronto FC's analytics department. As Toronto won the domestic treble with an all-time MLS regular season points record in 2017, it seems safe to assume that he's not bad at his job.
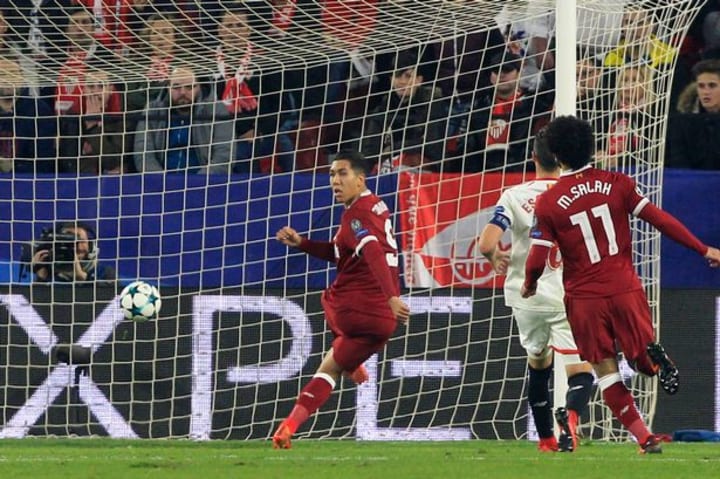
After lunch, Freddie Wilson was first up. Are you fed up of looking at chance creation maps with far too many lines? Here's exhibit A, and it's from just one match, never mind a whole season.
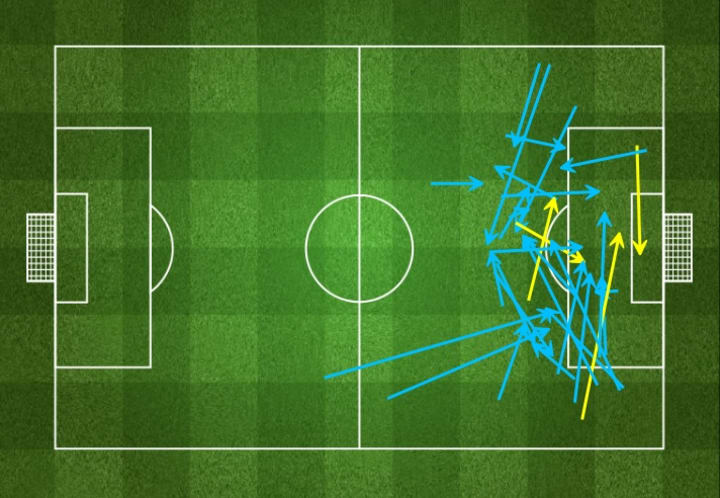
Liverpool's chances created in their 4-0 win over Everton in 2016
Freddie used clusters to simplify a chart of key passes, with an added emphasis on looking at which were better or worse from an expected goals perspective. Cluster means German music from the 1970s to me, which is why Freddie is on the stage presenting and I'm sat at the back thinking about German music from the 1970s.
Marek Kwiatkowski is a football analytics consultant, and an entertaining one at that. His presentation was next, and he looked at how players and managers perform against an advanced form of expected goals.
I always think the presentations resonate more when there are players or managers listed, as any layman can then easily assess the findings for themselves. Marek provide ample evidence on that front, and the fact that Jesus Navas was at the bottom of a couple of the lists suggests to me that he is on the right track.
Just as one of the posters had chimed with work I had done previously, so did the final presentation. In fact, it was a broadly similar idea to one which I have submitted as a forum proposal in the past myself. As with Kevin's effort, though, it was far superior to anything I could have done.
Tracking data was the focus once again, and this time it was used to monitor player movement on corners. The presentation was given by three people (Ray, Alex, and Ferdia), and whilst it was undoubtedly interesting, having three people up there but taking it in turns to speak separately didn't really add anything.
The final part of the day was the keynote speech, which was delivered this year by Luke Bornn. He currently works for the Sacremento Kings in the NBA, and was previously at Roma in Serie A. His talk was jammed full of insight, and one nugget he shared probably applies well in all industries and not just sport.
Luke told of how he was unable to influence the manager at Roma, Luciano Spalletti, but he could influence the people who did have the boss's ear. Find your right place in the pipeline, folks, and go from there.
It was also fascinating to learn that he records shooting statistics from training sessions, in order to greatly increase his sample of data. "We don't have data on where the guy is looking," Bornn observed when asked if data taken from when players weren't fully focused would pollute the findings. Maybe that's a new stream of statistics they should bring in for football.
Which supposedly stats-minded manager only has a passing interest in some very basic stats? Which transfer flops were blackballed by analysts only to be signed by their clubs anyway? Who stated "most players are narcissists"? I could tell you, but I'd never be invited back. And I enjoy the day far too much to let that happen.
About the Creator
Andrew Beasley
Freelance football (soccer) writer. I also like to write about other things which take my interest.
There are links to my work here: https://wakelet.com/@AndrewBeasley
For any enquiries, please email: [email protected]
Keep reading
More stories from Andrew Beasley and writers in Cleats and other communities.
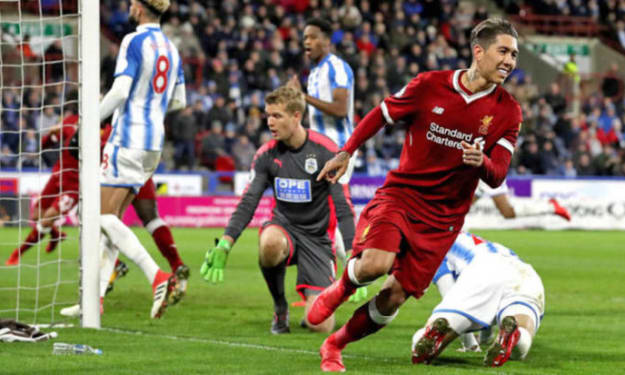
Huddersfield 0-3 Liverpool: Stats Review
Sound the church bells! Liverpool had a lot of possession away from home, and won! This has been all too rare an occurrence in recent times. Prior to this match, the Reds had played 46 away matches in the Premier League under Jürgen Klopp. Those games split almost evenly between Liverpool having less or more than 59 percent of the possession.
By Andrew Beasley6 years ago in Cleats
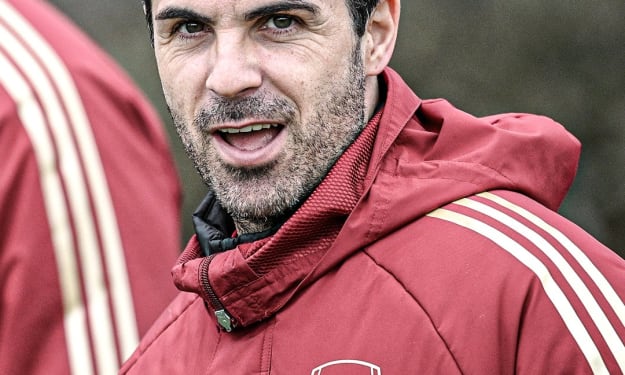
Premier League Title Race:
The Premier League title race has reached its climax, with Arsenal, Liverpool, and Manchester City vying for the coveted crown. The three teams have showcased exceptional skill, determination, and resilience, making it a thrilling contest. As we analyze their performances, it's clear that each team has its strengths and weaknesses, but one team stands out as the most deserving of the title.
By Marvellous Oseyomon 3 days ago in Cleats
The Business of Nature
Dew drops reflected the light of the sun. The inhabitants of Whispering Woods woke up to the golden droplets of water on the leaves of the flora. The oaks particularly enjoyed the light and the maples did, too. Happiness enveloped all who lived there, even the rocks that cried out in the night delighted in the morning.
By Skyler Saunders2 days ago in Fiction


Comments
There are no comments for this story
Be the first to respond and start the conversation.