

Hello, we are back with our next article in a series of native iOS development. We will learn how we can debug in Xcode in this article. In case you want to you want to check our previous articles about introduction to iOS and Xcode, you can find them here.
So let’s start without wasting any further time.
What is Debugging?
As per wikipedia definition - “In computer programming and software development, debugging is the process of finding and resolving bugs (defects or problems that prevent correct operation) within computer programs, software, or systems.”
So basically debugging used to find errors or bugs in a software application. And these bugs or errors are run time means which occurs when application is running. Which means you need to run the application to debug the application. You can debug applications by running on simulator as well as on device. For debugging device can be connected by cable to your mac machine or wireless debugging is also possible.
Debugging is really an important activity in software development as while doing development most of time is spent in debugging when any error occurs. Without debugging it becomes very difficult and tedious to find any bug or error. If one has good debugging skills then it becomes very easy to track down the cause of any error or bug and hence resolve it quickly.
Please note you can perform debugging only on debug or development build. Build which is on production cannot be debugged. Debug or development builds are the builds which are prepared by developer during day to day development process and for testing purpose. Once our development and testing is complete we then create production builds for public deployment.
How debugging works?
To perform debugging breakpoints are required to be added to your code file which you want to debug. Breakpoints are nothing but the point at which you want to halt your application to analyze the state of your code till that point.
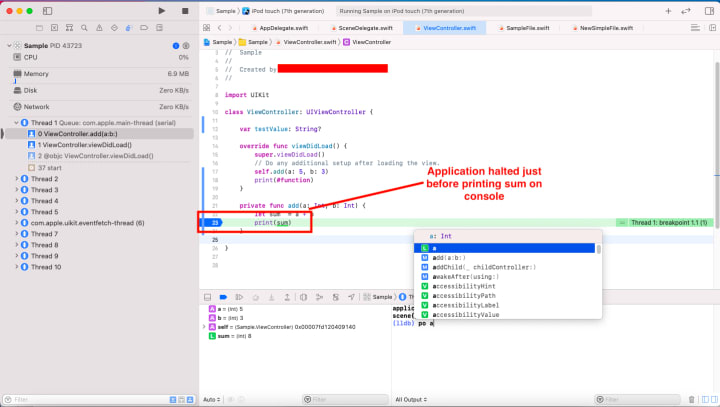
For example let’s say we have a function that performs summation of two integers as below. Here we have halted our application at the point where it prints the sum of integers. So the application will halt just before printing the sum on the console.
Breakpoint management in Xcode
Add breakpoint
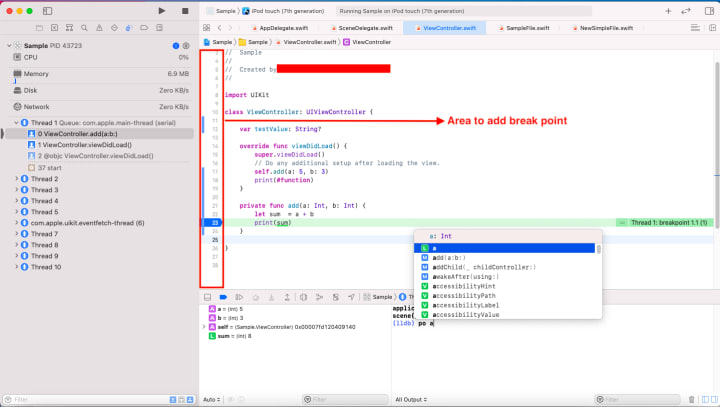
Adding breakpoints is really easy in Xcode. Just click on the left side of the editor where line numbers are displayed. Refer below to add the breakpoint. You can add the breakpoint at any time of debugging your application also. Please note you cannot debug or add breakpoints to sdk code.
Delete breakpoint
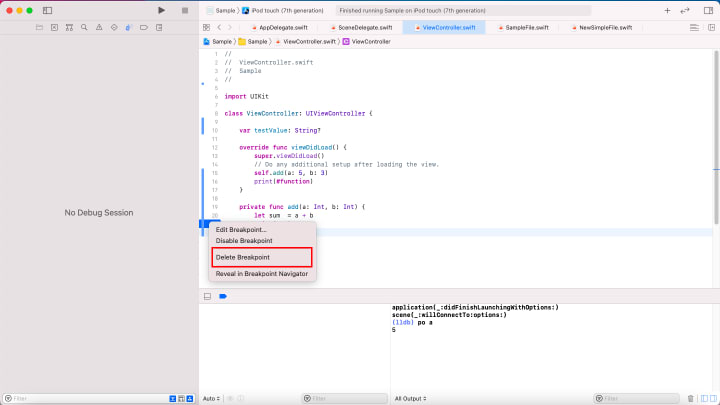
To remove breakpoint simply hold the breakpoint by selecting then drag and release. Alternatively right click on any breakpoint and select delete breakpoint. Refer as below.
Disable breakpoint
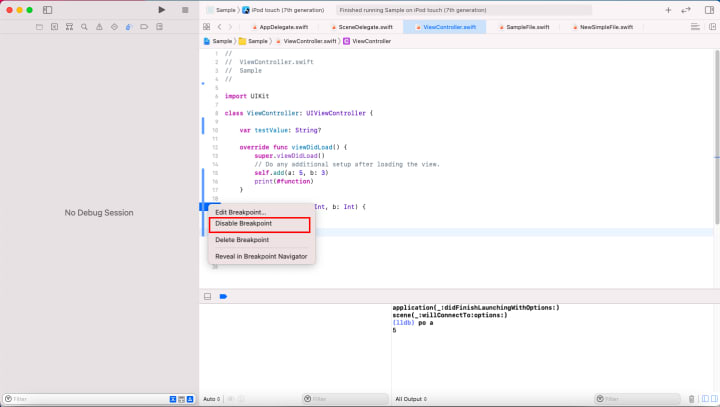
To disable a breakpoint just click on the active break or right click and select disable breakpoint. Disabled breakpoints are visible with lightish shade in disabled state. Disable breakpoints will be ignored by the debug session and the program will not halt on disabled breakpoints. You disable if you want to temporarily stop some breakpoints. Refer as below.
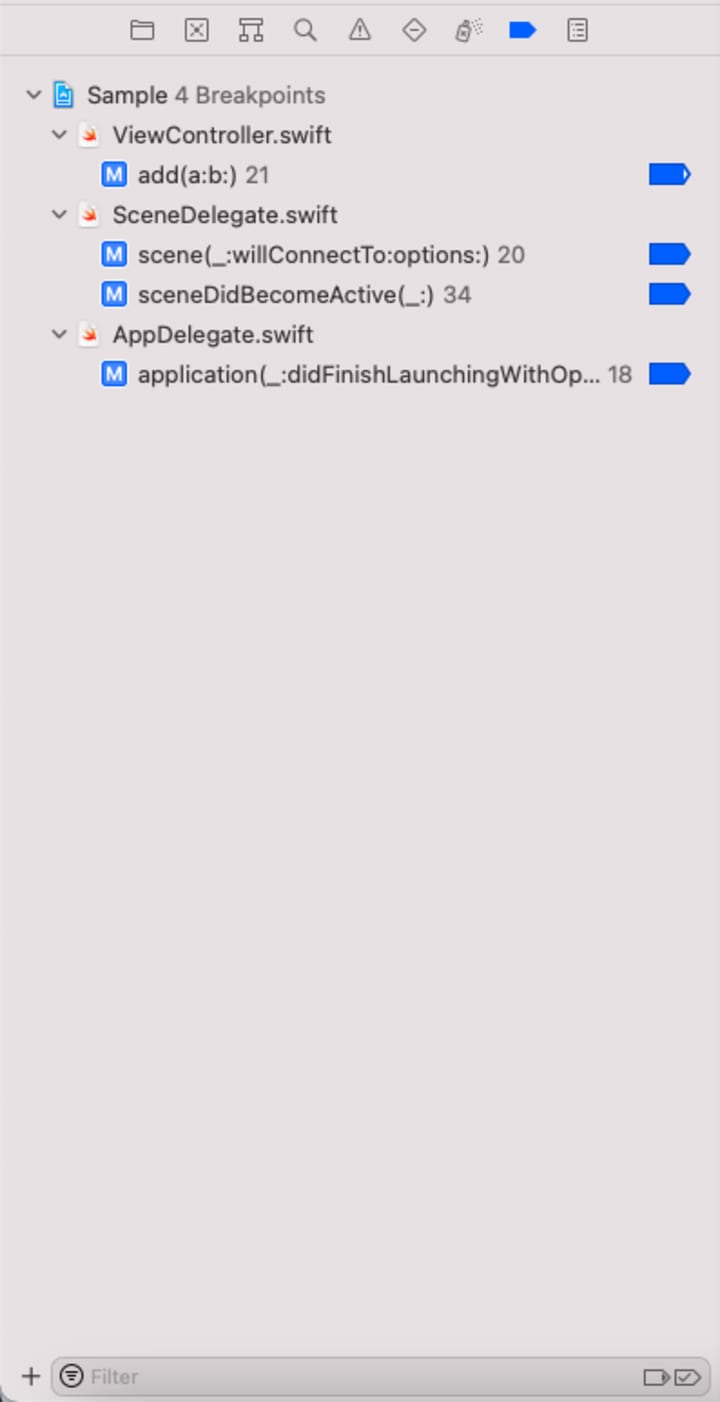
Breakpoint navigator
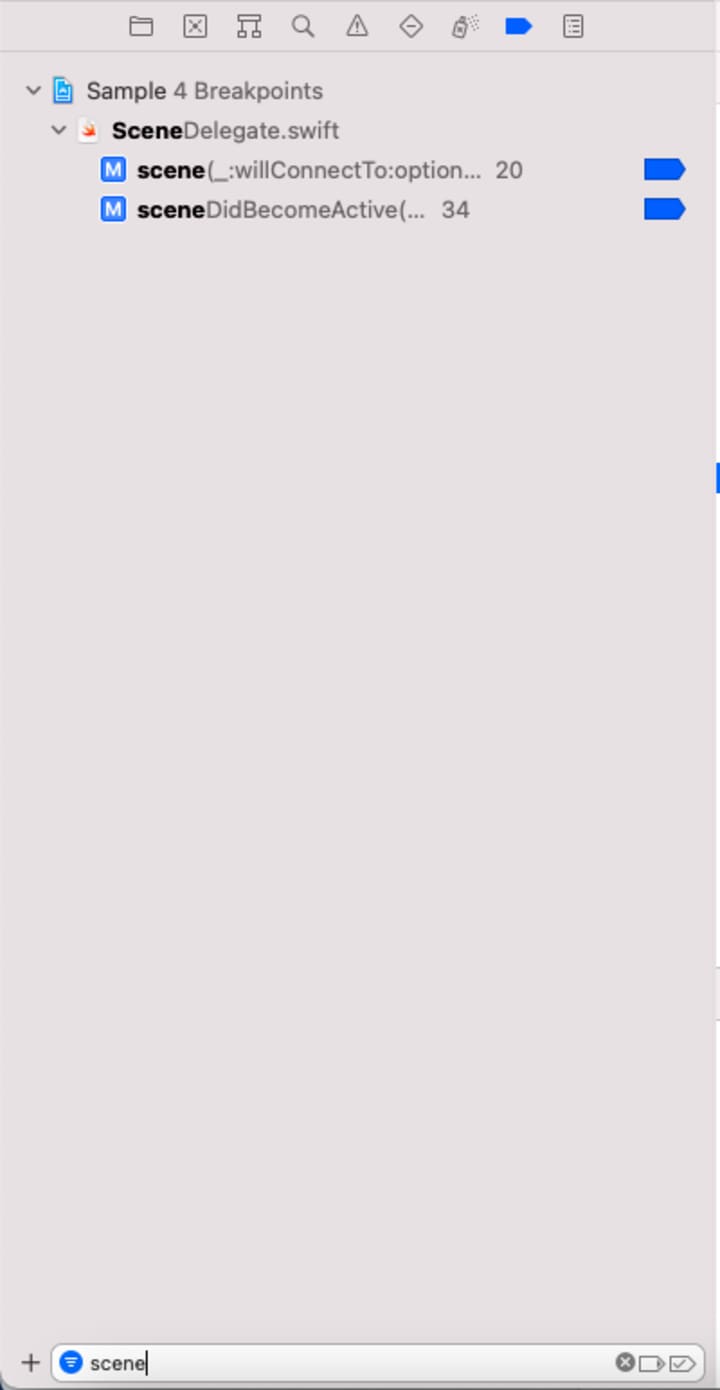
List of all the breakpoints in an application can be seen in the breakpoint navigator which is the 8th option in the left panel. You can filter the breakpoints in the breakpoint navigator using the search bar at the bottom of the breakpoint navigator. From within the breakpoint navigator you can disable and delete specific breakpoints. You can delete all of the breakpoints by pressing command + A and delete in the breakpoint navigator.
Debug Navigator
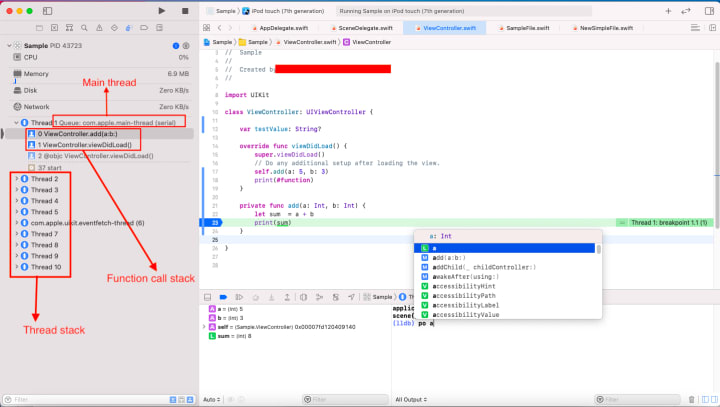
Seventh option in the left panel is the debug navigator. It shows the currently active debug session. From the debug session you can get below important information.
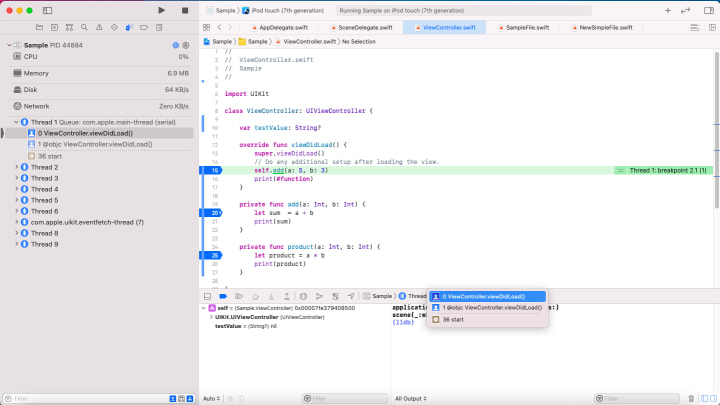
- Function call stack: This is the list of all the functions called till your current breakpoint.
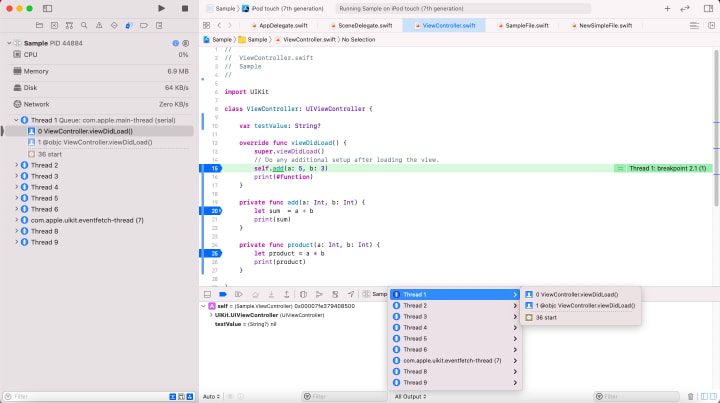
- Thread stack: List of various threads and from which thread this breakpoint is called.
How to perform debugging
Now once you have added all the required breakpoints. Let’s discuss how we can debug our application by traversing these breakpoints and analysing the value of variables in the current active debug session.
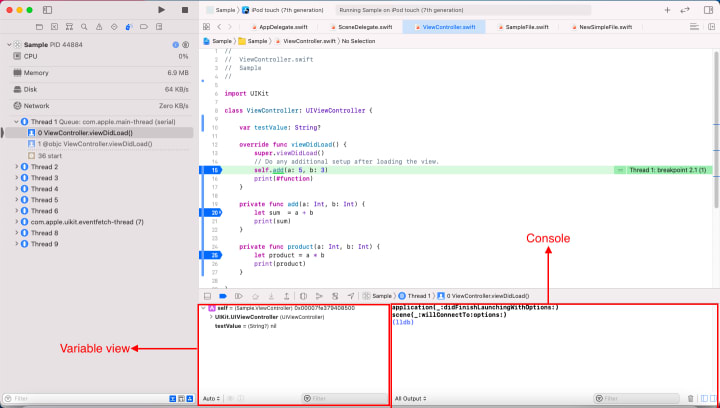
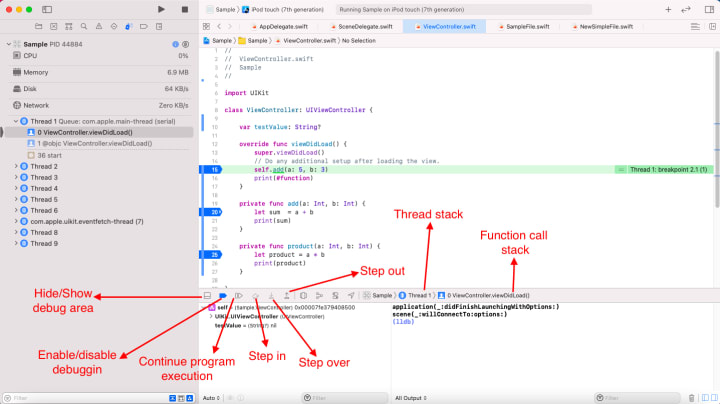
As shown in the above figures when you start the application and as soon as our first breakpoint is hit. We are able to see the debug area in the bottom of the editor with various debug options, variable view and console.
Traversing breakpoints
While performing debugging we traverse through our breakpoint. Below are different methods of traversing through breakpoints.
1. Continue program execution: Use this option to directly jump to the next break point. All the instructions till the next breakpoint will be ignored and the debugger will directly hit the next breakpoint in execution. Refer below.
Step over: This command lets the application execute the next action. If the action involves a call to an operation, it does not step into its implementation (it steps over it instead). Refer below.
Step into: This command lets the application execute the next action. If the action involves a call to an operation, it steps into its implementation and breaks the execution on the first action of that implementation. Refer below.
Step out: This command lets the application execute until the currently executed operation implementation is returned. Refer below.
Observing variables
During a current debugging session we may want to check what values the variables in session are holding. Variable values can be checked using below methods.
- Using variable view: We can use variable view to get the current values of all variables in the current debugging session.
- Hover mouse: Hovering mouse pointer on variable in current debugging session will give its value.
- Using the ‘po’ command in console: By using ‘po’ command in console we can get values of variables and expressions. For example ‘po variable_name’ or ‘po a + b’.
Check the video below for reference.
OK we have come to an end, that’s it for debugging using Xcode. We hope this article helps you in debugging your iOS applications. Debugging is an important and required activity of software development so one needs to learn it.
So this is our last article on Xcode. Next article will be covering project structure and the way ahead. Till then please stay tuned.
Thanks for reading this article. If you have any queries related to this topic or iOS, Objective C and Swift. Please write us at [email protected] or direct message us on instagram at conficle(instagram username).
Also keep watching this space for upcoming articles on iOS development, software development and technology concepts.
About the Creator
Unlock Work Success: How AI Tools Transform Your Productivity
Do you find it difficult to efficiently manage your time and that your workload is always overwhelming you? You have a plethora of resources at your disposal to assist you take on this task head-on, so don't worry about it.
By Ewa Patoka5 days ago in 01


Comments
There are no comments for this story
Be the first to respond and start the conversation.