

John Oliver said “if you want to do something evil, be sure to bury it in something boring.” This article provides information on how to use a tool like GIS to turn the dull data buried in data bases to make maps to highlight environmental injustice.
***** Good news! Snice this research was first done while I was a graduate student the city of Detroit has shut down the polluting WTE plant. Still these methods can be used to create a map for any large point emitter. Be sure to look out for my next article currently being adapted and sanitized for publishing on vocal media showing the results and limitations of this study. *****
How to Use GIS to bring data together into Maps:
Turns out the process of turning something boring into something understandable is…incredible boring, so here is what you can do for a map like this.
Methods:
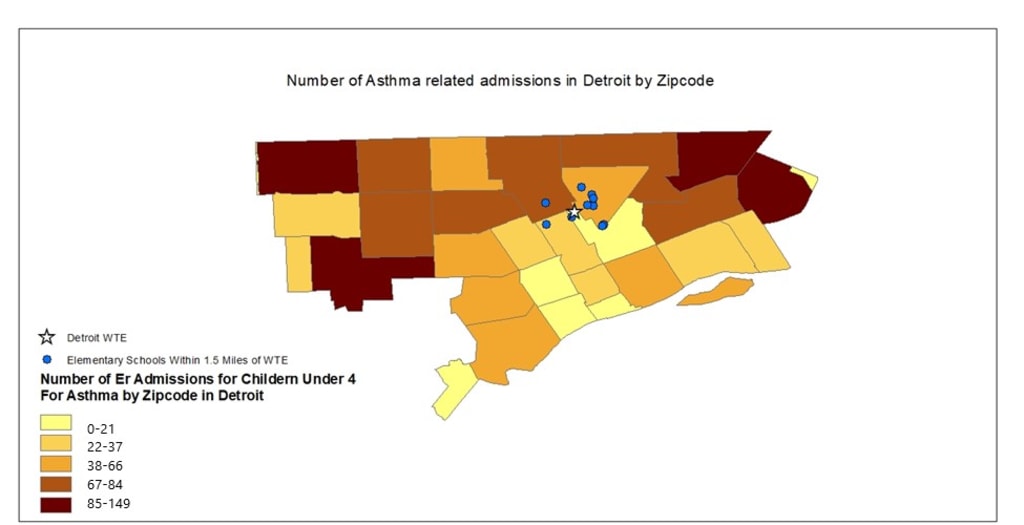
The number of ER visits from children under 4 for the Wayne County was obtained from Data Driven Detroit. The data was joined with the boundary data for the city of Detroit by zip code. Creating a data set for number of ER admission for children under for, only children within the city of Detroit. The grand total counting the number of visits to the ER was converted from string, to double, meaning the arcGIS would be able to recognize the text as numbers. Once the number of admissions was recognizable as numbers, the number of ER admissions for asthma for children under four in Detroit was displayed by zip code US a heat ramp.
The locations of elementary schools as point vector shapefile for the greater Detroit area was taken from the Data Driven Detroit. The points within the shapefile showing the number of ER visits for children under four were identified using the select by location tool to only select schools 1.5 miles from the incinerator. A layer was created from the selected features and the data was exported. The exported layer of vector point locations of elementary schools was added to the map of Detroit showing the number of admissions for asthma for children under four by zip code. Finally, the location of the DRP WTE was added to the map. Using the convert address tool from latlong.net/convert-address-to-lat-long.html was used to obtain the GPS coordinates which formatted as numbers and the data was saved in an xls format.
This table was imported in ArcGIS. Once the table was imported the XY data was displayed to convert the table and GPS coordinates in to point vector data on the map as an event. The event was exported as a shape file and added to the map. The incinerator was shown on the map as a star. All layers where then converted from their perspective source coordinate/projection systems to the NAD 1983 State Plane Michigan South FIPS 2113 Feet Projection. This created a map of Detroit, which showed the location of the WTE plant, the location elementary schools within 1.5 miles of the WTE and the number of ER admissions for children under four by zip code in the city of Detroit. A second map was created using the same data as the Detroit map. This was a map of Wayne county, showing the location of the WTE plant, the location elementary schools within 1.5 miles of the WTE and the number of ER admissions for children under four by zip code in Wayne County.
DATA SOURCES:
If you want to work with GIS you have to find good data sources. The census provides a wealth of data, but it can be very difficult to work with. Things are match easier if you can find data stored as a shapfile. I got most of my data for this report from datadrivendetroit.org. They provide amazing resources I highly recommend their site as a source for high quality easy to use data on pertaining to Detroit.
Data on the number of ER admissions related to asthma for people under 18 in Wayne county, the county which Detroit is in, by zip code was obtained from datadrivendetroit.org as a shapefile. The point locations of elementary schools and certified childcare providers in Wayne county were also obtained from datadrivendetroit.org as a shapefile.
Results:
Be sure to look out for my next article currently being adapted and sanitized for publishing on
vocal media showing the results and limitations of this study. I expect it to be up by 11/18/2020
About the Creator
How Flutter App Development Services Ensure Seamless User Interaction and Experience
Mobile applications have taken center stage in our daily lives. From streaming live music and getting news and traffic updates to ordering food, online shopping, and getting house help- there’s an app for almost everything. With an overwhelming number of applications brimming over the internet, how do you create an app that stands out from the rest? Or, let me put it this way, what makes a mobile application ‘hit’ or ‘flop’? Without a doubt, the answer to the second question is the user experience an app renders. A well-designed app with intuitive interactions can be a chartbuster, while a clunky or confusing one can leads to frustration and abandonment.
By Sara Suarez2 days ago in 01


Comments
There are no comments for this story
Be the first to respond and start the conversation.