
Crypto Technical Analysis: Candlestick Charts & RSI Indicator
Keeping Up With The Cryptos: Chapter One.


This article will be explained the easiest and simplest way possible to all those who would like to understand the world of crypto-trading. Although there are technical indicators I will not go into deep details. The idea is that it is easy to understand, and then if you want to go deeper then do your own search.
What is Crypto Technical Analysis?
Technical analysis is a system that allows us to examine the charts of a financial market, in order to predict future movements and where the price is heading. To do this, you have to start with the most basic: Japanese candles.
Crypto Technical Analysis is the same thing, specialized in cryptocurrencies.
Japanese Candles
Japanese candles are used to visually show what the price movement is in a financial asset. It has four fundamental points:
- The opening price
- The closing price
- The highest price
- The lowest price
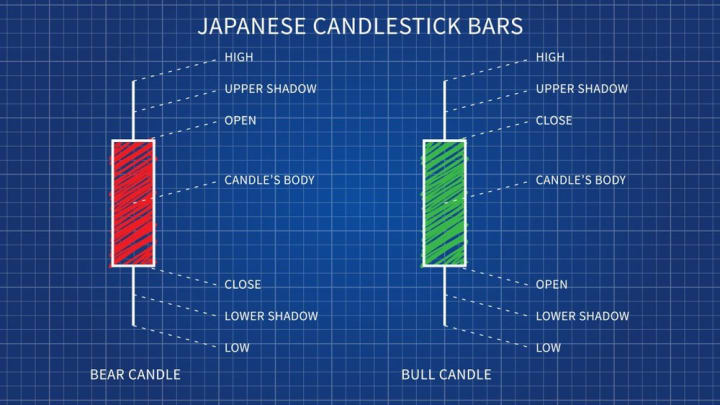
If the closing price is higher than the opening price, we are talking about a bullish candle. [they are usually green]
If the closing price is lower than the opening price, we are talking about a bearish candle [they are usually red]
On the other hand, we have the body of the candle, which is the price path between its opening and closing.
In addition, in the course of the candles, you can mark highs and lows at the closing price. All that information is provided by the wick.
Of course, Japanese candles are just one type of candle. There are many more. Let’s talk about some of them.
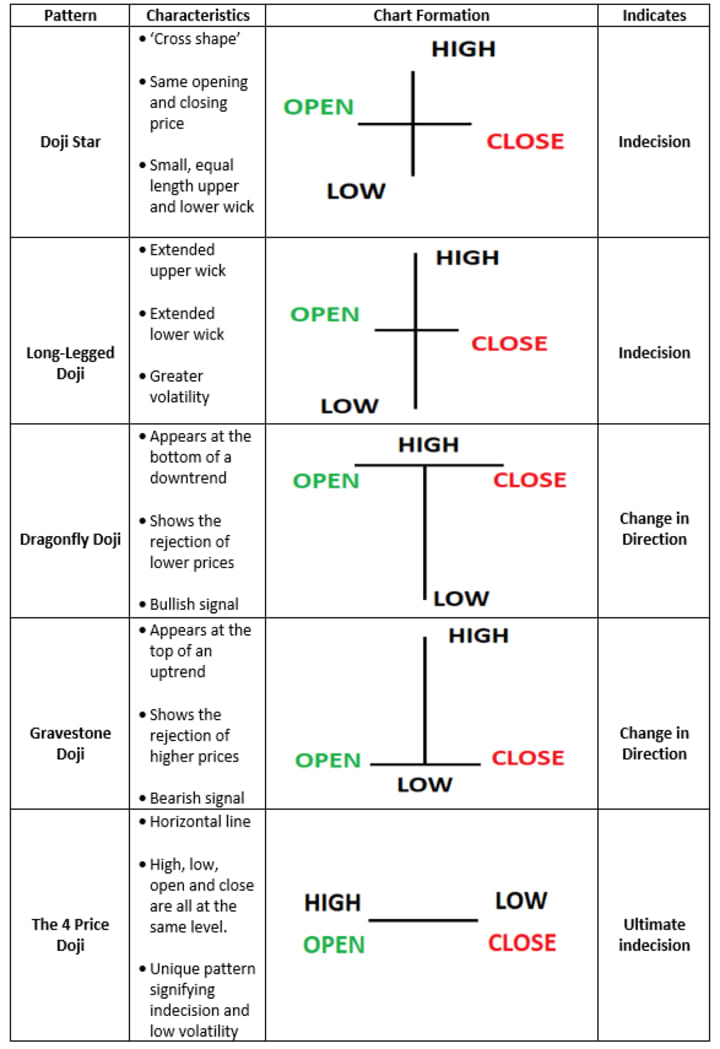
Doji Candles
These candles show indecision and can also indicate a possible change in trends. On the downside, they are called “Gravestone”, on the upside “Dragon-fly”.
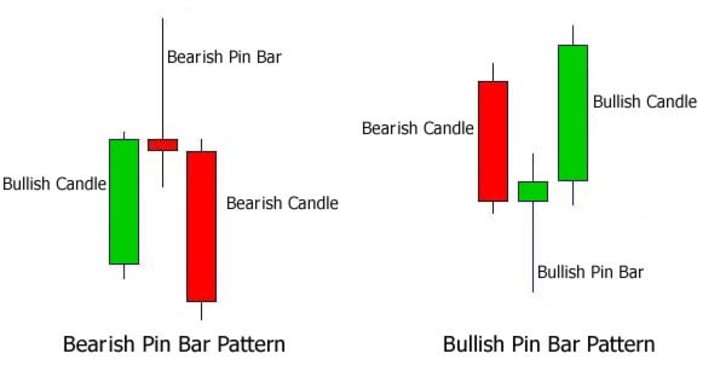
Hammer Candles [Pin Bar]
This candle has a long wick, they are usually found at the end of a trend. They serve to indicate a change in it.
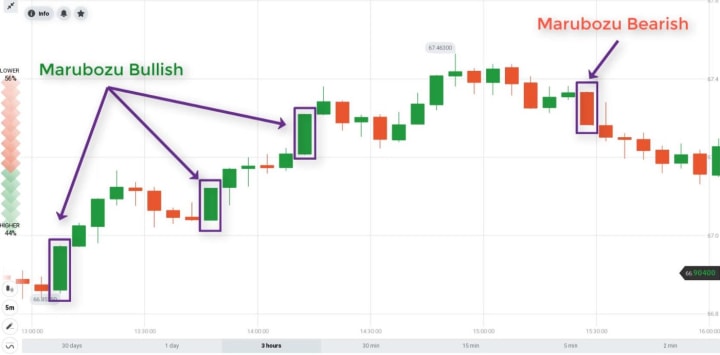
Marubozu Candles
They are large candles, they hardly have a candle. These indicate strength in price. Both up and down.
Most popular candles patterns
Engulfing candles
The wingspan completely covers the previous one. Both bullish and bearish.
Tweezer Bottom and Tweezer Top
Stars: Morning & Evening
The price revolves around three candles. The central candle has very little body. It could be a Doji as we have seen previously.
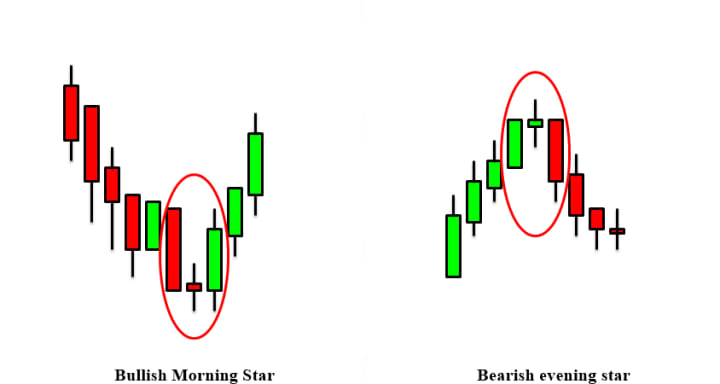
Patterns are not 100% effective and do not always have to be met. Remember, the most you learn is by putting it into practice.
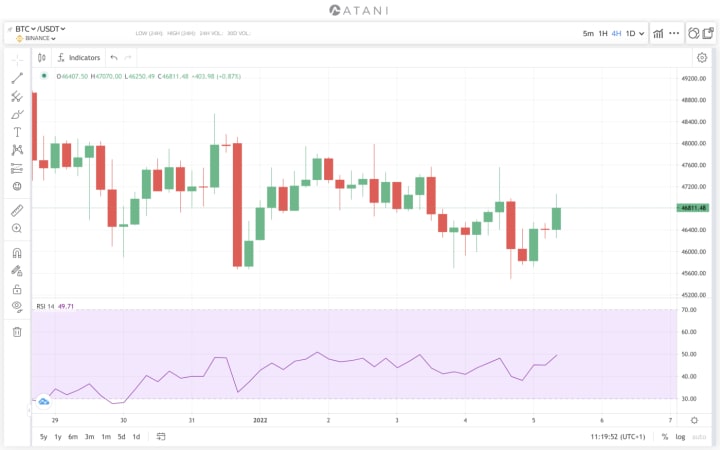
RSI Indicator
RSI stands for Relative Strength Index. It indicates the strength of the bullish movements compared to the bearish ones.
It is measured from 0 to 100. When the indicator is shown above 70 it will be overbought. If it is below 30 it will be oversold. If you are between 70 and 30, you will be in your normal range to trade.
Many people initially use it this way: when it’s oversold I buy. When it’s overbought, I sell. But sometimes this is not the case. There is no use of a single indicator.
Bullish divergence: This shows us a disparity between the index and the Japanese candles where while they are bearish, the RSI shows the opposite. This indicates that the average of these candles is bullish and then an upward movement is approaching.
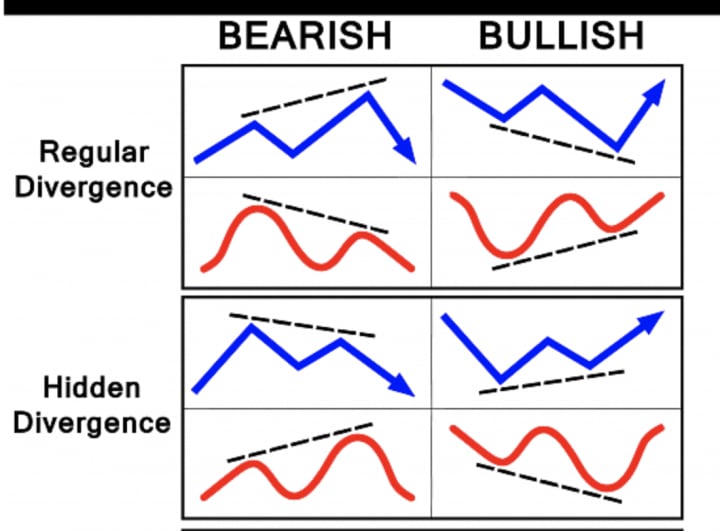
Bearish divergence: it is just the opposite.
The indicator is placed once the price has been closed in the timeframe in which you are. That is, it lags behind the price, not before the price.
If you found this article useful, please, share it on socials, so we can reach more people.
Stay tuned for Chapter Two.
Disclaimer: This article is for informational purposes only. It should not be considered Financial or Legal Advice. Not all information will be accurate. Consult a financial professional before making any major financial decisions.
This article was previously published on Medium by the same author.
Join our crypto community and learn for FREE!
Subscribe to the FREE weekly Newsletter of The Edition with Juan Cienfuegos 📨☕️🪴
About the Creator
Juan Cienfuegos
Host of BitCorner 🎙️The 1st Salvadoran Bitcoin Podcast | Author of The Savior: #Bitcoin 🇸🇻⚡️ | engineer + educator
Keep reading
More stories from Juan Cienfuegos and writers in 01 and other communities.
MacBook Pro 16" With The M1 Pro Chip, Review
When I was watching the unleashed event one of the first things that came to my mind was Apple is going to knock out Intel with the M1 Pro presentation. But I was completely wrong. I thought I was right because a couple of weeks ago I was watching that awful Intel ad where they were mocking Apple.
By Juan Cienfuegos2 years ago in 01
Neopolis: The Bitcoin Uprising.
In the year 2145, the world was no longer divided by borders or nations but by digital currencies. The most powerful of them all was Bitcoin, whose value now determined the fate of entire regions. The wealthy lived in encrypted enclaves, protected by the most advanced cryptographic defenses. The rest of the population lived in the shadows, struggling to survive in a world where every transaction was monitored and controlled by a central authority known as the Bitcoin Consortium.
By Thinh Phan3 days ago in 01


Comments
There are no comments for this story
Be the first to respond and start the conversation.